
 CA
 NZ
 UK
 AU
 IND

 US

 Share
 X (Formerly Twitter)
 Whatsapp
 Facebook
 LinkedIn
 Telegram
 Email This Article
 Copy Link
 Summarize with AI
 Chat GPT
 Perplexity

Sector: Communication Services (Interactive Media)
Meta Platforms, Inc. (NASDAQ: META) is having a firm session after a two-week pullback from its September high. As of this chart snapshot (about 55 minutes before the close), shares are trading at $742.74, up $24.07 (+3.35%). The stock gapped up from Friday's close near $718.67 to open at $728.50, held above $727.64 all day, and spiked to an intraday high of $752.24 before easing back. The move rebounds from the 21-day EMA, which has held since the September breakout. I could not find a company-specific catalyst, so the case rests on the chart. 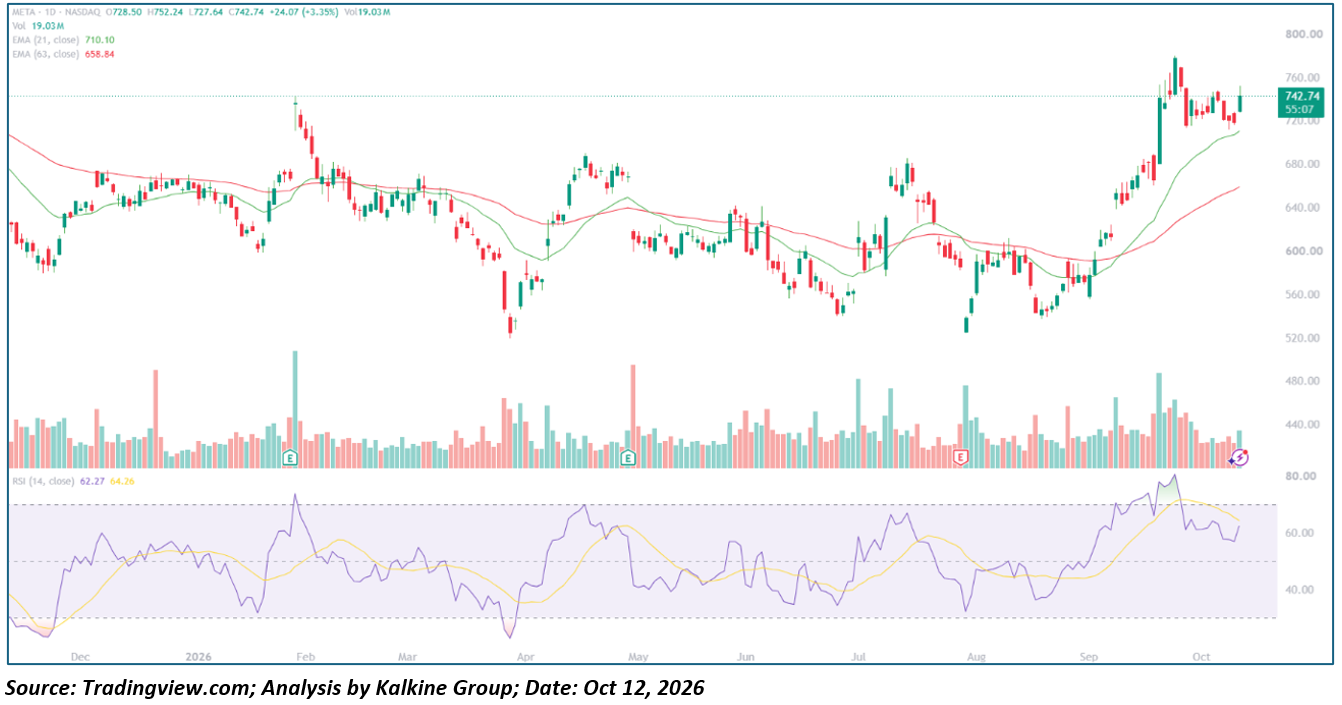
Key Highlights
- Trading at $742.74, up $24.07 (+3.35%), on partial-session Volume of 19.03M shares
- Opened at $728.50 (gap up), low of $727.64, high of $752.24
- 21-day EMA at $710.10 and 63-day EMA at $658.84, both below price
- 14-day RSI at 62.27, below its 64.26 signal line but turning up from the high 50s
- Resistance at $752.24 and $780; gap support at $728.50 and $718.67
Trend Structure: Three-Act Pattern
- Range and Spike (November 2025 – January 2026): The stock dipped to about $580 in November, then ranged between roughly $600 and $670 into the new year. It spiked to about $745 around the late-January Earnings report, then reversed sharply.
- Markdown and Range (February – August 2026): A steep decline took the stock to a low near $520 in late March, where RSI fell to about 22, an oversold reading. A rebound to about $690 in late April faded, and the stock ranged between about $540 and $690 through the summer. A drop to about $525 around the early-August earnings report marked the cycle low.
- Breakout and Pullback (September – October 2026): The stock rallied about 48% from the August low to a high near $780 in late September, Gapping through $700 and reclaiming both EMAs on heavy volume. A pullback to about $712 in early October held at the 21-day EMA, and today's gap lifts price back toward the top of the recent range.
Backdrop
The next earnings report is typically due in late October, so confirm the date. The earnings markers on the chart line up with some of the largest moves, including the January Reversal and the August low. The report is likely the next large catalyst.
Moving Averages and Momentum Profile
- Gap Dynamics: The stock opened at $728.50, held above its $727.64 low and has not tried to Fill the gap. The spike to $752.24 faded, leaving an upper wick that shows sellers near the top of the range.
- Moving Average Stack: The 21-day EMA ($710.10) is above the 63-day EMA ($658.84), and both are rising. Price is about 4.6% above the 21-day and 12.7% above the 63-day, so the 21-day is the first line of support on a pullback.
- Oscillator Behavior: RSI at 62.27 has recovered from the high 50s but remains below its 64.26 signal line. It peaked near 80 in late September, so momentum has cooled from overbought levels without breaking down.
- Volume Behavior: Volume of 19.03M is partial, with the session still open. It is well below the heavy-volume surge in September, so a close on above-average volume would add weight to the rebound.
Key Technical Levels
|
Level |
Type |
Note |
|
$780 |
Resistance |
Late-September cycle high (approximate) |
|
$752.24 |
Resistance |
Today's intraday high |
|
$745 |
Resistance |
Late-January spike high (approximate) |
|
$742.74 |
Reference |
Current price |
|
$728.50 |
Support |
Today's open, top of the gap |
|
$727.64 |
Support |
Today's low |
|
$718.67 |
Support |
Friday's close, bottom of the gap |
|
$712 |
Support |
Early-October pullback low (approximate) |
|
$710.10 |
Support |
21-day EMA |
|
$658.84 |
Support |
63-day EMA |
Actionable Technical Outlook
- A close above $752 would extend the rebound and put the $780 September high in play. A move through $780 would set a new cycle high and resume the uptrend.
- Near-term structure stays constructive while the stock holds above the $728.50 gap top. A close back into the gap would signal fading conviction, with $718.67, $712 and the 21-day EMA near $710 as the next reference points.
- The upper wick shows the market is not yet convinced, so a retest of $728 to $735 is possible before any breakout. This is a technical read, not Investment advice.
Metadata
|
Field |
Value |
|
Headline |
Why is Meta Platforms (NASDAQ: META) rebounding 3.35% to $742.74 off its 21-day EMA, and can it clear $752? |
|
SEO title |
Meta (META) Rebounds 3.35% to $742.74: 21-Day EMA and $752 Level |
|
Meta description |
Meta Platforms (NASDAQ: META) jumps 3.35% to $742.74 off its 21-day EMA. RSI 62, key gap support and resistance levels for traders. |
|
Slug |
why-meta-platforms-meta-nasdaq-stock-rebounds-21-day-ema-752-level |
|
Tags |
Meta Platforms, META, NASDAQ, social media, technical analysis, moving averages, gap up |
|
Ticker / Sector |
META / Communication Services |
|
Verification status |
PARTIAL (levels read from the chart; catalyst not confirmed) |
|
Data as-of date |
October 12, 2026 (intraday; chart snapshot taken October 13 at 00:34 IST, about 55 minutes before the US close) |


 Nov 12, 2026





 Please wait processing your request...