
 CA
 NZ
 UK
 AU
 IND

 US

 Share
 X (Formerly Twitter)
 Whatsapp
 Facebook
 LinkedIn
 Telegram
 Email This Article
 Copy Link
 Summarize with AI
 Chat GPT
 Perplexity

Sector: Information Technology (Semiconductors and Memory)
Micron Technology, Inc. (NASDAQ: MU) is under steady pressure after failing near $1,100 for a second time. As of this chart snapshot (about 56 minutes before the close), shares are trading at $987.70, down $41.30 (-4.01%), on partial-session Volume of 17.46M shares. The stock opened at $1,002.45 below Friday's close of about $1,029.00, touched a high of $1,002.67 and slid to a low of $978.50, so it is trading near the bottom of its range. The drop is the fifth red bar in the last six and takes price below the 21-day EMA, right to the 63-day EMA. I could not find a company-specific catalyst, so the case rests on the chart. 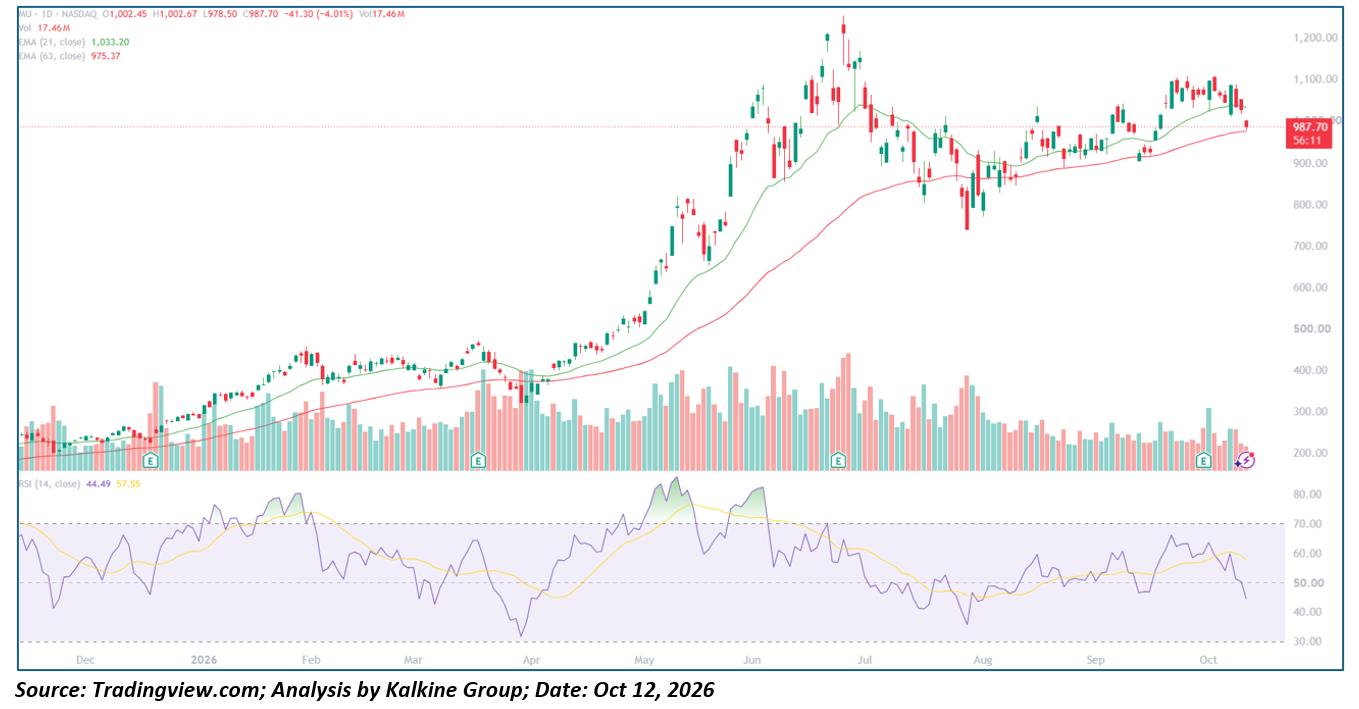
Key Highlights
- Trading at $987.70, down $41.30 (-4.01%), on partial-session volume of 17.46M shares
- Opened at $1,002.45 (gap down), high of $1,002.67, low of $978.50
- 21-day EMA at $1,033.20 (above price) and 63-day EMA at $975.37 (just below price)
- 14-day RSI at 44.49, below its 57.55 signal line and under 50 for the first time since early September
- Resistance at $1,033.20 and $1,029; support at $978.50, $975.37 and the mid-September low near $935
Trend Structure: Three-Act Pattern
- Advance and Pullback (November 2025 – March 2026): MU climbed from about $240 in November to roughly $450 in late January, with RSI near 80, then ranged between about $360 and $470 through March. It dipped to about $315 in early April, where RSI fell to about 32, an oversold reading.
- Vertical Rally and Peak (April – June 2026): A steep climb carried the stock from about $330 to a peak near $1,250 in late June, a gain of nearly fourfold on heavy volume. RSI stayed overbought from May into June, reaching about 83.
- Correction and Range (July – October 2026): The stock lost about 40% to a low near $740 in late July, then rebuilt through August and September and reclaimed both EMAs. It reached about $1,100 in late September and again in early October, a lower high than June. Today's drop breaks below the 21-day EMA. The stock is about 21% below the June peak but still about 33% above the July low.
Backdrop
The next quarterly Earnings report is typically due in late December, so confirm the date. The earnings markers on the chart line up with the late-January advance, the March move, the June peak and the early-October period, so the stock has been active around reports. A drop of 4% on a gap suggests sector weakness, so check for news in memory, AI-hardware and semiconductor names before publishing.
Moving Averages and Momentum Profile
- Moving Average Stack: The 21-day EMA ($1,033.20) is above the 63-day EMA ($975.37), and both are rising. That is still a bullish stack, though the gap has narrowed. Price is about 4.4% below the 21-day and only about 1.3% above the 63-day, so the 21-day acts as resistance and the 63-day is the last line of support before the September low.
- Candle Behavior: Today's candle is a large red bar that gapped down, never recovered the open and is trading near its low. It follows a series of lower highs from the early-October peak and a failed push toward $1,100, which shows sellers in control at the top of the range.
- Oscillator Behavior: RSI at 44.49 has fallen from about 65 in late September and crossed below its signal line at 57.55. It is now below 50, which signals that momentum has turned bearish in the short term, and the range lows near 36 in late July are the next reference.
- Volume Behavior: Volume of 17.46M is partial, with the session still open. It is moderate against the earlier surge in June and July, so a close on rising volume below the 63-day EMA would give the breakdown more weight.
Key Technical Levels
|
Level |
Type |
Note |
|
$1,250 |
Resistance |
Late-June cycle high (approximate) |
|
$1,100 |
Resistance |
Late-September and early-October double top (approximate) |
|
$1,033.20 |
Resistance |
21-day EMA |
|
$1,029.00 |
Resistance |
Friday's close, top of the gap (derived from today's change) |
|
$1,002.67 |
Resistance |
Today's intraday high |
|
$987.70 |
Reference |
Current price |
|
$978.50 |
Support |
Today's low |
|
$975.37 |
Support |
63-day EMA |
|
$935 |
Support |
Mid-September swing low (approximate) |
|
$740 |
Support |
Late-July cycle low (approximate) |
Actionable Technical Outlook
- A close below the 63-day EMA near $975 would break the support that has held every pullback since August and put the $935 September low in play. A break of that low would cancel the higher-low structure and open the way toward $850 to $900.
- A close back above the 21-day EMA near $1,033 would take pressure off, and a move above Friday's $1,029 close and then the $1,100 double top would restore the uptrend.
- The 63-day EMA is right under price, so a test of it is likely today or in the next sessions. A bounce from there would need to clear $1,033 to change the picture, and the lower highs since June favor selling into strength. This is a technical read, not Investment advice.
Metadata
|
Field |
Value |
|
Headline |
Why is Micron (NASDAQ: MU) sliding 4% to $987.70 below its 21-day EMA, and can it hold the 63-day EMA near $975? |
|
SEO title |
Micron (MU) Falls 4% to $987.70: 21-Day EMA Break and $975 Support |
|
Meta description |
Micron (NASDAQ: MU) drops 4% to $987.70 below its 21-day EMA. RSI 44, key support and resistance levels for traders. |
|
Slug |
why-micron-mu-nasdaq-stock-slides-21-day-ema-break-975-support |
|
Tags |
Micron, MU, NASDAQ, semiconductors, memory, technical analysis, moving averages, gap down |
|
Ticker / Sector |
MU / Information Technology |
|
Verification status |
PARTIAL (levels read from the chart; catalyst not confirmed) |
|
Data as-of date |
October 12, 2026 (intraday; chart snapshot taken October 13 at 00:33 IST, about 56 minutes before the US close) |


 Nov 19, 2026





 Please wait processing your request...