
 CA
 NZ
 UK
 AU
 IND

 US

 Share
 X (Formerly Twitter)
 Whatsapp
 Facebook
 LinkedIn
 Telegram
 Email This Article
 Copy Link
 Summarize with AI
 Chat GPT
 Perplexity

Spotify Technology S.A. (NYSE: SPOT) is breaking out aggressively to fresh chart highs, clearing multi-month overhead resistance with a high-volume expansion gap. As of this chart snapshot (about 6 minutes before the close), shares are trading at $581.27, up $55.93 (+10.65%). The stock gapped up above yesterday's close near $525.34 to open at $561.29, touched an intraday low of $555.32, and surged to an intraday peak of $588.88. The rally represents a 26% advance from the early-October pullback low near $460.00, decisively clearing the prior September peak near $565.00. The breakout coincides directly with an active Earnings marker on the chart, indicating that fundamental results and forward subscriber/margin metrics provided the primary catalyst. 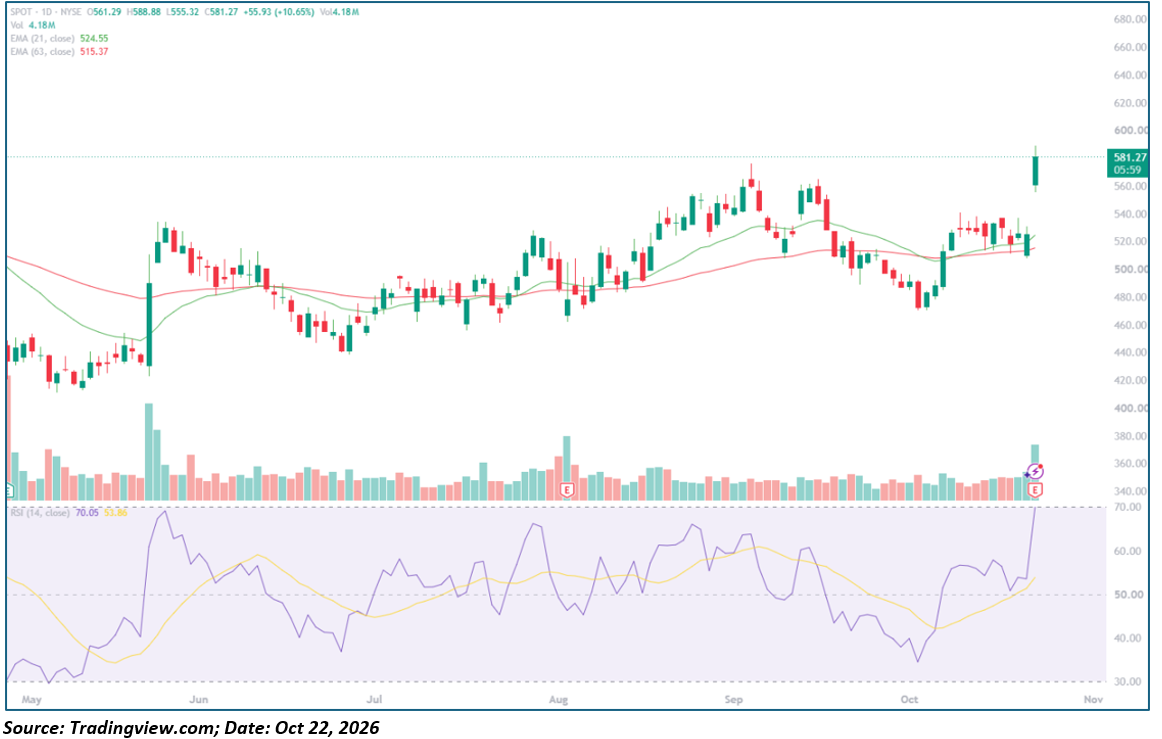
Key Highlights
- Trading at $581.27, up $55.93 (+10.65%), on heavy session Volume of 4.18M shares.
- Opened at $561.29 (gap up), printed a low of $555.32, and touched a high of $588.88.
- The 21-day EMA is at $524.55 and the 63-day EMA is at $515.37, with price extending well above both dynamic moving averages.
- The 14-day RSI is at 70.05, surging above its 53.86 signal line and crossing directly into overbought territory.
- Prior resistance sits at ~$565.00 (September swing peak), with round-number targets at ~$600.00 above it. Support lies at $555.32 (session low), $524.55 (21-day EMA), and $515.37 (63-day EMA).
Trend Structure: Four-Act Pattern
- May Consolidation and June Expansion (May – June 2026):
SPOT traded between $420.00 and $450.00 in May with the 14-day RSI in the 30s. An earnings catalyst in late May triggered a vertical gap-and-go rally to $535.00 on massive volume (over 40M shares on the peak bar), lifting the RSI into the mid-70s before settling into an orderly pullback toward $450.00 by late June.
- Mid-Summer Base Building and Trend Resumption (July – August 2026):
The stock formed a higher low above $460.00 in July, gradually reclaiming both its 21-day and 63-day EMAs. A late-July earnings gap briefly tested $480.00 before aggressive buying pushed shares to an interim swing peak of $565.00 in late August.
- Autumn Pullback and EMA Compression (September – Early October 2026):
After topping near $565.00, SPOT encountered profit-taking that forced a steady drift lower. Shares sliced beneath the 21-day and 63-day EMAs, carving out a corrective trough near $460.00 in early October as the RSI dropped into the high-30s.
- Earnings Gap Breakout (Late October 2026):
Buyers returned strongly off the $460.00 base, driving a steady recovery into the moving-average cluster near $520.00. The current session produced a massive earnings gap-up that cleared the September double-top resistance near $565.00, driving the price to new highs at $588.88 and pushing the RSI into overbought territory at 70.05.
Backdrop
Volume across the late-summer consolidation remained quiet, with the largest spikes tied strictly to quarterly earnings events in late May, late July, and today's session. The current volume print of 4.18M shares represents the strongest turnover since July, confirming substantial institutional sponsorship behind the gap. The "E" markers align with quarterly reporting cycles, indicating that corporate results, subscriber growth, and gross Margin expansion continue to dictate major trend legs.
Moving Averages and Momentum Profile
- Candle Dynamics: The session opened at $561.29 (well above the prior day's close), printed a shallow dip to $555.32, and drove through the afternoon to touch $588.88 before settling near $581.27. The large green expansion candle demonstrates firm buyer control through the close.
- Moving Average Stack: The 21-day EMA ($524.55) has curled sharply upward above the 63-day EMA ($515.37). Price is trading roughly 10.8% above the 21-day EMA and 12.8% above the 63-day EMA, confirming strong momentum while leaving price somewhat stretched above its baseline.
- Oscillator Behavior: The 14-day RSI sits at 70.05, extending well above its 53.86 signal line. Reaching overbought territory reflects acute buying pressure, though sustained breakout trends often remain overbought for several sessions before consolidating.
- Volume Behavior: Turnout of 4.18M shares is significantly elevated compared to the preceding two months of consolidation, validating the technical breakout with heavy institutional volume.
Key Technical Levels
|
Level |
Type |
Note |
|---|---|---|
|
~$600.00 |
Resistance |
Major psychological milestone and round-number target |
|
$588.88 |
Resistance |
Intraday high of the day and immediate ceiling |
|
$581.27 |
Reference |
Current market price |
|
~$565.00 |
Support |
Late-August/early-September swing peak (prior resistance turned support) |
|
$555.32 |
Support |
Intraday session low and top of the gap zone |
|
$524.55 |
Support |
Dynamic 21-day EMA |
|
$515.37 |
Support |
Dynamic 63-day EMA |
|
~$460.00 |
Major Support |
Early-October swing low and cycle base |
Historical levels are approximate readings from the supplied daily chart. The 21-day and 63-day EMA values reflect the chart overlay labels.
Actionable Technical Outlook
- Bullish Scenario: A daily close holding above the prior resistance shelf at $565.00, followed by a breakout above $588.88, confirms blue-sky price discovery with an open technical path toward the psychological $600.00 milestone.
- Pullback Scenario: With the RSI hitting 70.05 and the price extended ~10.8% over the 21-day EMA, a retest of the gap floor between $555.32 and $565.00 is common. If buyers step in to defend this zone as new support, it establishes a high-probability continuation platform.
- Bearish / Invalidation Scenario: A daily close back below $555.32 would signal a gap fade, while a breakdown below the 21-day EMA ($524.55) would neutralize near-term upside momentum and risk re-entering the pre-earnings range.
Metadata
|
Field |
Value |
|---|---|
|
Headline |
Why is Spotify (NYSE: SPOT) Surging 10.65% to $581.27 at a New High, and Can It Hold Above $565? |
|
SEO title |
Spotify (SPOT) Stock Hits New High at $581: Earnings Breakout, RSI 70, and $600 Target |
|
Meta description |
Spotify Technology (NYSE: SPOT) surges 10.65% to $581.27 on an earnings gap breakout. Technical breakdown covering the $565 shelf, RSI 70, and key levels. |
|
Slug |
why-spotify-spot-stock-surging-earnings-gap-565-support-600-target |
|
Tags |
Spotify, SPOT, NYSE, streaming, interactive media, technical analysis, moving averages, RSI, earnings breakout |
|
Ticker / Sector |
SPOT / Communication Services |
|
Verification status |
PARTIAL (levels read directly from TradingView chart snapshot; fundamental earnings figures require separate company confirmation) |
|
Data as-of date |
October 22, 2026 (intraday; snapshot taken approximately 6 minutes before the US market close) |


 Nov 16, 2026





 Please wait processing your request...