
Section 1: Company Overview and Fundamentals
1.1 Company Overview:
ACM Research, Inc. (NASDAQ: ACMR) develops, manufactures and sells semiconductor process equipment for single-wafer or batch wet cleaning, electroplating, polishing and thermal processes that are critical to advanced semiconductor device manufacturing, as well as wafer-level packaging. The Company offers two principal models of wet wafer cleaning equipment based on its Space Alternated Phase Shift (SAPS) technology, Ultra C SAPS II and Ultra C SAPS V.
Kalkine’s Diversified Opportunities Report covers the Company Overview, Key positives & negatives, Investment summary, Key investment metrics, Top 10 shareholding, Business updates and insights into company recent financial results, Key Risks & Outlook, Price performance and technical summary, Target Price, and Recommendation on the stock.
Stock Performance:
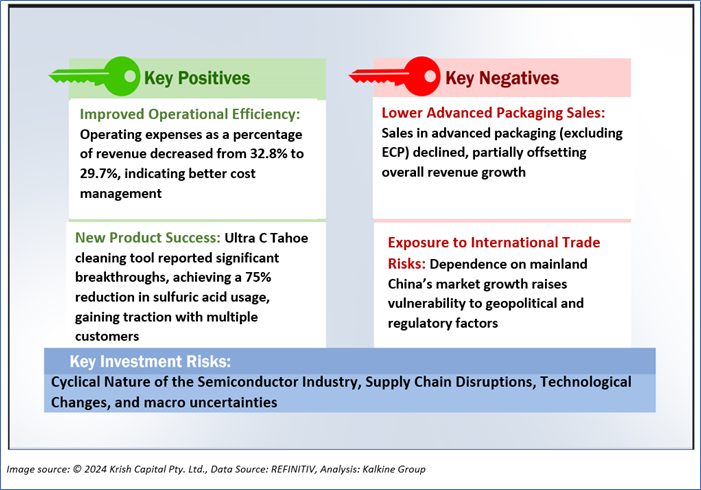
1.2 The Key Positives, Negatives, and Investment summary
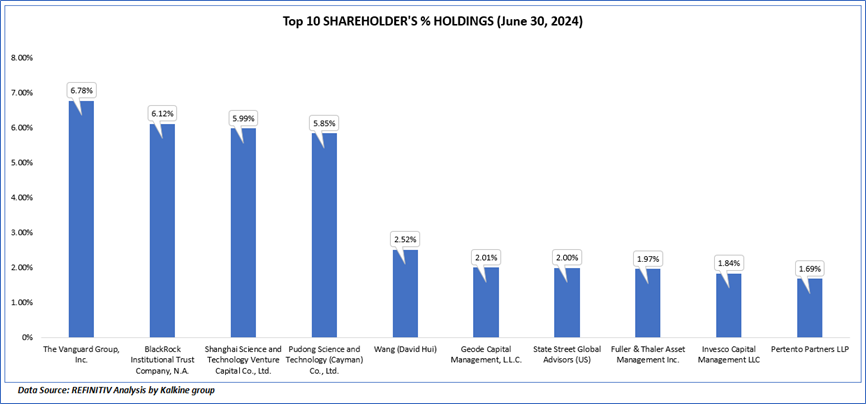
1.3 Top 10 shareholders:
The top 10 shareholders together form ~36.77% of the total shareholding, signifying diverse shareholding. The Vanguard Group, Inc., and BlackRock Institutional Trust Company, N.A. are the biggest shareholders, holding the maximum stake in the company at ~6.78% and ~6.12%, respectively.
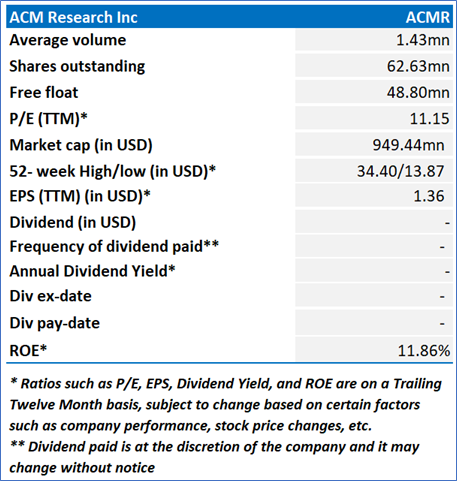
1.4 Key Metrics
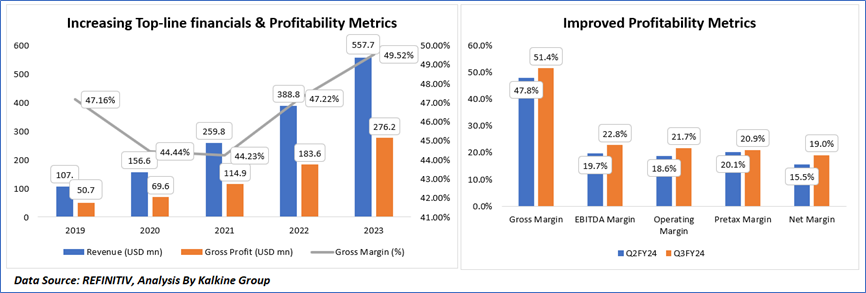
ACM Research has demonstrated consistent revenue growth from USD 107.5 million in 2019 to USD 557.7 million in 2023, with gross profit increasing from USD 50.7 million to USD 276.2 million during the same period. Gross margin has steadily improved from 47.16% in 2019 to 49.52% in 2023. For Q3FY24, the gross margin rose to 51.4% from 47.8% in Q2FY24, supported by enhanced operational efficiency. Margins also saw notable improvements, with EBITDA margin increasing from 19.7% to 22.8%, operating margin rising from 18.6% to 21.7%, and net margin expanding from 15.5% to 19.0%, reflecting stronger profitability across key metrics.
Section 2: Business Updates and Corporate Business Highlights
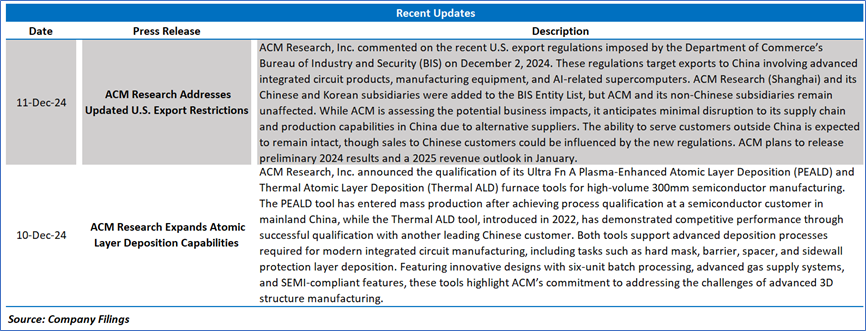
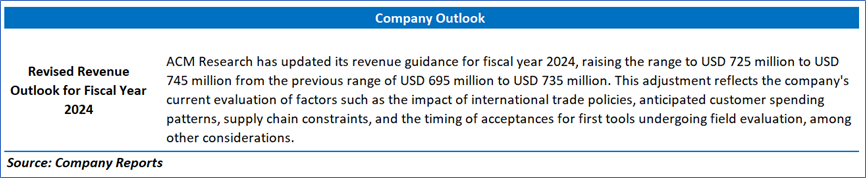
2.1 Recent Updates:
The below picture gives an overview of the recent updates:
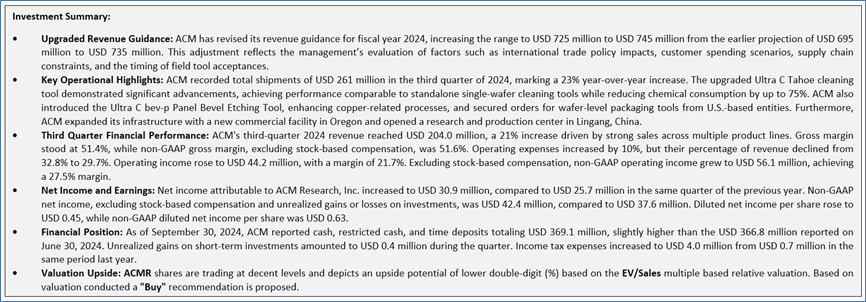
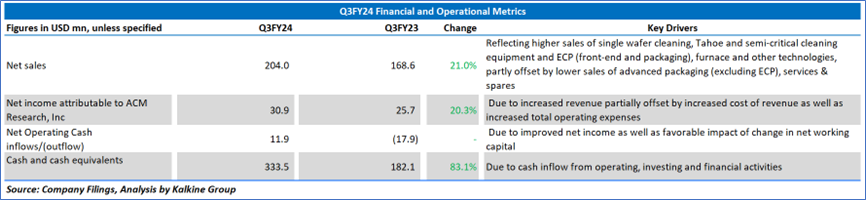
2.2 Insights of Q3FY24:
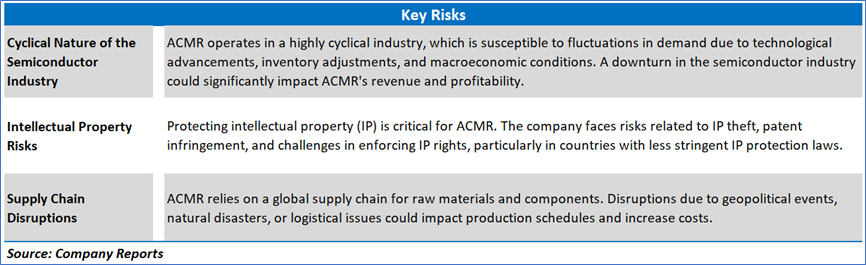
Section 3: Key Risks & Outlook
Section 4: Stock Recommendation Summary:
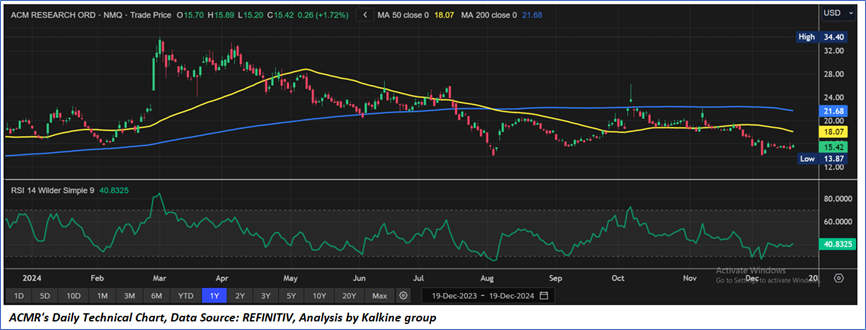
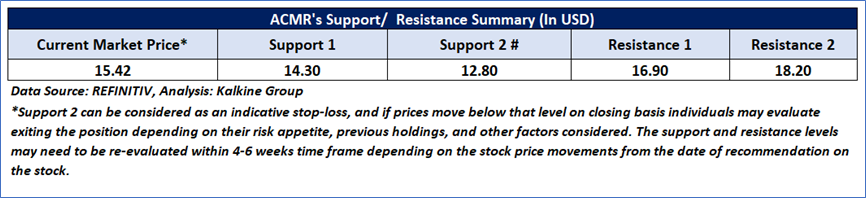
4.1 Price Performance and Technical Summary:
Stock Performance:
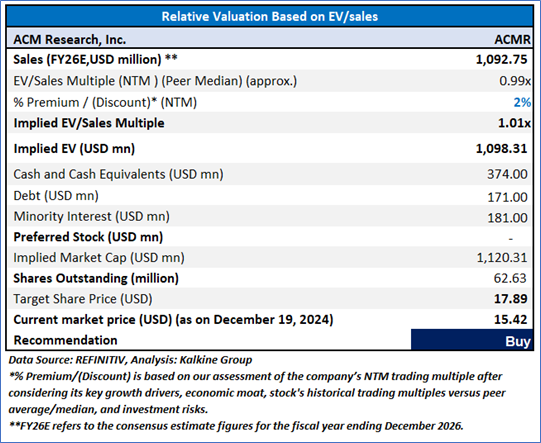
4.2 Fundamental Valuation
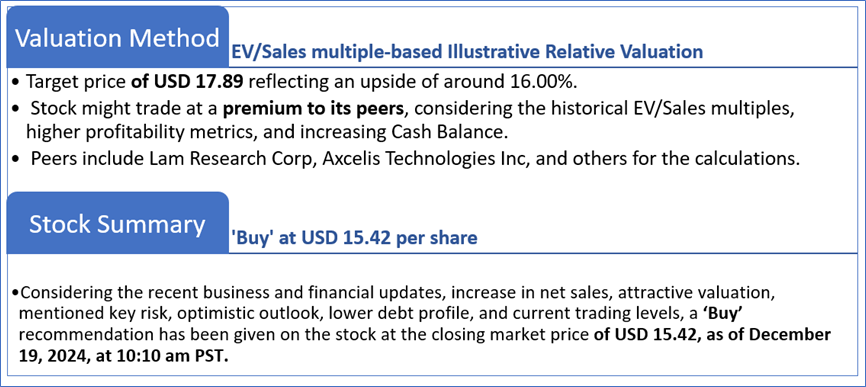
Valuation Methodology: EV/Sales Multiple Based Relative Valuation
Markets are trading in a highly volatile zone currently due to certain macroeconomic issues and geopolitical tensions prevailing. Therefore, it is prudent to follow a cautious approach while investing.
Note 1: Past performance is not a reliable indicator of future performance.
Note 2: The reference date for all price data, currency, technical indicators, support, and resistance levels is December 19, 2024. The reference data in this report has been partly sourced from REFINITIV.
Note 3: Investment decisions should be made depending on an individual's appetite for upside potential, risks, holding duration, and any previous holdings. An 'Exit' from the stock can be considered if the Target Price mentioned as per the Valuation and or the technical levels provided has been achieved and is subject to the factors discussed above.
Note 4: The report publishing date is as per the Pacific Time Zone.
Technical Indicators Defined: -
Support: A level at which the stock prices tend to find support if they are falling, and a downtrend may take a pause backed by demand or buying interest. Support 1 refers to the nearby support level for the stock and if the price breaches the level, then Support 2 may act as the crucial support level for the stock.
Resistance: A level at which the stock prices tend to find resistance when they are rising, and an uptrend may take a pause due to profit booking or selling interest. Resistance 1 refers to the nearby resistance level for the stock and if the price surpasses the level, then Resistance 2 may act as the crucial resistance level for the stock.
Stop-loss: It is a level to protect against further losses in case of unfavorable movement in the stock prices.
Kalkine Equities LLC, with Delaware File Number 4697384, Foreign Qualification Registration in California File Number 202109211078, and Texas File Number 805521396, is authorized to provide general advice only. The information on https://kalkine.com/ does not take into account any of your investment objectives, financial situation or needs. You should consider the appropriateness of advice taking into account your own objectives, financial situation and needs and seek independent financial advice before making any financial decisions. The link to our Terms and Conditions and Privacy Policy has been provided for your reference. On the date of publishing the reports (mentioned on the website), employees and/or associates of Kalkine do not hold positions in any of the stocks covered on the website. These stocks can change any time and readers of the reports should not consider these stocks as advice or recommendations later.
Copyright © 2024 Krish Capital Pty Ltd. All rights reserved.
Past performance is not a reliable indicator of future performance.
 Please wait processing your request...