
Kalkine’s Global Travel & Leisure Report offers a comprehensive view of the key companies and evolving trends across the travel value chain covering countries including US, Canada, Australia, UK, and New Zealand. This includes airlines, hospitality chains, digital travel platforms, as well as the rapidly growing leisure, entertainment, and gaming segments that are redefining the way people engage with travel experiences.

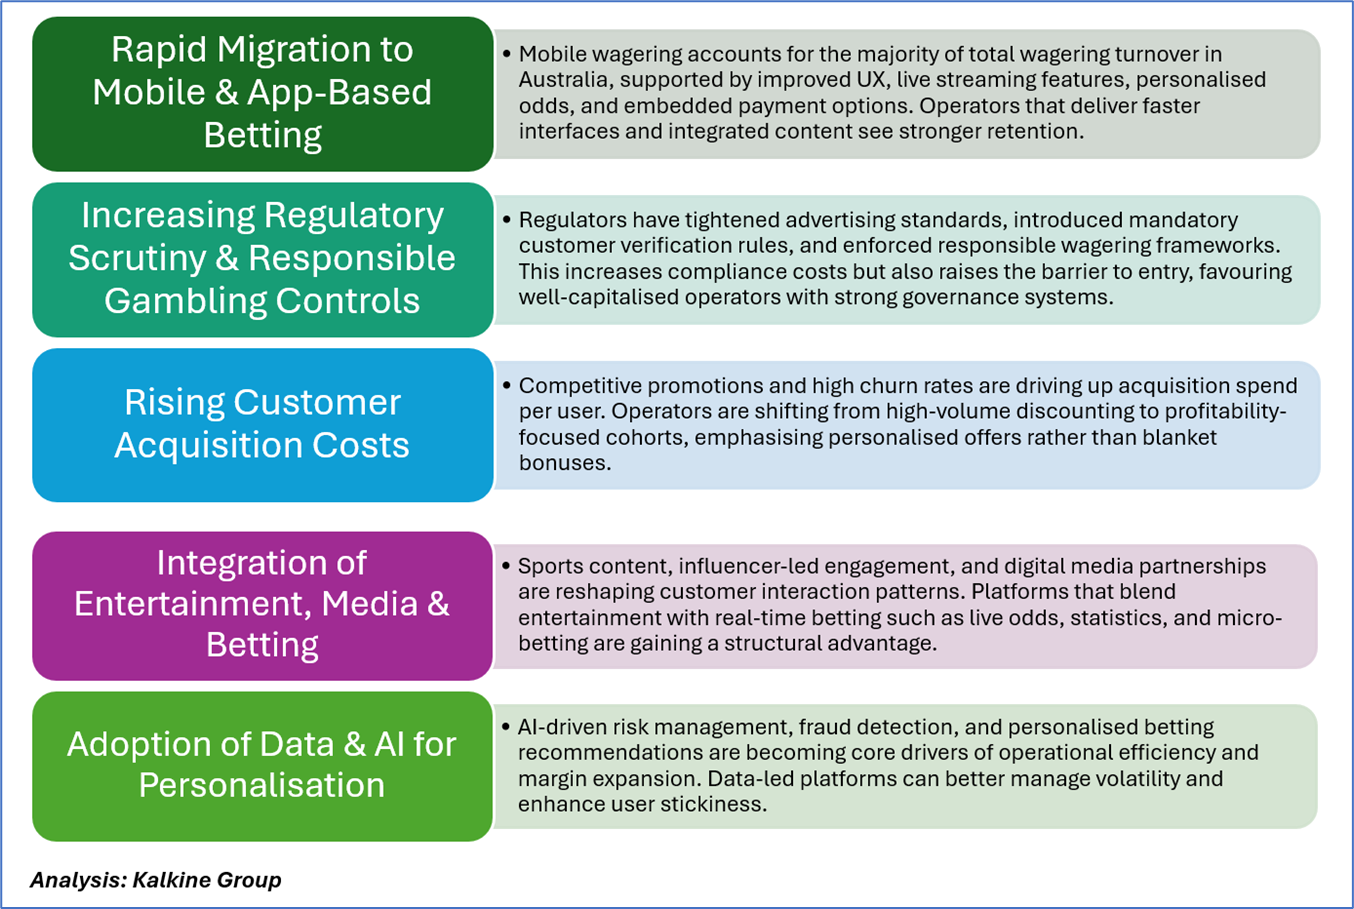
Australia’s online betting and digital entertainment sector has expanded rapidly over the past decade, supported by strong consumer demand for mobile-first wagering platforms, regulatory clarity, and the increasing integration of gaming and real-time sports content. The industry sits within the broader AUD 10 to 12 billion wagering ecosystems, with online channels capturing an ever-growing share as traditional retail betting continues to decline. High smartphone penetration, widespread sports engagement, and the shift toward personalised digital experiences have accelerated the move to app-based wagering.
The competitive landscape remains concentrated, led by established players offering diversified products such as sports betting, racing odds, live betting, and casino-style games (where permitted). New entrants like Betr Entertainment aim to compete through aggressive customer acquisition strategies, targeted promotions, and differentiated technology platforms.


Kalkine’s Global Travel & Leisure Report covers the Investment Highlights, Key Financial Metrics, Risks, Technical Analysis along with the Valuation, Target Price, and Recommendation on Betr Entertainment Limited (ASX: BBT).
Section 1: Company Overview and Fundamentals Insights
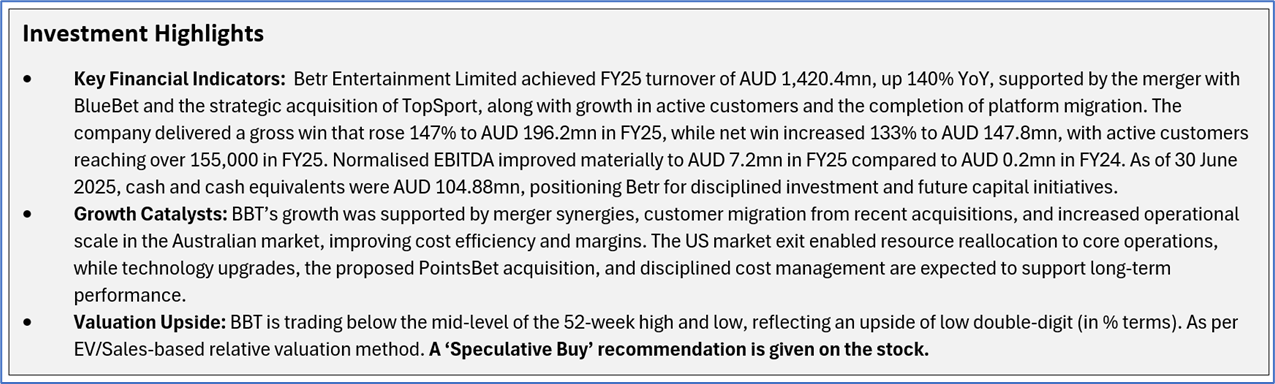
Company Overview: Betr Entertainment Limited (ASX: BBT) is a digital wagering operator offering sports and racing betting through its online platform, mobile apps, and telephone services in Australia and North America. Kalkine’s Global Travel and Leisure Report covers the Investment Highlights, Key Financial Metrics, Risks, and Technical Analysis along with the Valuation, Target Price, and Recommendation on the stock.
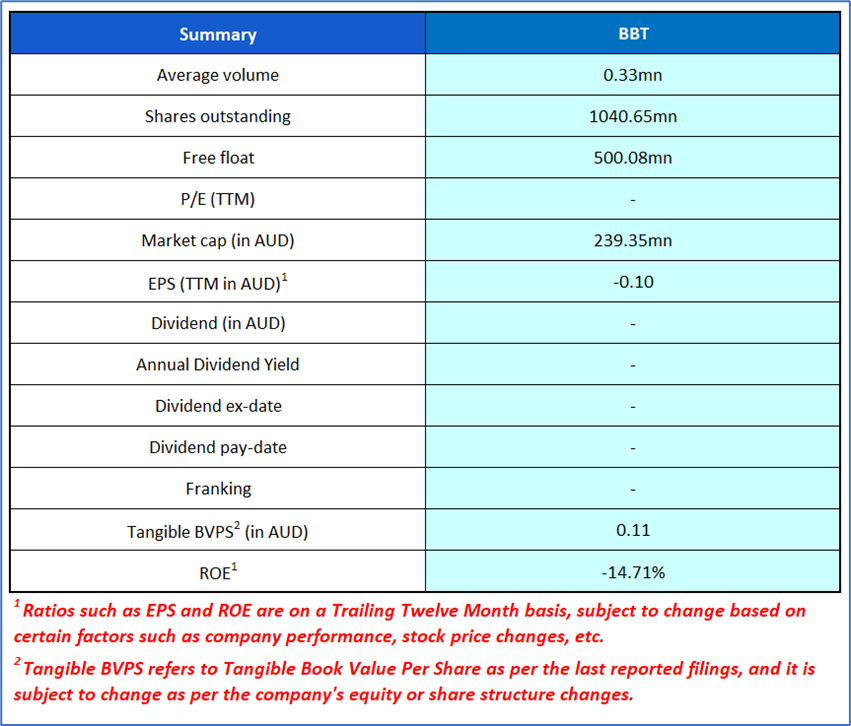
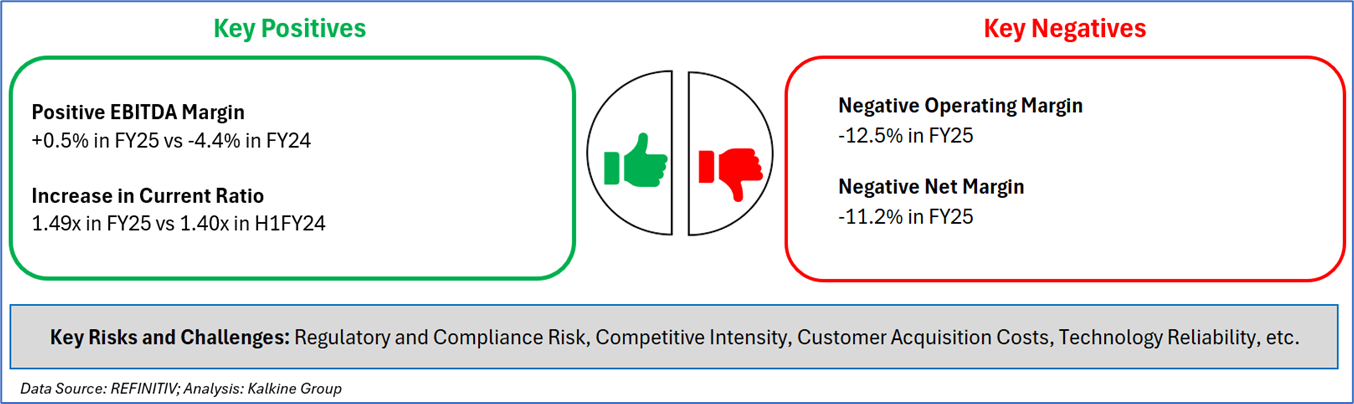
1.2 The Key Positives, Negatives, Investment Highlights, and Risks
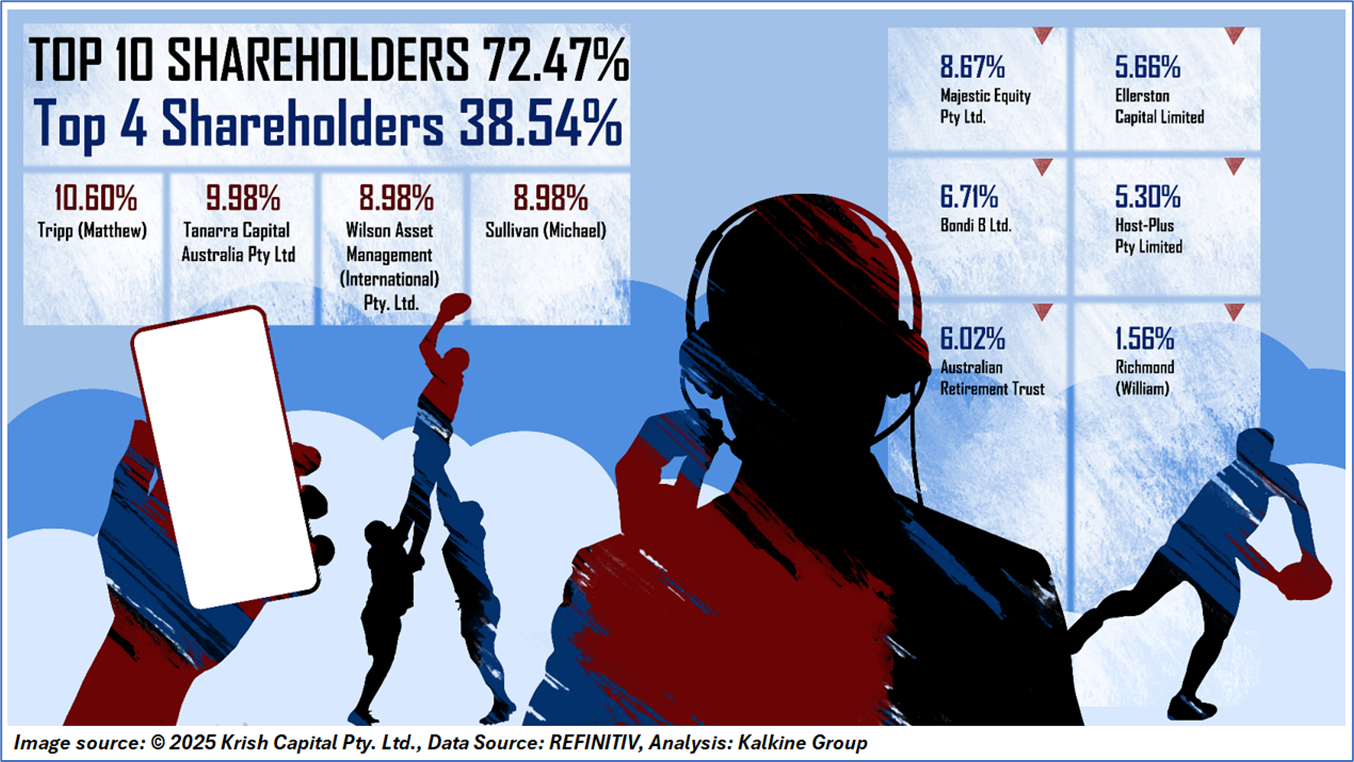
1.3 Top 10 Shareholders:
The top 10 shareholders together form ~72.47% of the total shareholding. Tripp (Matthew), Tanarra Capital Australia Pty Ltd hold maximum stakes of 10.60% and 9.98%, respectively.
1.4 Key Metrics: BBT’s active customers increased to 155,420 in FY25 compared to 70,456 in FY24. Below is captured other metrics:
Section 2: Business Updates, Financial and Operational Highlights
2.1 Recent Business Updates:
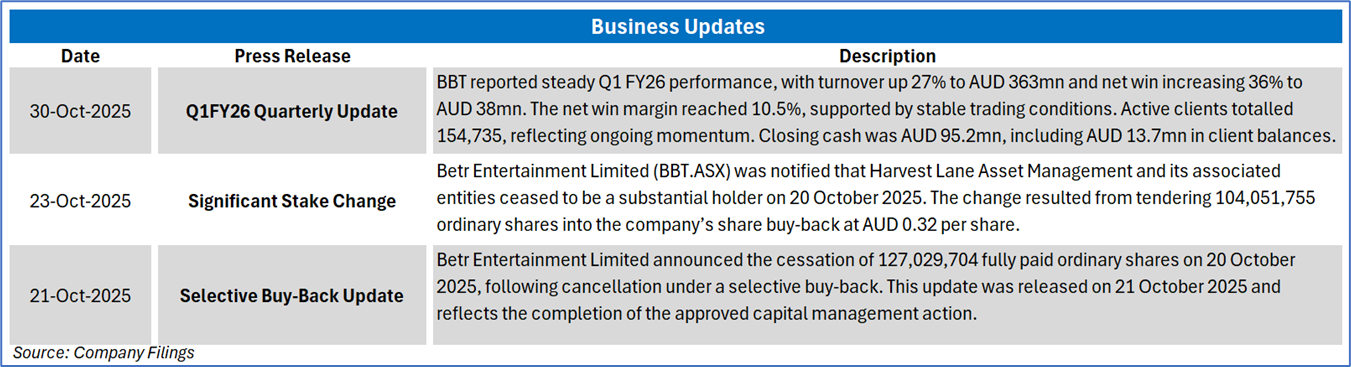
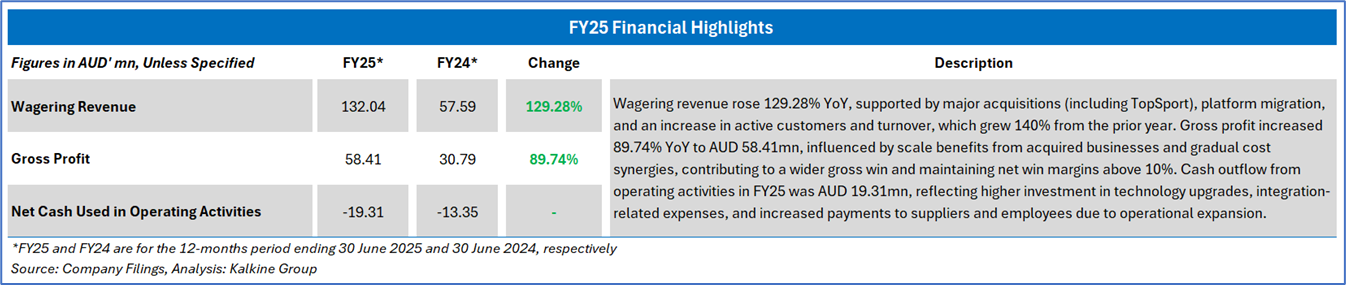
2.2 FY25 Results Highlights (for the 12 months ended 30 June 2025): Below mentioned are some key financial highlights:
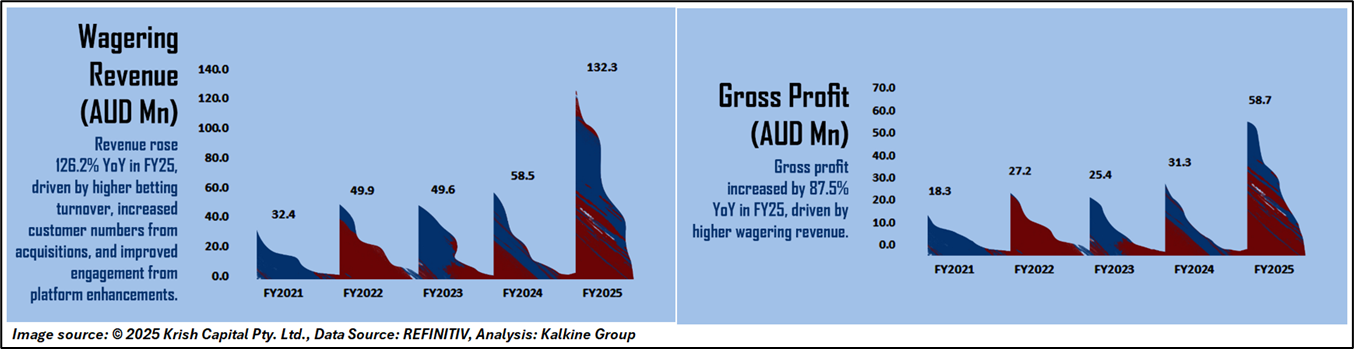
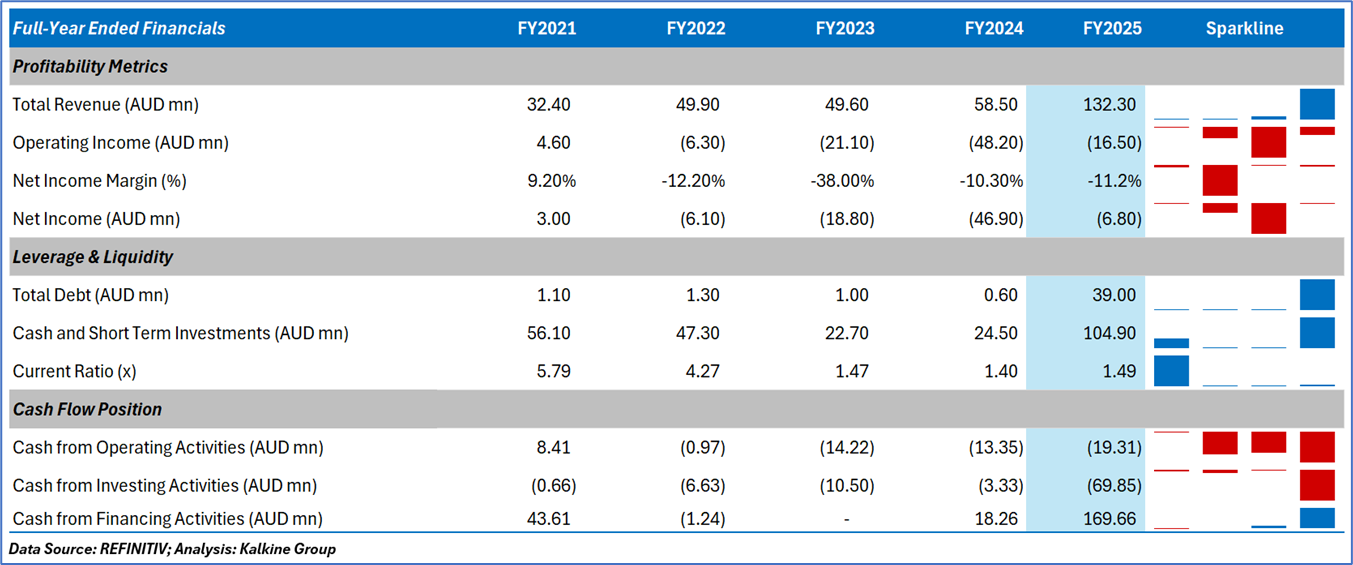
2.3 Historical Financial Trend
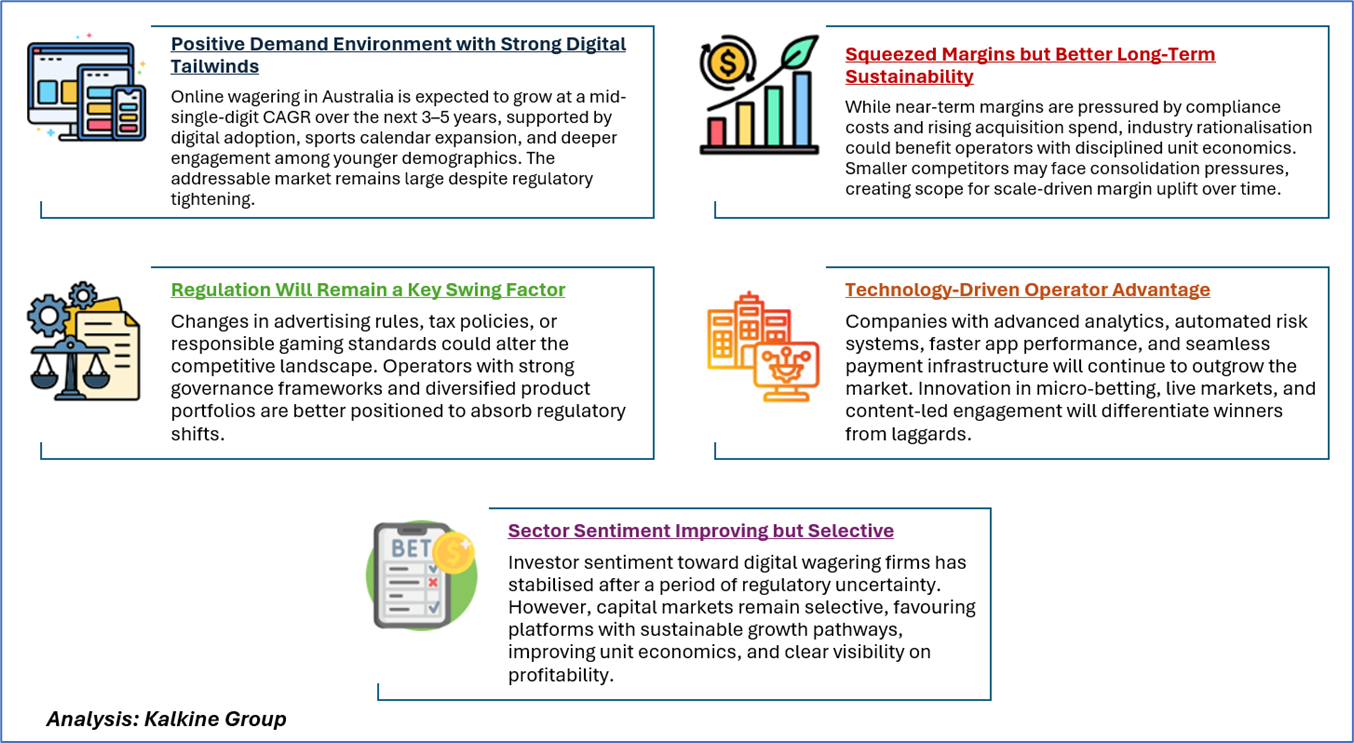
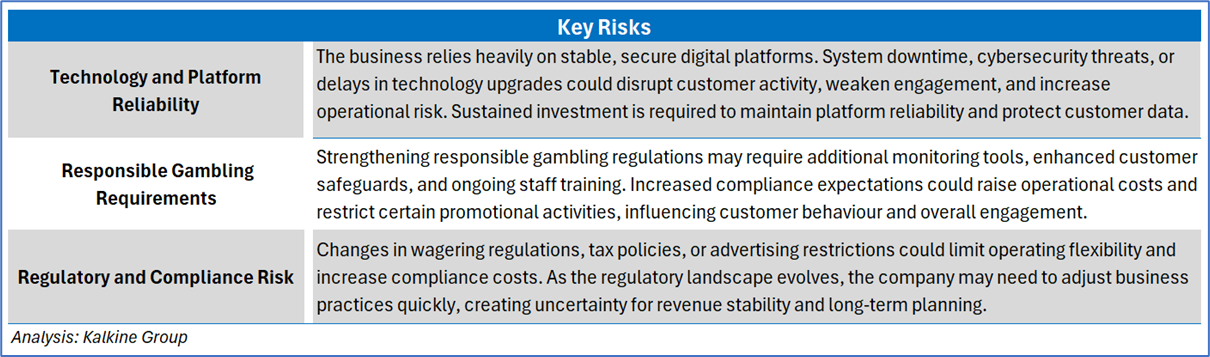
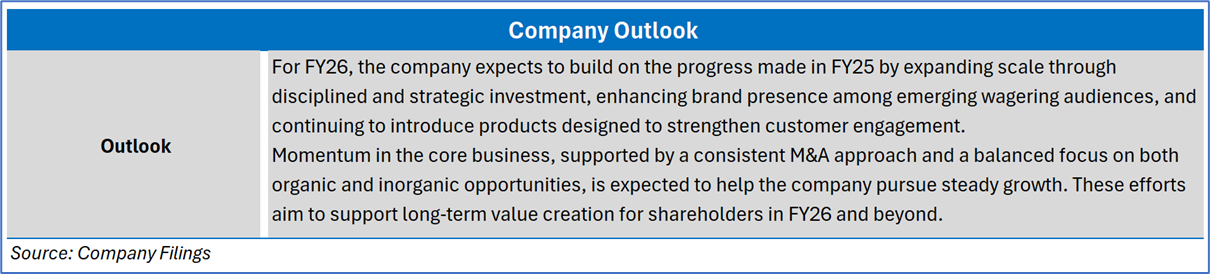
Section 3: Key Risks and Outlook:
Section 4: Stock Recommendation Summary
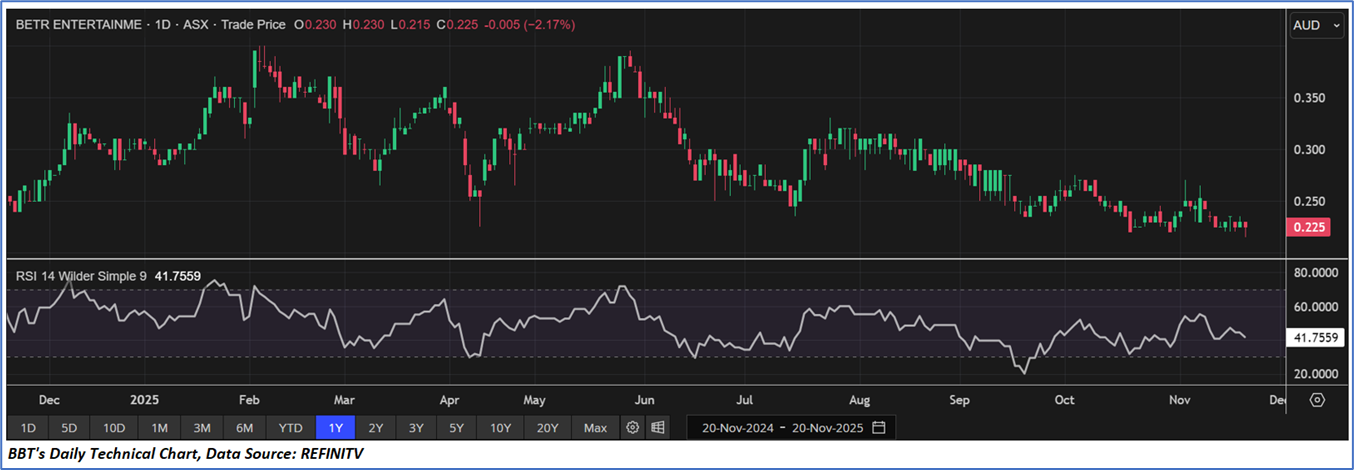
4.1 Price Performance and Technical Summary
The stock has decreased by ~24.99% in the last three months, and over the past six months, stock has decreased by ~36.62%. The stock has a 52-week low and 52-week high of AUD 0.215 and AUD 0.400, respectively, and is currently trading below the 52-week high-low average.
BBT was last covered in a report dated ‘18 July 2025’.
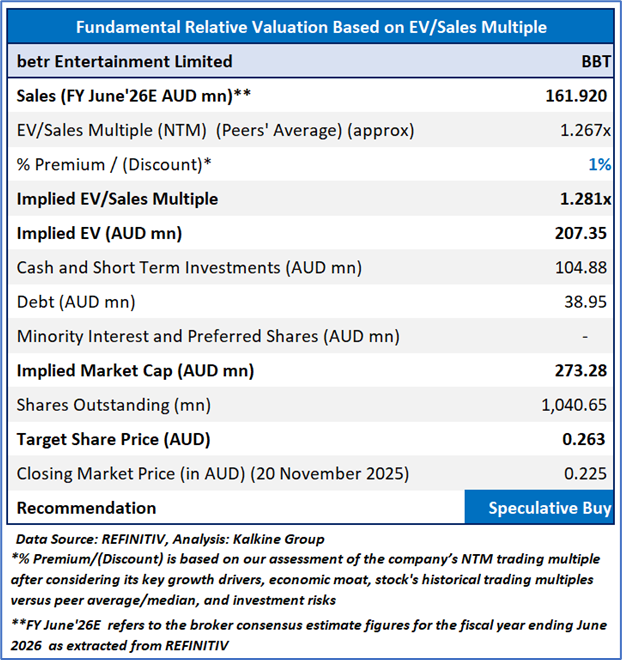
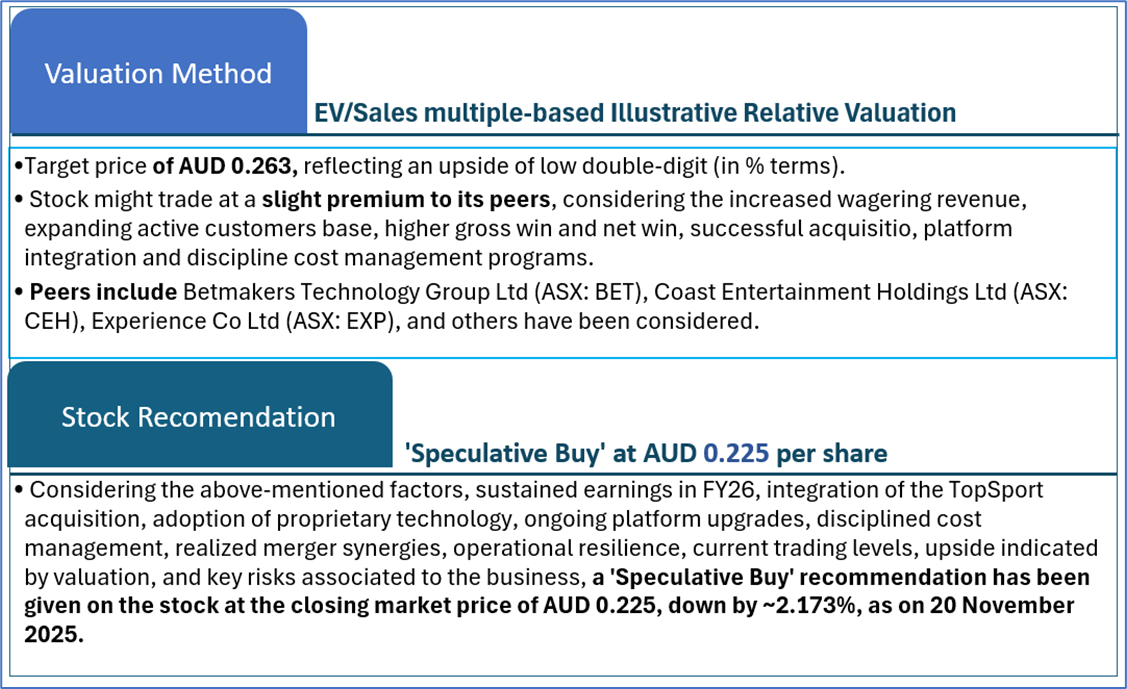
4.2 Fundamental Valuation
Valuation Methodology: EV/Sales Multiple Based Relative Valuation (Illustrative)
Markets are trading in a highly volatile zone currently due to certain macro-economic issues and geopolitical tensions prevailing. Therefore, it is prudent to follow a cautious approach while investing.
Note 1: Past performance is neither an indicator nor a guarantee of future performance.
Note 2: The reference date for all price data, currency, technical indicators, support, and resistance levels is 20 November 2025. The reference data in this report has been partly sourced from REFINITIV.
Note 3: Investment decisions should be made depending on an individual's appetite for upside potential, risks, holding duration, and any previous holdings. An 'Exit' from the stock can be considered if the Target Price mentioned as per the Valuation and or the technical levels provided has been achieved and is subject to the factors discussed above.
Note 4: Kalkine reports are prepared based on the stock prices captured either from REFINITIV or Trading View. Typically, REFINITIV or Trading View may reflect stock prices with a delay which could be a lag of 25-30 minutes. There can be no assurance that future results or events will be consistent with the information provided in the report. The information is subject to change without any prior notice.
Technical Indicators Defined: -
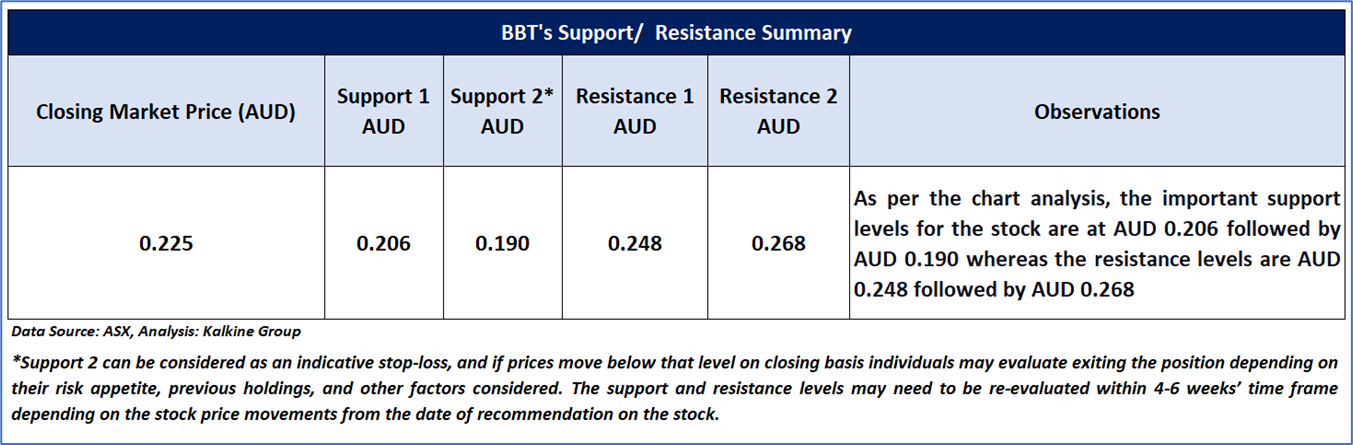
Support: A level at which the stock prices tend to find support if they are falling, and a downtrend may take a pause backed by demand or buying interest. Support 1 refers to the nearby support level for the stock and if the price breaches the level, then Support 2 may act as the crucial support level for the stock.
Resistance: A level at which the stock prices tend to find resistance when they are rising, and an uptrend may take a pause due to profit booking or selling interest. Resistance 1 refers to the nearby resistance level for the stock and if the price surpasses the level, then Resistance 2 may act as the crucial resistance level for the stock.
Stop-loss: It is a level to protect further losses in case of unfavourable movement in the stock prices.
Kalkine Equities LLC, with Delaware File Number 4697384, Foreign Qualification Registration in California File Number 202109211078, and Texas File Number 805521396, is authorized to provide general advice only. The information on https://kalkine.com/ does not take into account any of your investment objectives, financial situation or needs. You should consider the appropriateness of advice taking into account your own objectives, financial situation and needs and seek independent financial advice before making any financial decisions. The link to our Terms and Conditions and Privacy Policy has been provided for your reference. On the date of publishing the reports (mentioned on the website), employees and/or associates of Kalkine do not hold positions in any of the stocks covered on the website. These stocks can change any time and readers of the reports should not consider these stocks as advice or recommendations later.
Past performance is not a reliable indicator of future performance.
 Please wait processing your request...