
Section 1: Company Overview and Fundamentals
1.1 Company Overview:
Blackstone Inc (NYSE: BX) is an alternative asset management firm that oversees a diverse range of investment strategies. Its portfolio includes global investments in areas such as real estate, private equity, infrastructure, life sciences, growth equity, credit, real assets, secondaries, and hedge funds. The company operates through four main business segments: Real Estate, Private Equity, Credit & Insurance, and Multi-Asset Investing.
Kalkine’s Diversified Opportunities Report covers the Company Overview, Key positives & negatives, Investment summary, Key investment metrics, Top 10 shareholding, Business updates and insights into company recent financial results, Key Risks & Outlook, Price performance and technical summary, Target Price, and Recommendation on the stock.
Stock Performance:

1.2 The Key Positives, Negatives, and Investment summary


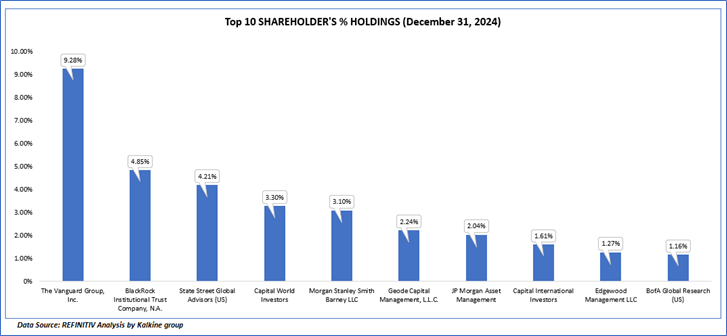
1.3 Top 10 shareholders:
The top 10 shareholders together form ~33.05% of the total shareholding, signifying concentrated shareholding. The Vanguard Group, Inc. and BlackRock Institutional Trust Company, N.A. are the biggest shareholders, holding the maximum stake in the company at 9.28% and 4.85%, respectively.
1.4 Key Metrics:
The chart shows a decline in profitability metrics for Q1 FY25 compared to Q1 FY24 across all key indicators. The EBITDA margin dropped from 56.8% to 47.5%, and the operating margin declined from 51.5% to 42.4%, indicating higher operating costs or weaker revenue leverage. Similarly, the income before tax margin fell from 51.0% to 44.2%, and although the income tax rate slightly increased (from 15.1% to 16.8%), the overall net margin still declined from 43.3% to 36.7%. These trends suggest deterioration in cost efficiency or lower revenue quality, ultimately leading to reduced profitability year-over-year.

Section 2: Business Updates and Corporate Business Highlights
2.1 Recent Updates:
The below picture gives an overview of the recent updates:

2.2 Insights of Q1FY25:

Section 3: Key Risks & Outlook

Section 4: Stock Recommendation Summary:
4.1 Price Performance and Technical Summary:
Stock Performance:
Blackstone (BX) is showing early signs of a bullish reversal after a prolonged downtrend. The stock is trading above both its 21-day and 50-day moving averages, with a recent bullish crossover suggesting upward momentum. RSI is at 58.27, indicating strengthening but not overbought conditions. Increased volume during the recent rally supports the move.


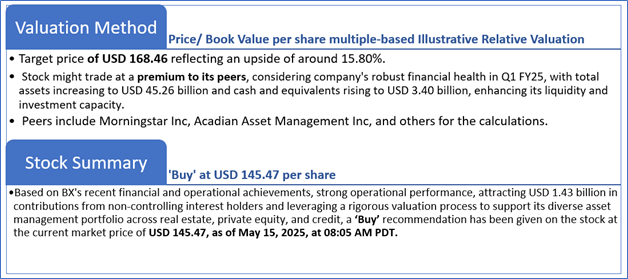
4.2 Fundamental Valuation
Valuation Methodology: Price/Book Value per share Multiple Based Relative Valuation

Markets are trading in a highly volatile zone currently due to certain macroeconomic issues and geopolitical tensions prevailing. Therefore, it is prudent to follow a cautious approach while investing.
Note 1: Past performance is not a reliable indicator of future performance.
Note 2: The reference date for all price data, currency, technical indicators, support, and resistance levels is May 15, 2025. The reference data in this report has been partly sourced from REFINITIV.
Note 3: Investment decisions should be made depending on an individual's appetite for upside potential, risks, holding duration, and any previous holdings. An 'Exit' from the stock can be considered if the Target Price mentioned as per the Valuation and or the technical levels provided has been achieved and is subject to the factors discussed above.
Note 4: The report publishing date is as per the Pacific Time Zone.
Technical Indicators Defined: -
Support: A level at which the stock prices tend to find support if they are falling, and a downtrend may take a pause backed by demand or buying interest. Support 1 refers to the nearby support level for the stock and if the price breaches the level, then Support 2 may act as the crucial support level for the stock.
Resistance: A level at which the stock prices tend to find resistance when they are rising, and an uptrend may take a pause due to profit booking or selling interest. Resistance 1 refers to the nearby resistance level for the stock and if the price surpasses the level, then Resistance 2 may act as the crucial resistance level for the stock.
Stop-loss: It is a level to protect against further losses in case of unfavorable movement in the stock prices.
Kalkine Equities LLC, with Delaware File Number 4697384, Foreign Qualification Registration in California File Number 202109211078, and Texas File Number 805521396, is authorized to provide general advice only. The information on https://kalkine.com/ does not take into account any of your investment objectives, financial situation or needs. You should consider the appropriateness of advice taking into account your own objectives, financial situation and needs and seek independent financial advice before making any financial decisions. The link to our Terms and Conditions and Privacy Policy has been provided for your reference. On the date of publishing the reports (mentioned on the website), employees and/or associates of Kalkine do not hold positions in any of the stocks covered on the website. These stocks can change any time and readers of the reports should not consider these stocks as advice or recommendations later.
Past performance is not a reliable indicator of future performance.
 Please wait processing your request...