
Section 1: Company Overview and Fundamentals
1.1 Company Overview:
Bristol-Myers Squibb Company (NYSE: BMY) is a global biopharmaceutical company. It is engaged in the discovery, development and delivery of transformational medicines for patients facing serious diseases in areas: oncology, hematology, immunology, cardiovascular, neuroscience and other areas. Its platforms comprise chemically synthesized or small molecule drugs, including protein degraders; drugs produced from biological processes, called biologics; ADCs, CAR-T cell therapies, and radiopharmaceutical therapeutics.
Kalkine’s Diversified Opportunities Report covers the Company Overview, Key positives & negatives, Investment summary, Key investment metrics, Top 10 shareholding, Business updates and insights into company recent financial results, Key Risks & Outlook, Price performance and technical summary, Target Price, and Recommendation on the stock.
Stock Performance:

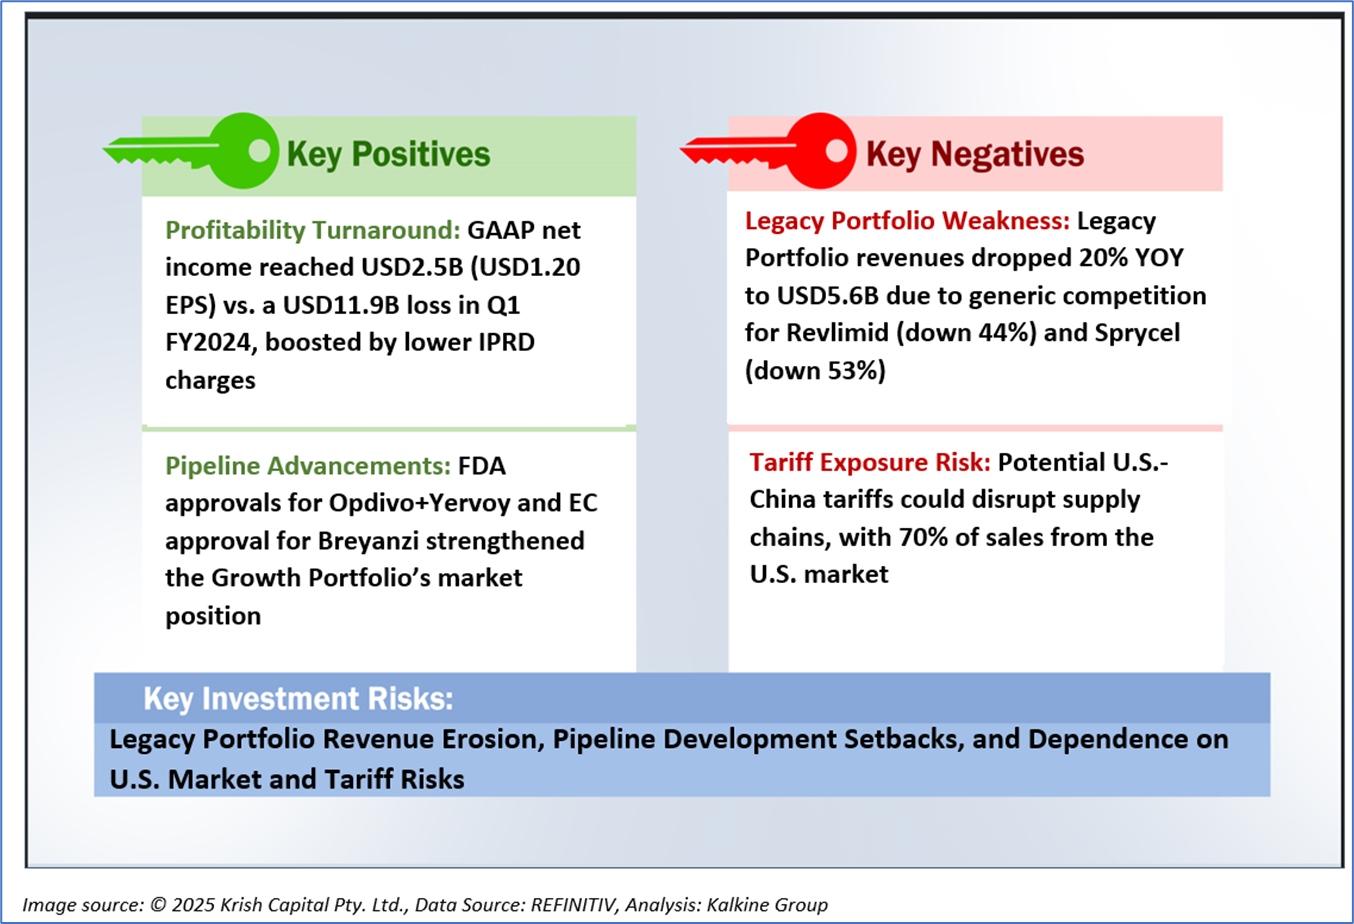
1.2 The Key Positives, Negatives, and Investment summary

1.3 Top 10 shareholders:
The top 10 shareholders together form ~35.06% of the total shareholding, signifying concentrated shareholding. The Vanguard Group, Inc., and BlackRock Institutional Trust Company, N.A., are the biggest shareholders, holding the maximum stake in the company at 9.36% and 4.80%, respectively.

1.4 Key Metrics
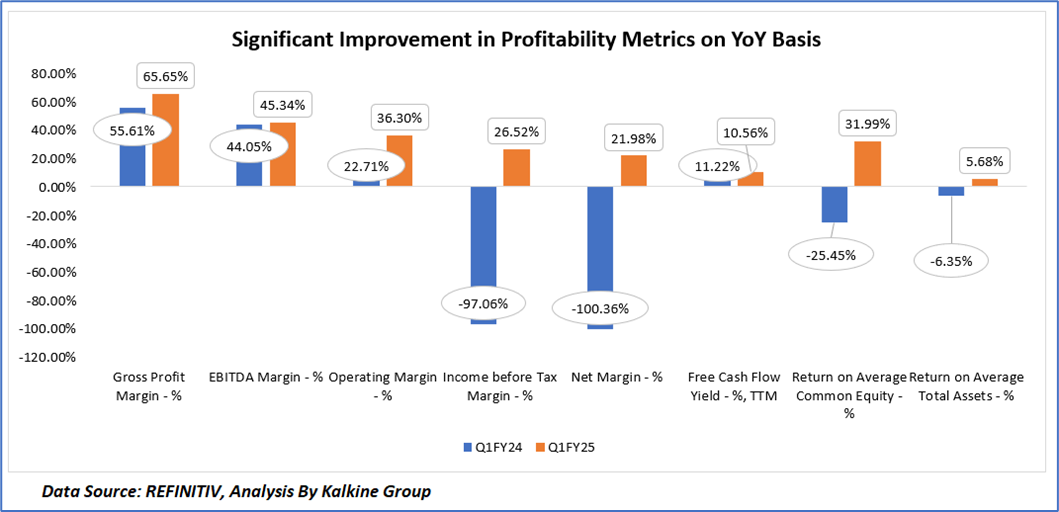
Bristol Myers Squibb (NYSE: BMY) exhibited significant year-over-year improvements in key financial metrics for Q1 FY2025 compared to Q1 FY2024, despite a 6% revenue decline to USD11.2 billion, driven by a 20% drop in Legacy Portfolio revenues due to generic competition. The gross profit margin increased from 55.61% to 65.65%, reflecting improved cost efficiencies in product mix and manufacturing processes. The EBITDA margin slightly improved from 44.05% to 45.34%, and the operating margin surged from 22.71% to 36.30%, driven by a 33% reduction in SG&A expenses to USD1.584 billion and a 16% decrease in R&D expenses to USD2.257 billion, largely due to the absence of 2024’s one-time acquisition costs. The company achieved a remarkable turnaround in profitability, with the income before tax margin shifting from -97.06% to 26.52% and the net margin from -100.36% to 21.98%, supported by lower acquired IPRD charges (USD188 million vs. USD12.9 billion) and a reduced effective tax rate (17.1% vs. negative in 2024). Return on average common equity improved dramatically from -25.45% to 31.99% and return on average total assets rose from -6.35% to 5.68%, indicating stronger capital efficiency and shareholder value creation. However, the trailing twelve-month free cash flow yield slightly declined from 11.22% to 10.56%, potentially due to increased capital expenditures or stock price dynamics, warranting investor attention to cash flow sustainability amidst ongoing investments in the Growth Portfolio.
Section 2: Business Updates and Corporate Business Highlights
2.1 Recent Updates:
The below picture gives an overview of the recent updates:

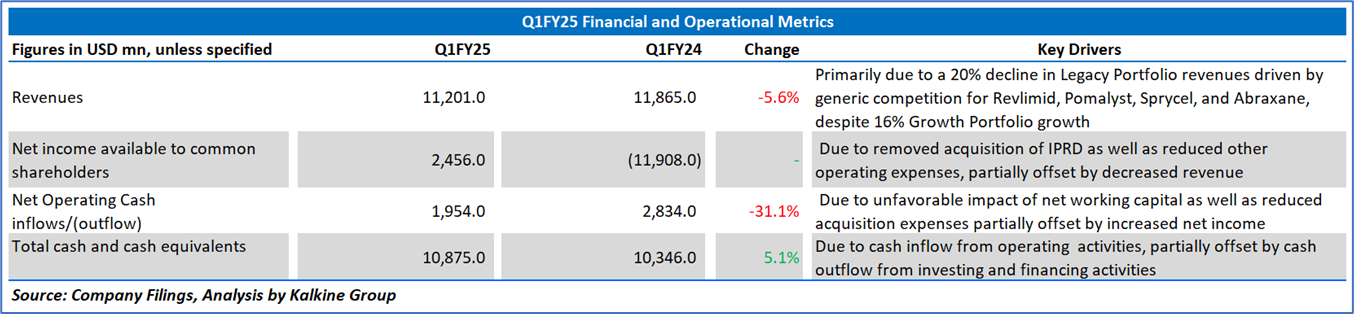
2.2 Insights of Q1FY25:
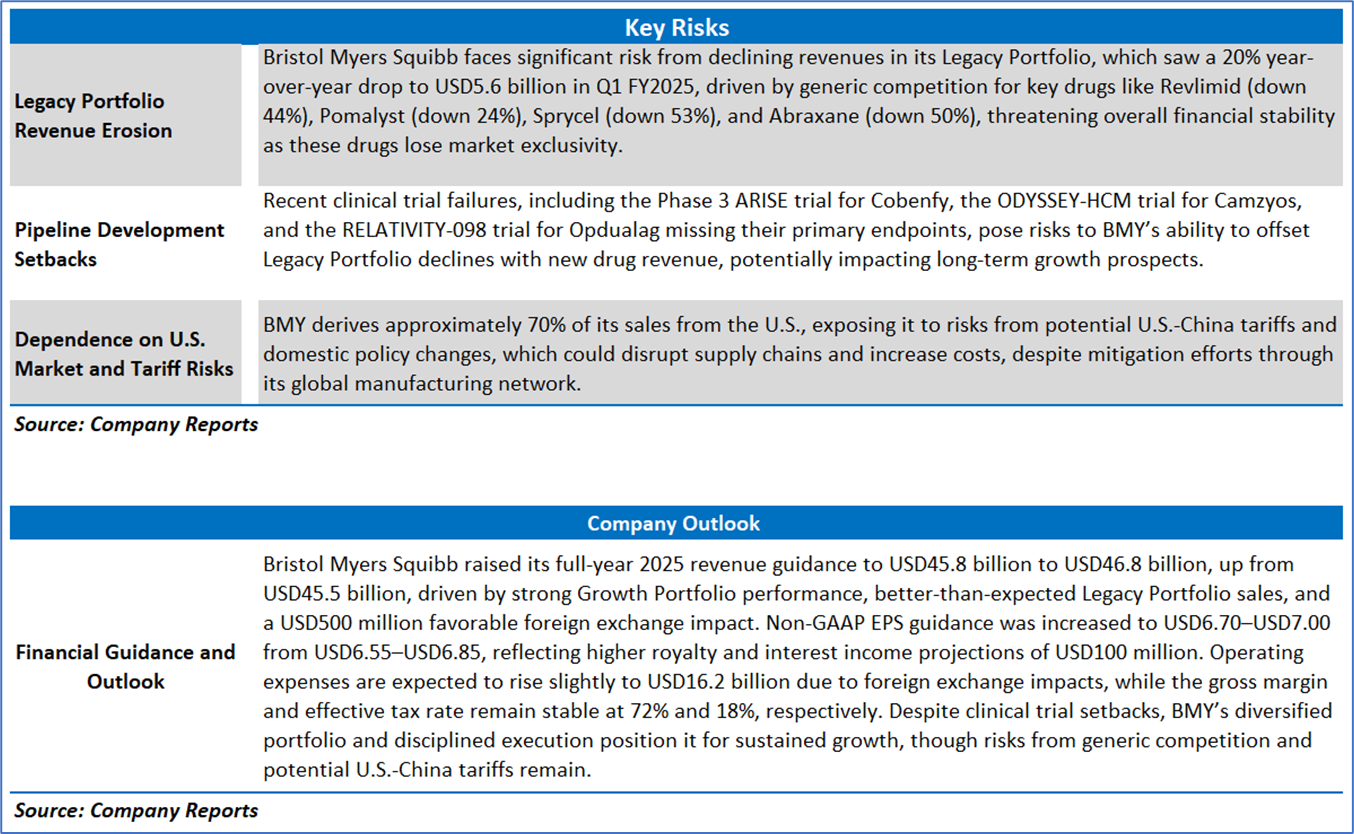
Section 3: Key Risks & Outlook
Section 4: Stock Recommendation Summary:
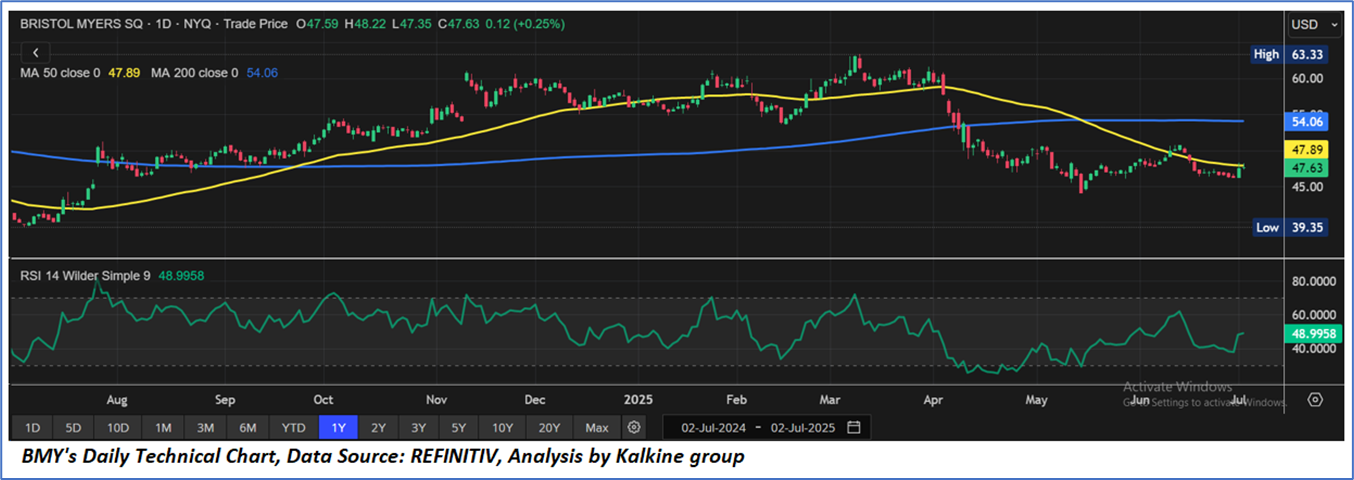
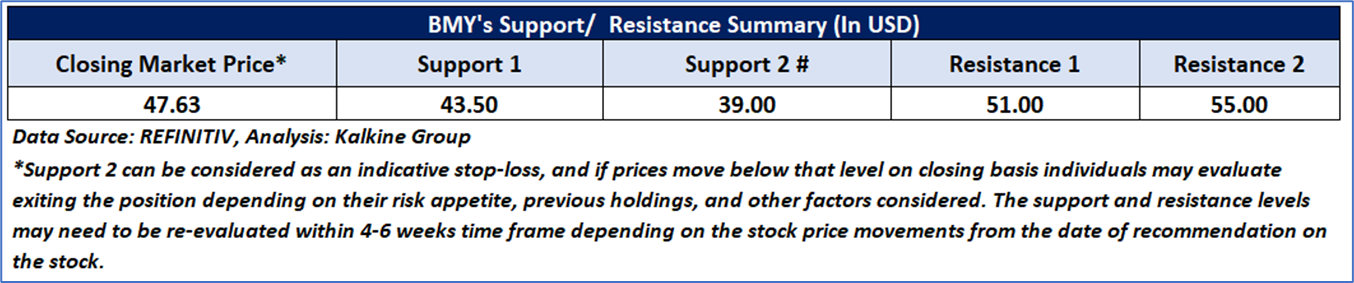
4.1 Price Performance and Technical Summary:
Stock Performance:
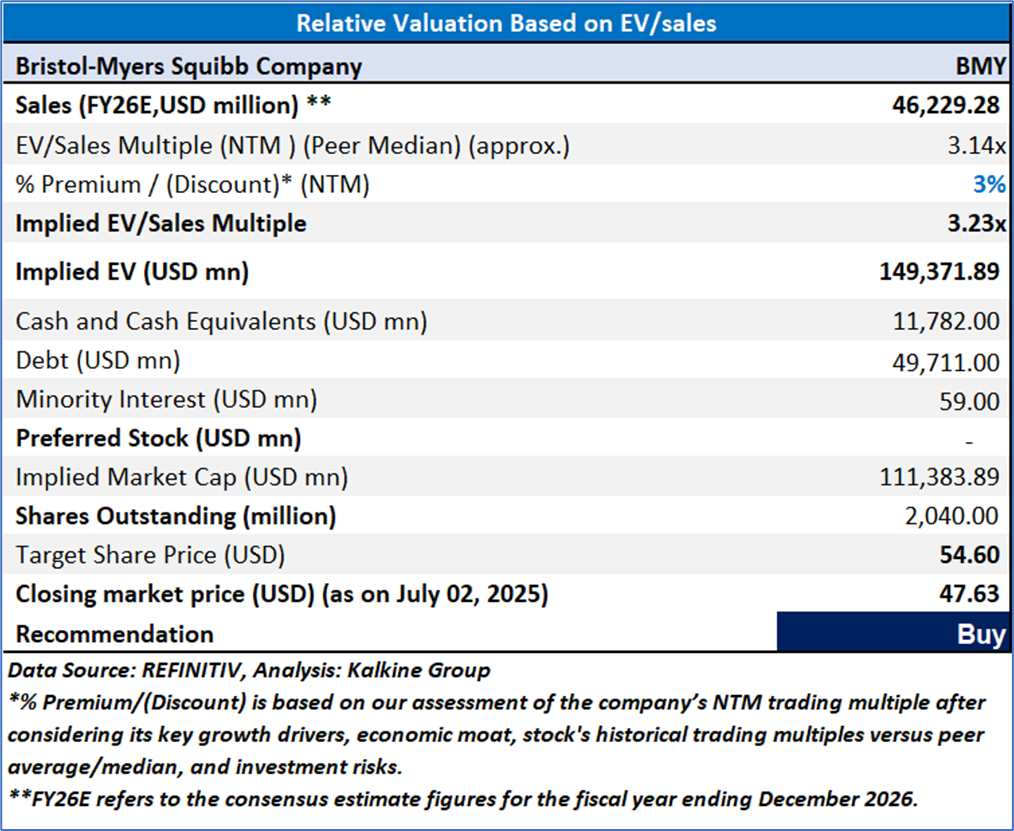
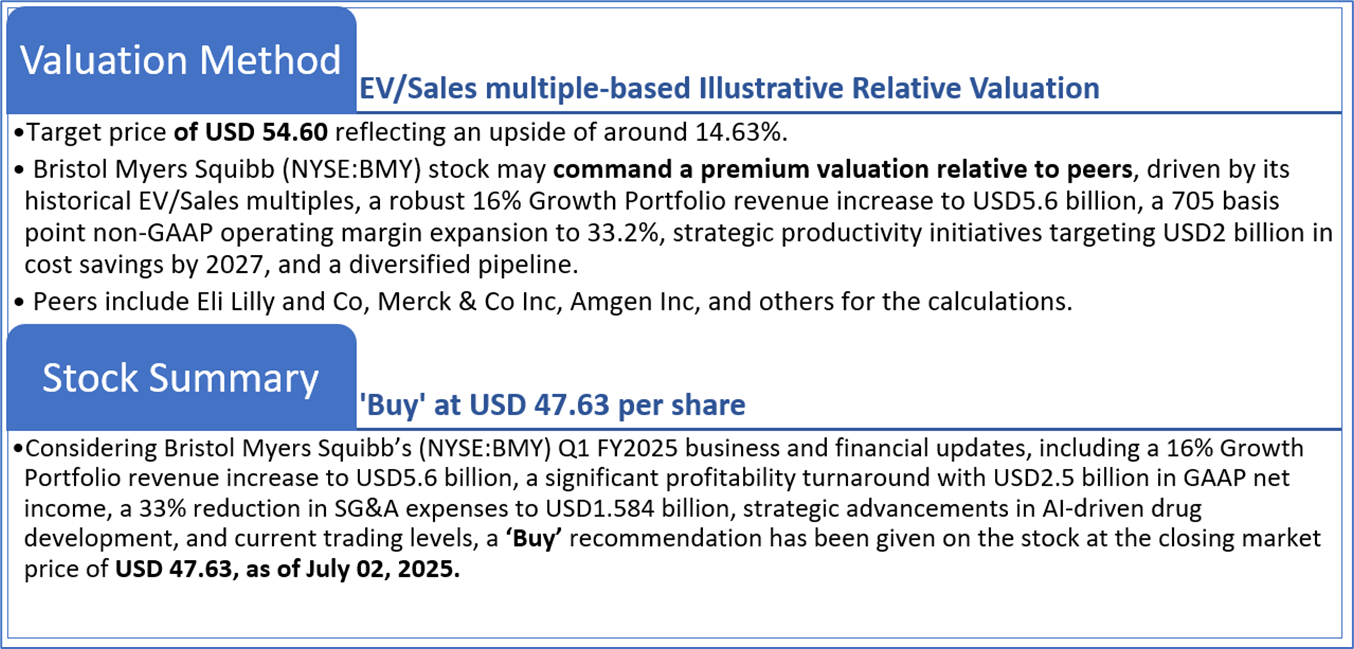
4.2 Fundamental Valuation
Valuation Methodology: EV/Sales Multiple Based Relative Valuation
Markets are trading in a highly volatile zone currently due to certain macroeconomic issues and geopolitical tensions prevailing. Therefore, it is prudent to follow a cautious approach while investing.
Note 1: Past performance is not a reliable indicator of future performance.
Note 2: The reference date for all price data, currency, technical indicators, support, and resistance levels is July 02, 2025. The reference data in this report has been partly sourced from REFINITIV.
Note 3: Investment decisions should be made depending on an individual's appetite for upside potential, risks, holding duration, and any previous holdings. An 'Exit' from the stock can be considered if the Target Price mentioned as per the Valuation and or the technical levels provided has been achieved and is subject to the factors discussed above.
Note 4: The report publishing date is as per the Pacific Time Zone.
Technical Indicators Defined: -
Support: A level at which the stock prices tend to find support if they are falling, and a downtrend may take a pause backed by demand or buying interest. Support 1 refers to the nearby support level for the stock and if the price breaches the level, then Support 2 may act as the crucial support level for the stock.
Resistance: A level at which the stock prices tend to find resistance when they are rising, and an uptrend may take a pause due to profit booking or selling interest. Resistance 1 refers to the nearby resistance level for the stock and if the price surpasses the level, then Resistance 2 may act as the crucial resistance level for the stock.
Stop-loss: It is a level to protect against further losses in case of unfavorable movement in the stock prices.
Kalkine Equities LLC, with Delaware File Number 4697384, Foreign Qualification Registration in California File Number 202109211078, and Texas File Number 805521396, is authorized to provide general advice only. The information on https://kalkine.com/ does not take into account any of your investment objectives, financial situation or needs. You should consider the appropriateness of advice taking into account your own objectives, financial situation and needs and seek independent financial advice before making any financial decisions. The link to our Terms and Conditions and Privacy Policy has been provided for your reference. On the date of publishing the reports (mentioned on the website), employees and/or associates of Kalkine do not hold positions in any of the stocks covered on the website. These stocks can change any time and readers of the reports should not consider these stocks as advice or recommendations later.
Past performance is not a reliable indicator of future performance.
 Please wait processing your request...