
Section1: Company Overview and Fundamental Insights:

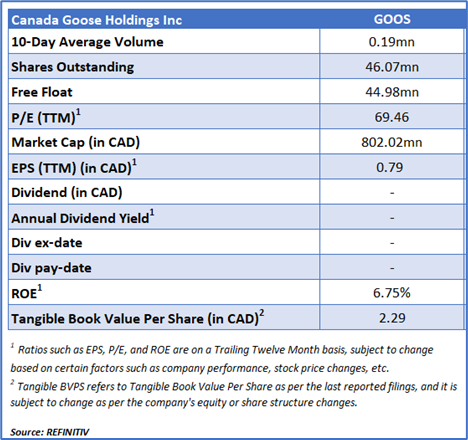
Canada Goose Holdings Incorporation (TSX: GOOS) is a Canada based company that designs, manufactures, distributes, and retails premium outerwear for men, women, and children. It operates business through three segments namely, Wholesale and Direct to Consumer (DTC), and Other. The DTC segment, which is the key revenue driver, comprises sales through country-specific e-commerce platforms and its company-owned retail stores located in luxury shopping locations. The Wholesale segment comprises sales made to a mix of functional and fashionable retailers, including major luxury department stores, outdoor specialty stores, and individual shops, and to international distributors. Geographically, it has a presence in Canada, the United States, Asia, Europe, and the Rest of the World.
Kalkine’s Low Carbon Report covers the Key Investment Highlights, Key Financial Metrics, Risks, Technical Analysis along with the Valuation, Target Price, and Recommendation on the stock.

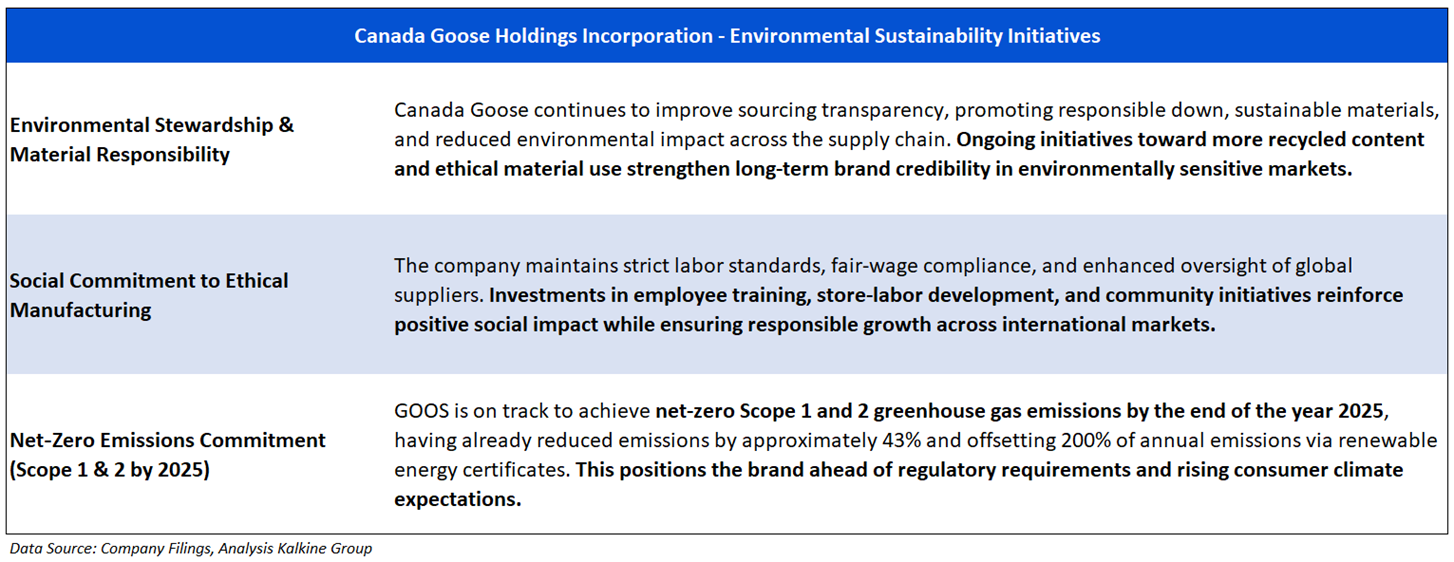
The shift toward a low-carbon economy is one of the most significant challenges of current time, spurred by the urgent need to combat climate change and reduce the environmental impact of corporate activities. This report covers the TSX-listed low-carbon emission company (TSX: GOOS), that is committed to sustainability and responsible environmental practices.
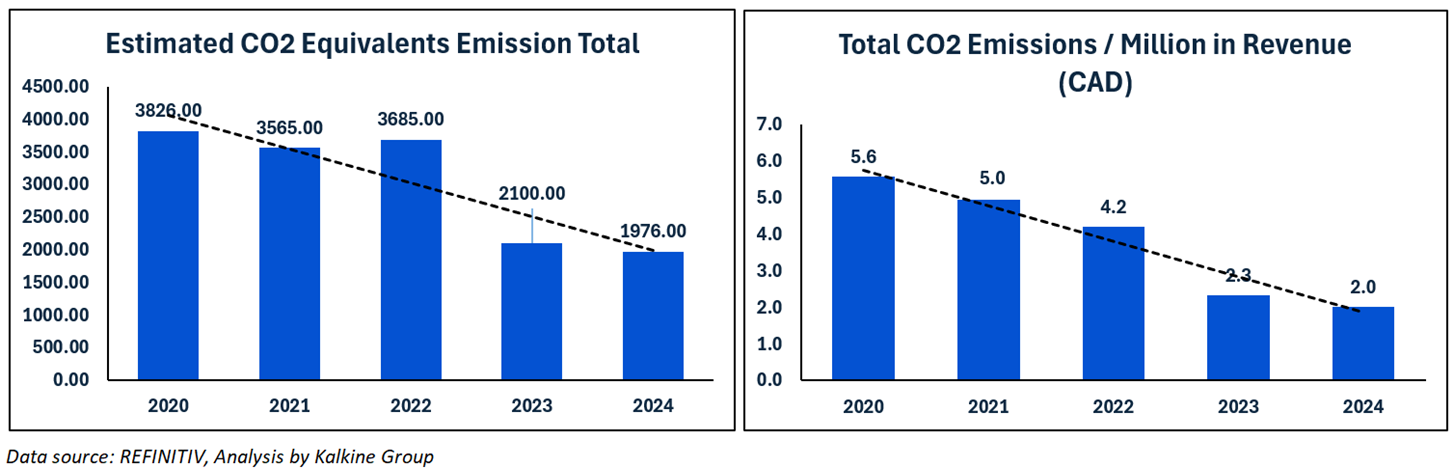
Carbon and Waste Management - Key Metrics
Canada Goose Holdings Incorporation (TSX: GOOS), has sustained its environmental efforts by significantly decreasing Total CO2 Emissions / Million in revenue while progressively reducing CO₂ equivalent emissions between 2020 and 2024.
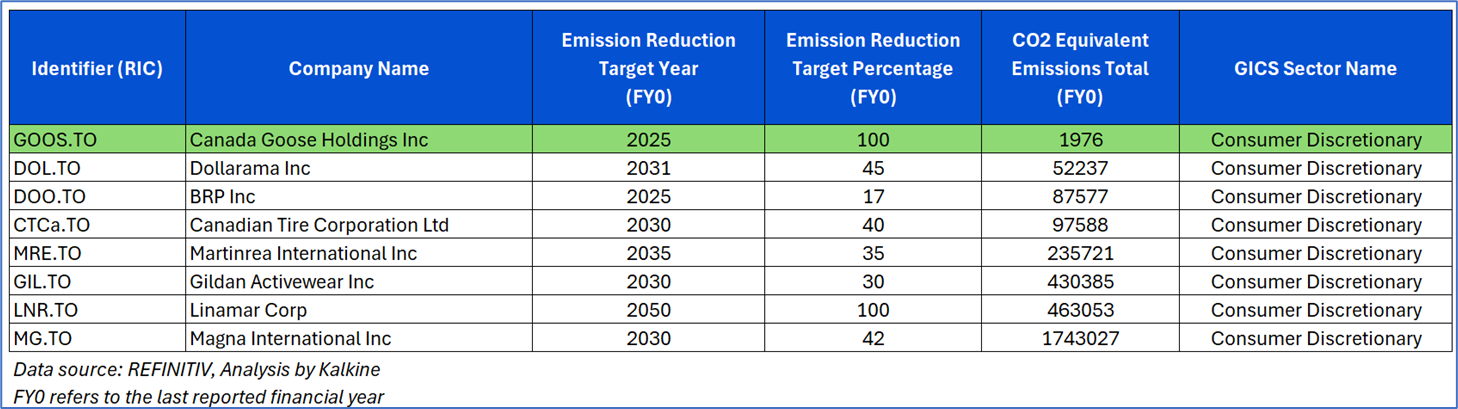
Peer Comparison: Carbon Emission Metrics


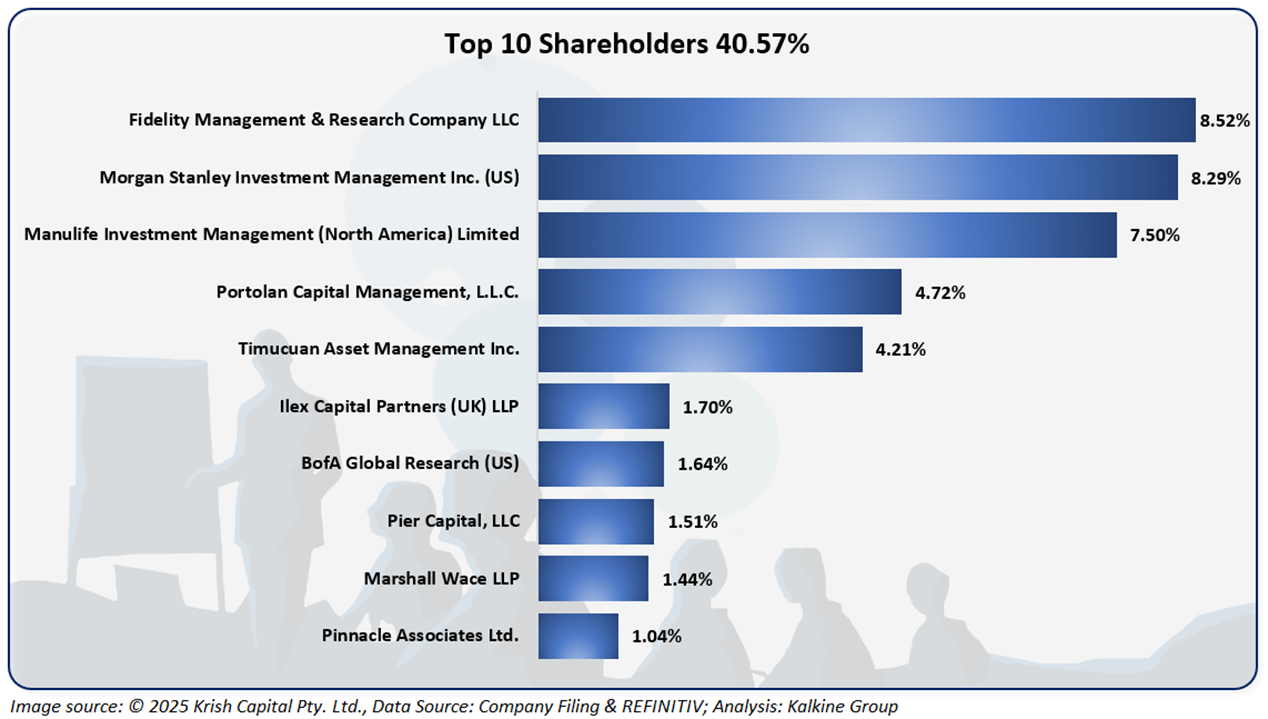
The top 10 shareholders together form ~40.57% of the total shareholding. Fidelity Management & Research Company LLC and Morgan Stanley Investment Management Inc. (US) hold a maximum stake in the company at ~8.52% and ~8.29%, respectively.

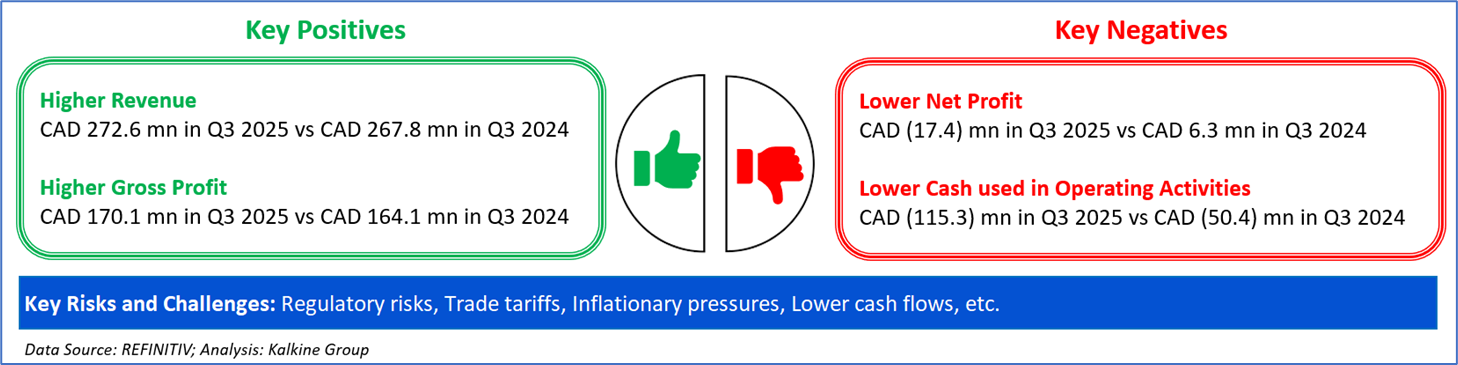
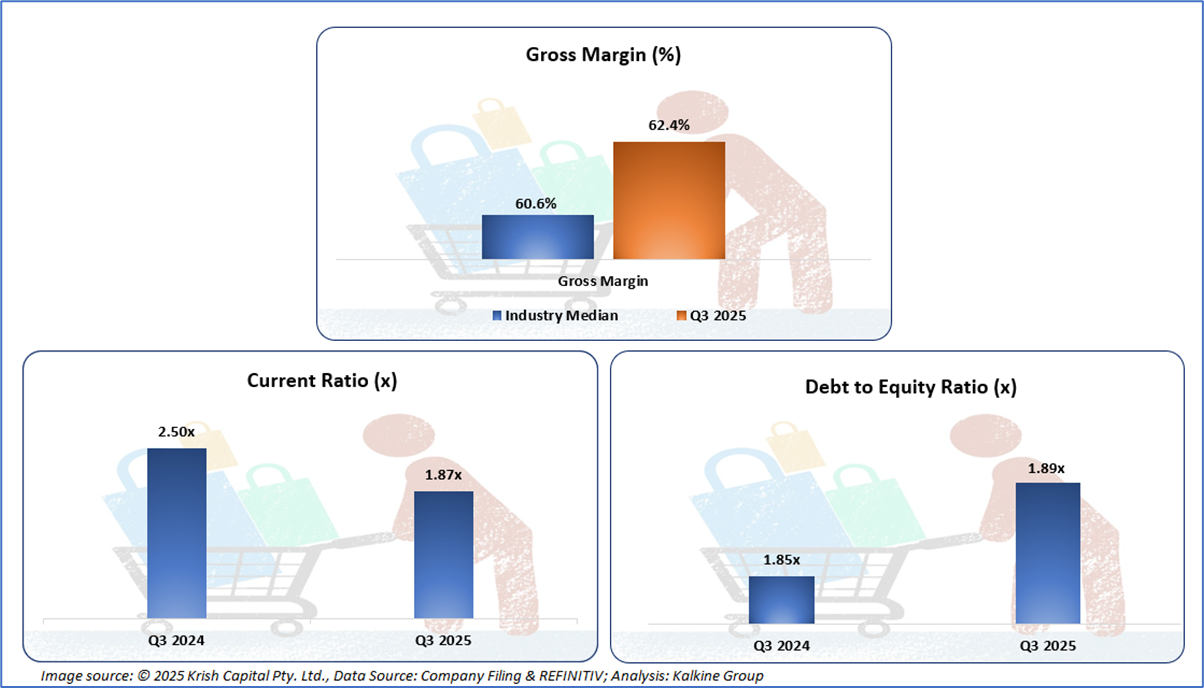
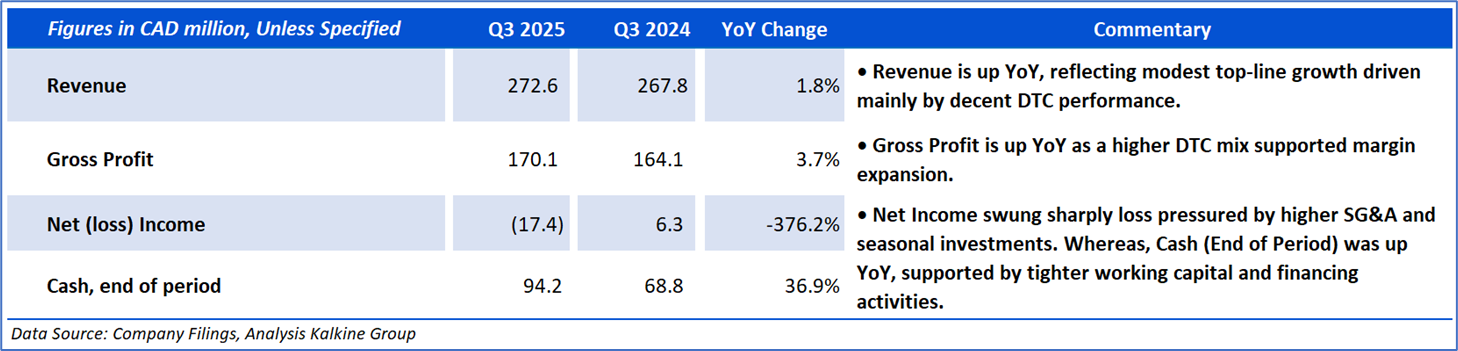
The company reported rising financials in Q3 2025, where it clocked healthy growth under its Gross Margin, which is a key positive. Furthermore, it witnessed elevated Current ratio and decreasing debt to equity ratio, displaying its operational strength and debt reduction initiative.
Section 2: Business Updates and Financial Highlights

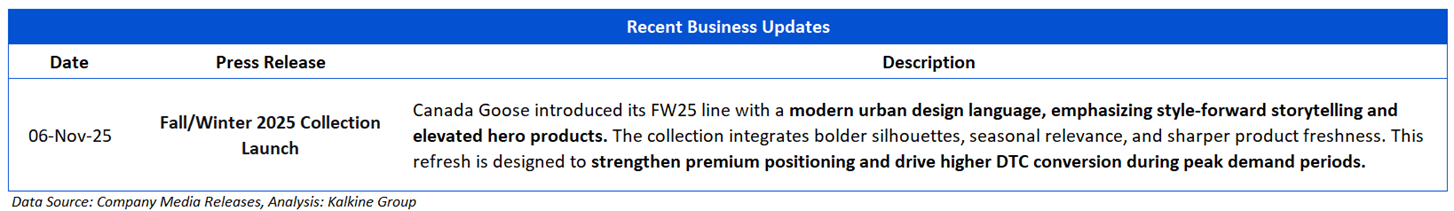
The picture below gives an overview of the company’s recent activities, such as an announcement regarding Fall/Winter 2025 Collection Launch.

Section 3: Key Risks and Company Outlook

Section 4: Stock Recommendation Summary:


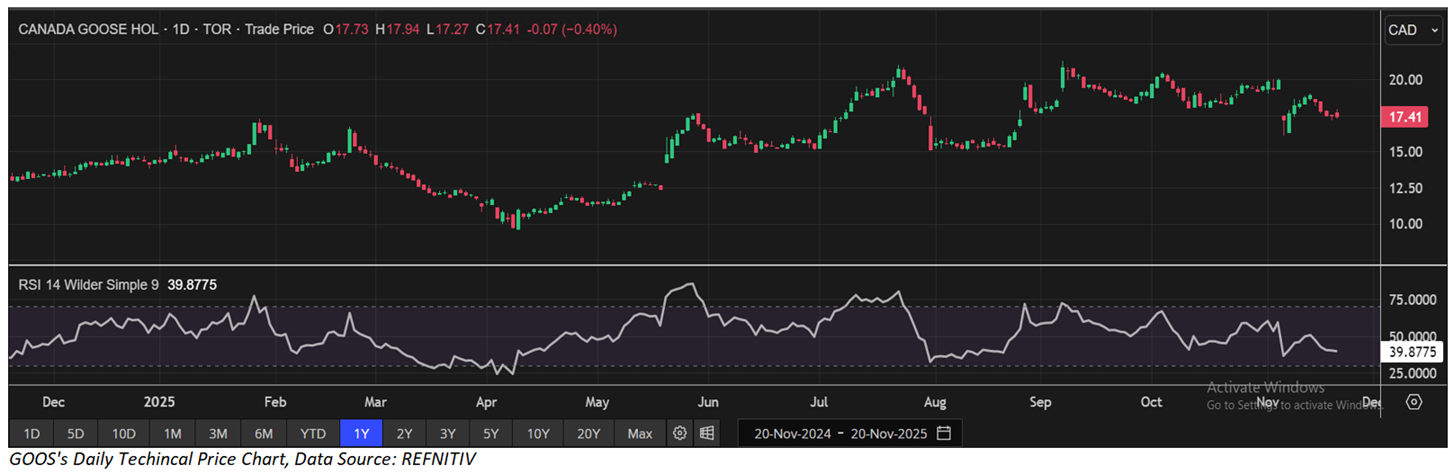
The stock has witnessed a downside of ~7.83% and an upside of ~9.91% over the last 1 week and 6 months respectively. Moreover, it is trading above the average 52-week high price of CAD 21.28 and 52-week low price of CAD 9.54, providing an opportunity to ride the trend.

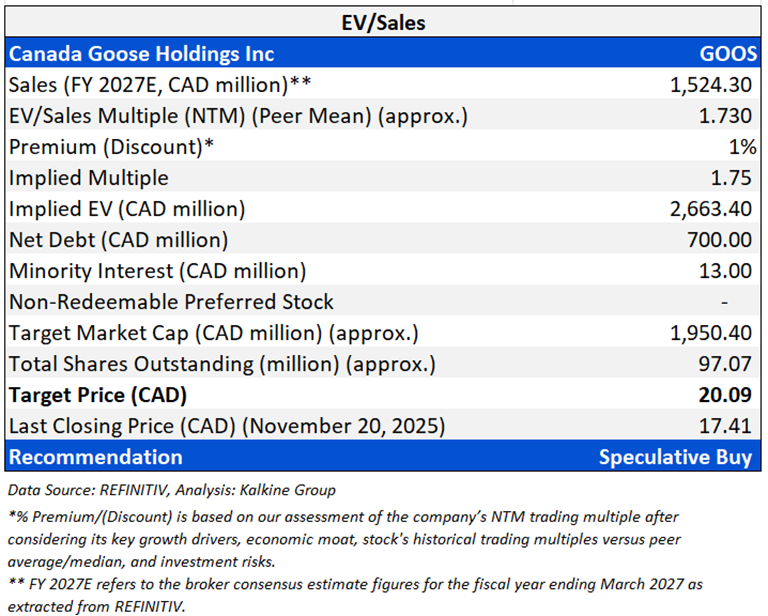
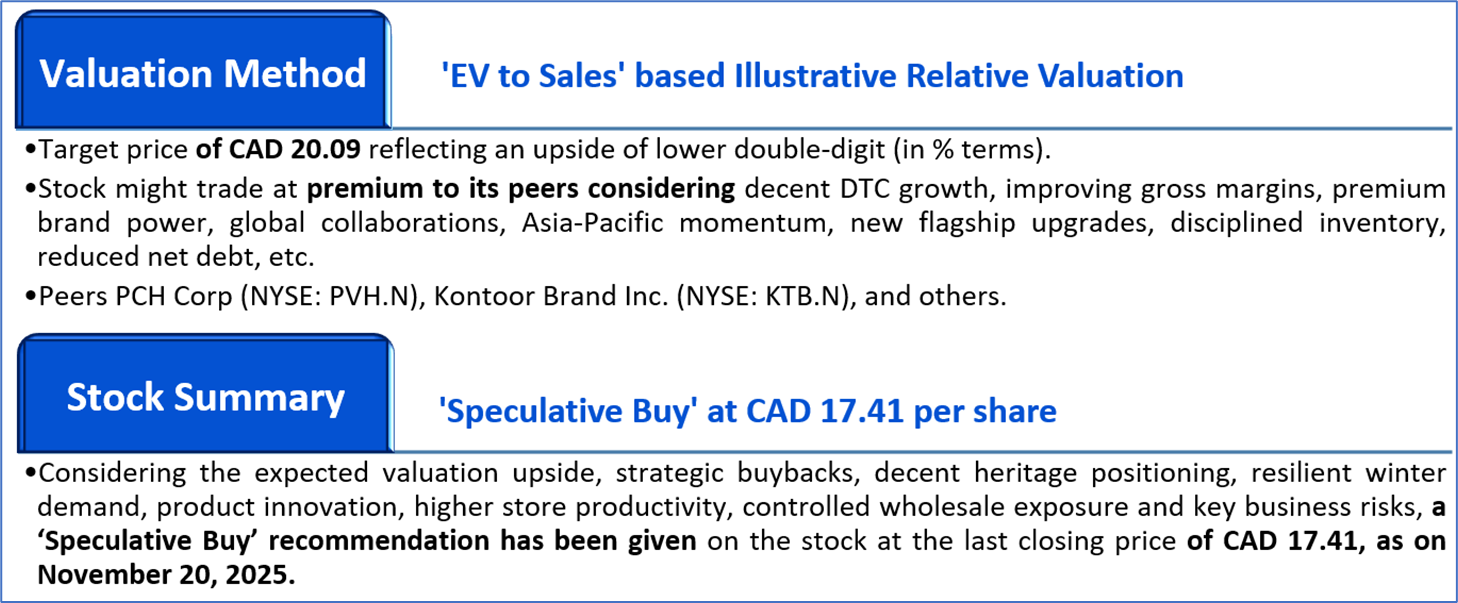
Valuation Methodology: EV to Sales Multiple Based Relative Valuation (Illustrative):
Markets are trading in a highly volatile zone currently due to certain macroeconomic issues and geopolitical tensions prevailing. Therefore, it is prudent to follow a cautious approach while investing.
Note 1: Past performance is not a reliable indicator of future performance.
Note 2: The reference date for all price data, currency, technical indicators, support, and resistance levels is November 20, 2025. The reference data in this report has been partly sourced from REFINITIV.
Note 3: Investment decisions should be made depending on an individual's appetite for upside potential, risks, holding duration, and any previous holdings. An 'Exit' from the stock can be considered if the Target Price mentioned as per the Valuation and or the technical levels provided has been achieved and is subject to the factors discussed above.
Note 4: Dividend Yield may vary as per the stock price movement.
Note 5: Kalkine reports are prepared based on the stock prices captured either from REFINITIV or Trading View. Typically, REFINITIV or Trading View may reflect stock prices with a delay which could be a lag of 25-30 minutes. There can be no assurance that future results or events will be consistent with the information provided in the report. The information is subject to change without any prior notice.
Technical Indicators Defined: -
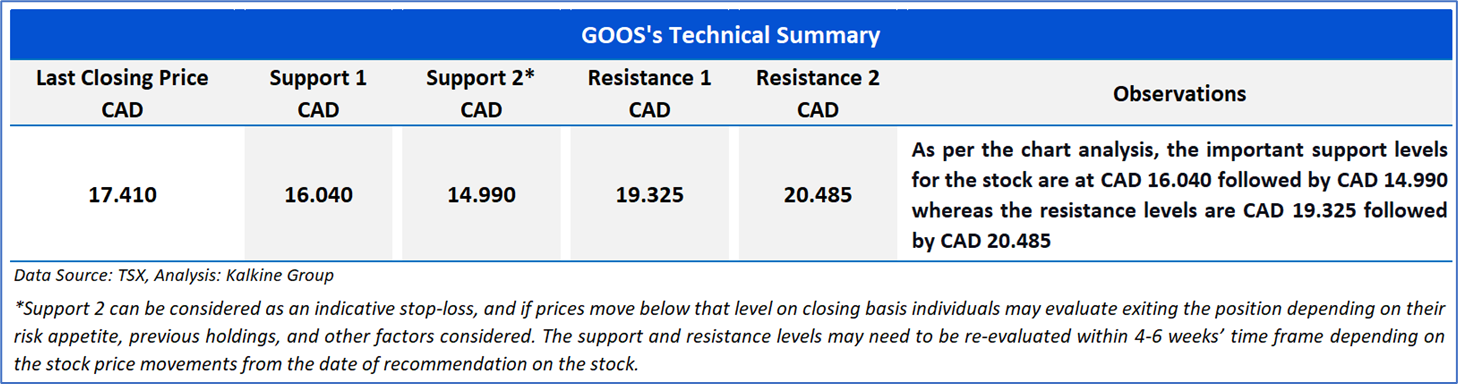
Support: A level at which the stock prices tend to find support if they are falling, and a downtrend may take a pause backed by demand or buying interest. Support 1 refers to the nearby support level for the stock and if the price breaches the level, then Support 2 may act as the crucial support level for the stock.
Resistance: A level at which the stock prices tend to find resistance when they are rising, and an uptrend may take a pause due to profit booking or selling interest. Resistance 1 refers to the nearby resistance level for the stock and if the price surpasses the level, then Resistance 2 may act as the crucial resistance level for the stock.
Stop-loss: It is a level to protect further losses in case of unfavourable movement in the stock prices.
Kalkine Equities LLC, with Delaware File Number 4697384, Foreign Qualification Registration in California File Number 202109211078, and Texas File Number 805521396, is authorized to provide general advice only. The information on https://kalkine.com/ does not take into account any of your investment objectives, financial situation or needs. You should consider the appropriateness of advice taking into account your own objectives, financial situation and needs and seek independent financial advice before making any financial decisions. The link to our Terms and Conditions and Privacy Policy has been provided for your reference. On the date of publishing the reports (mentioned on the website), employees and/or associates of Kalkine do not hold positions in any of the stocks covered on the website. These stocks can change any time and readers of the reports should not consider these stocks as advice or recommendations later.
Past performance is not a reliable indicator of future performance.
 Please wait processing your request...