
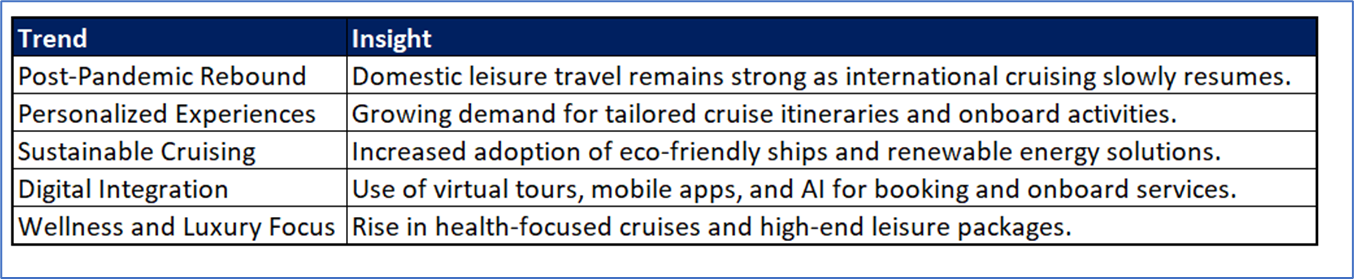
Kalkine’s Global Travel & Leisure Report offers a comprehensive view of the key companies and evolving trends across the travel value chain covering countries including US, Canada, Australia, UK, and New Zealand. This includes airlines, hospitality chains, digital travel platforms, as well as the rapidly growing leisure, entertainment, and gaming segments that are redefining the way people engage with travel experiences.

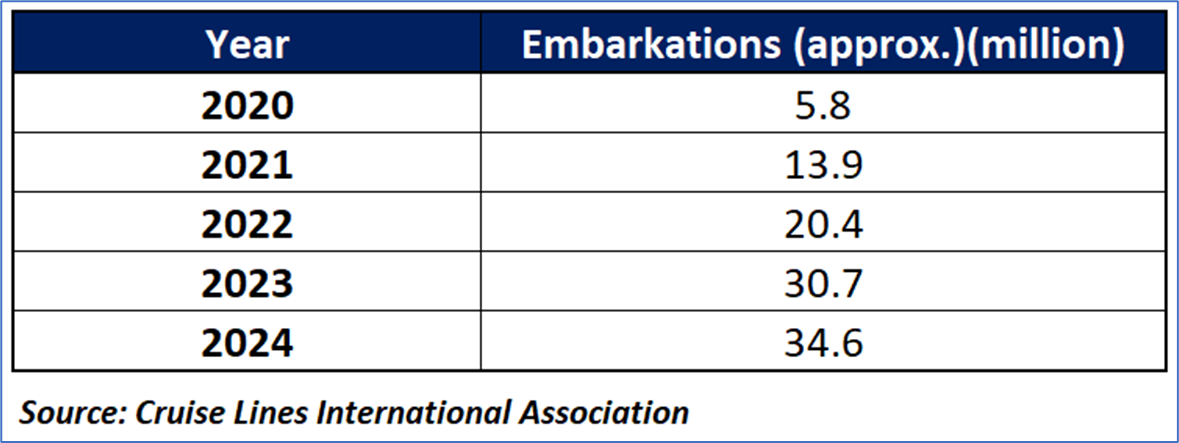
Global Cruise Tourism Market: A Dynamic Growth Trajectory:


Between 2020 and 2024, the global cruise industry demonstrated a remarkable trajectory of recovery and growth:
Kalkine’s Global Travel & Leisure Report covers the Investment Highlights, Key Financial Metrics, Risks, Technical Analysis along with the Valuation, Target Price, and Recommendation on Carnival Corporation (NYSE: CCL).
Section 1: Company Overview and Fundamentals Insights
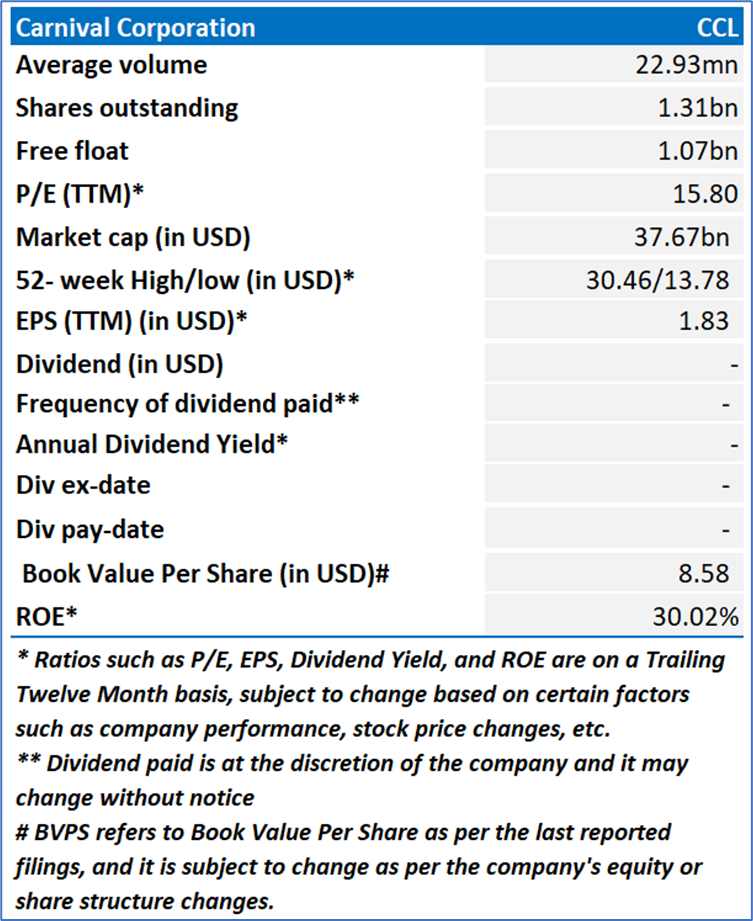
Company Overview: Carnival Corporation (NYSE: CCL) is a global cruise and leisure travel company. The Company has a portfolio of cruise lines, including AIDA Cruises, Carnival Cruise Line, Costa Cruises, Cunard, Holland America Line, P&O Cruises (Australia), P&O Cruises (UK), Princess Cruises, and Seabourn. The Company's segment includes NAA cruise operations, Europe cruise operations (Europe), Cruise Support and Tour and Other.
Kalkine’s Global Travel and Leisure Report covers the Investment Highlights, Key Financial Metrics, Risks, and Technical Analysis along with the Valuation, Target Price, and Recommendation on the stock.
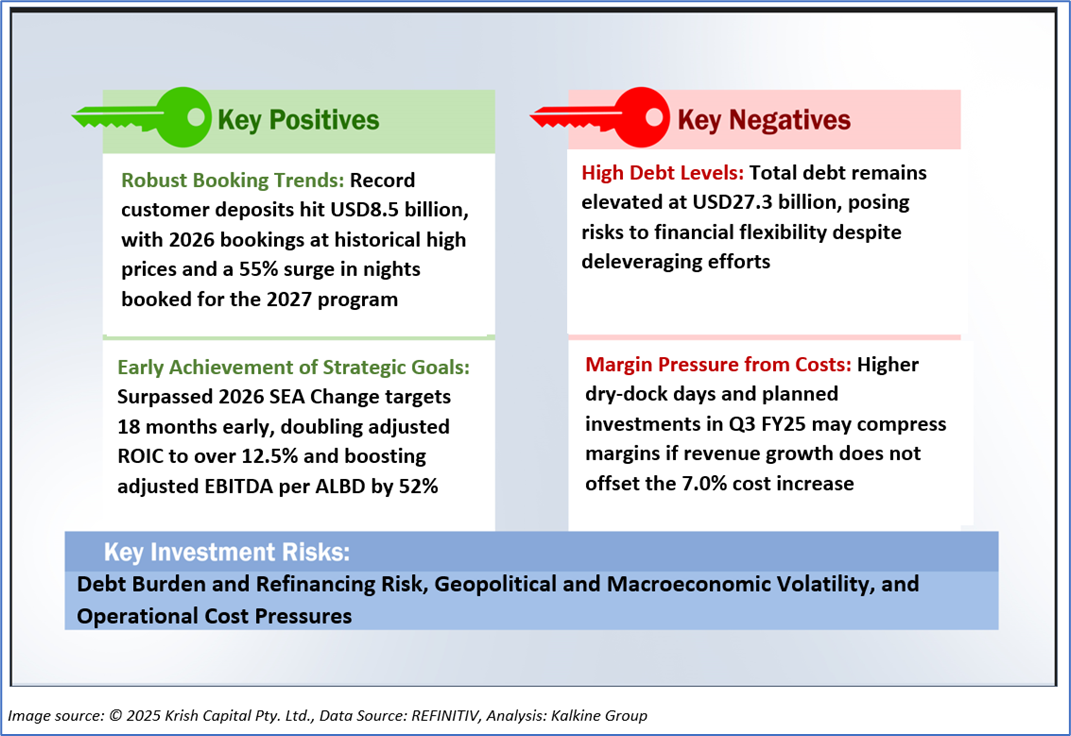
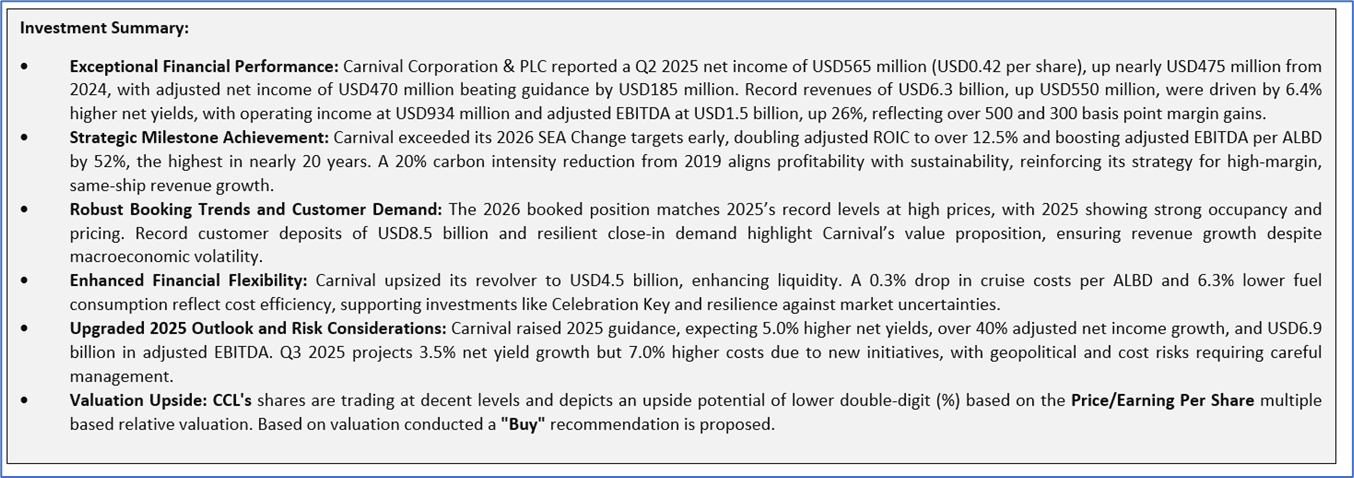
1.2 The Key Positives, Negatives, Investment Highlights, and Risks
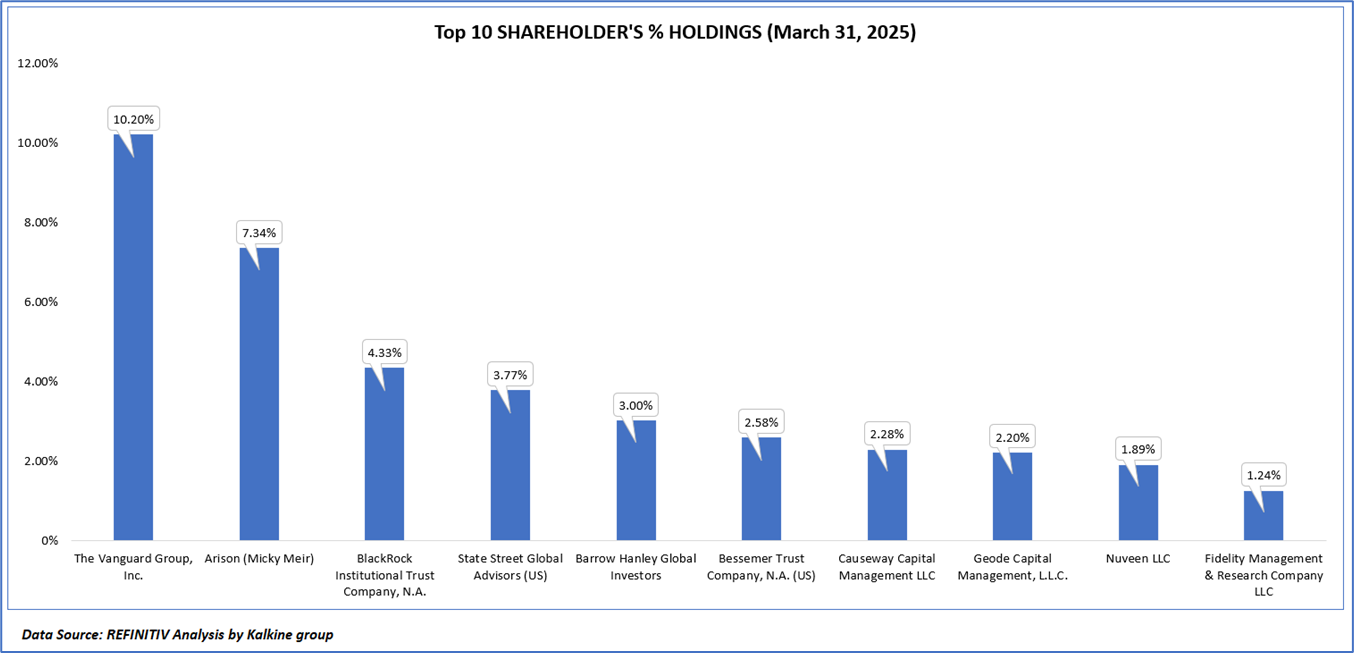
1.3 Top 10 Shareholders:
The top 10 shareholders together form ~38.83% of the total shareholding. The Vanguard Group, Inc., Arison (Micky Meir) hold maximum stakes of 10.20% and 7.34%, respectively.
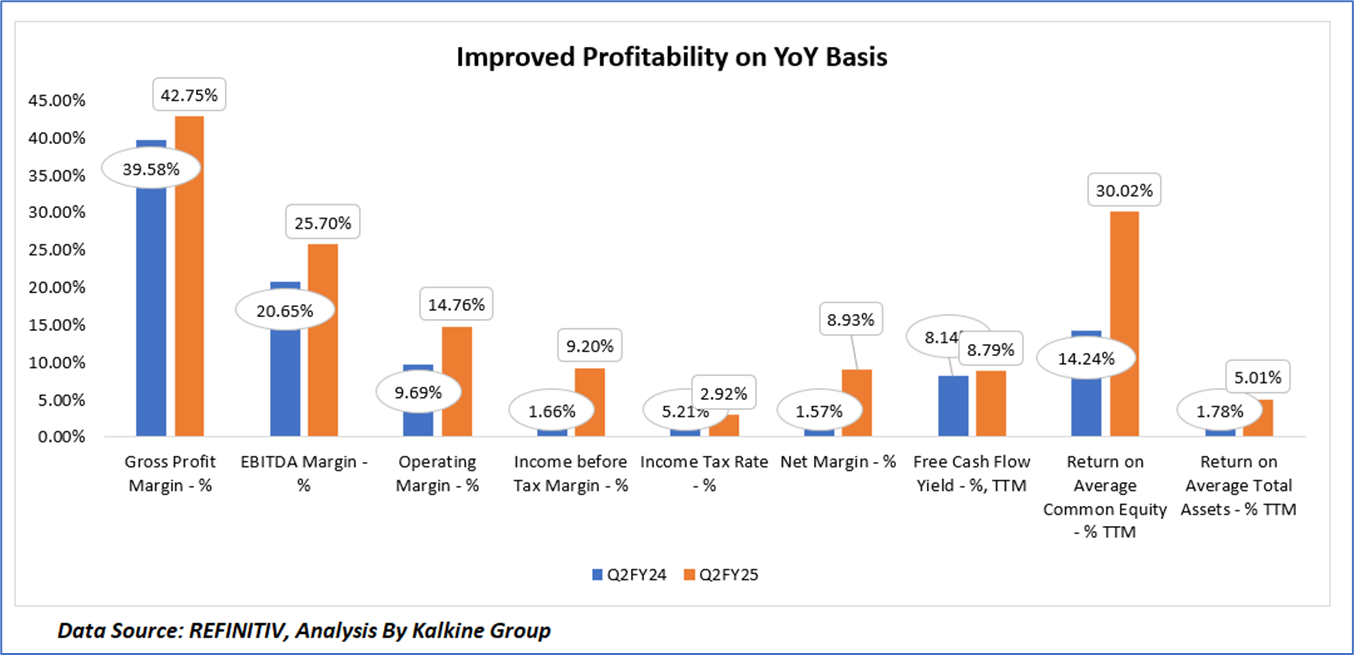
1.4 Key Metrics:
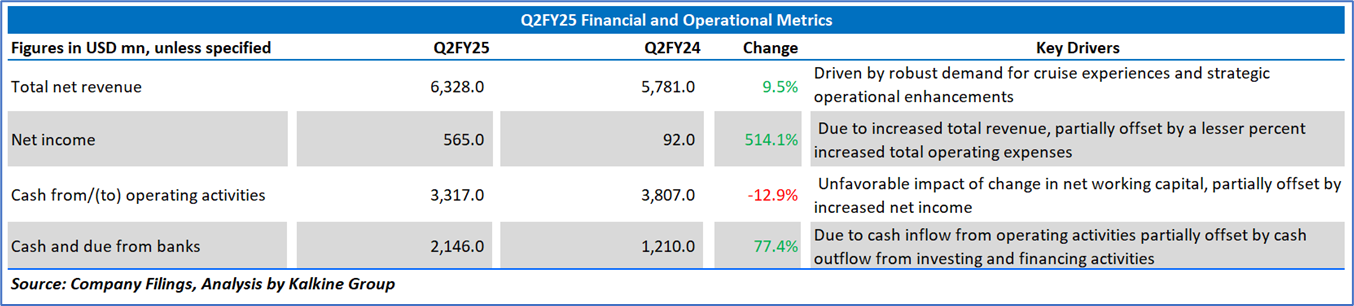
Carnival Corporation & PLC exhibited significant financial improvement in Q2 FY25 compared to Q2 FY24, reflecting enhanced operational efficiency and profitability. The gross profit margin increased from 39.58% to 42.75%, driven by record net yields (up 6.4% YoY) and strong onboard spending, contributing to revenues of USD6.3 billion. The EBITDA margin rose from 20.65% to 25.70%, and the operating margin improved from 9.69% to 14.76%, supported by a record operating income of USD934 million and a 0.3% reduction in cruise costs per ALBD. The income before tax margin surged from 1.66% to 9.20%, bolstered by a lower income tax rate of 2.92% (down from 5.21%), resulting in a net margin increase from 1.57% to 8.93%, with net income reaching USD565 million. The trailing twelve-month (TTM) free cash flow yield improved slightly from 8.14% to 8.79%, while the return on average common equity (TTM) more than doubled from 14.24% to 30.02%, and the return on average total assets (TTM) rose from 1.78% to 5.01%, underscoring Carnival’s strengthened capital efficiency and asset utilization, positioning the company favorably for sustained growth despite ongoing debt and cost pressures.
Section 2: Business Updates, Financial and Operational Highlights
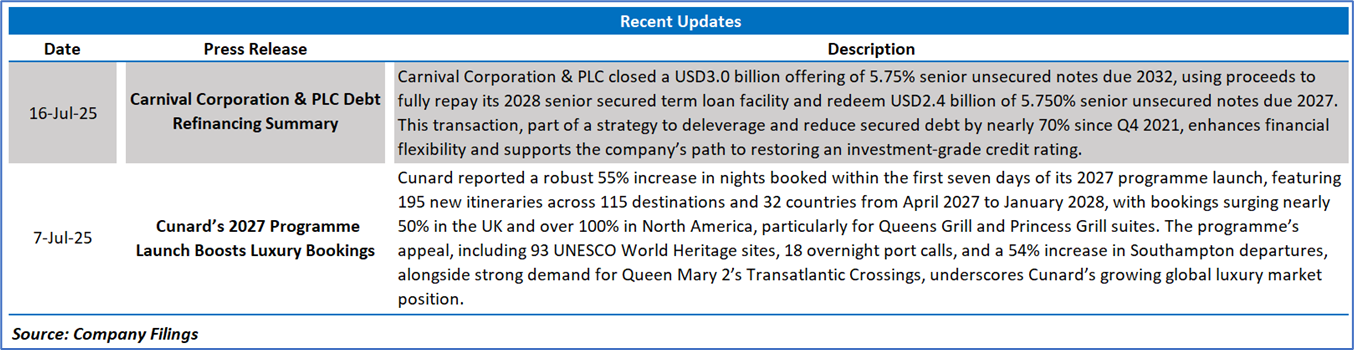
2.1 Recent Business Updates:
2.2 Q2FY25 Results Highlights (for the 03 months ended 31 May 2025): Below are some key financial highlights:
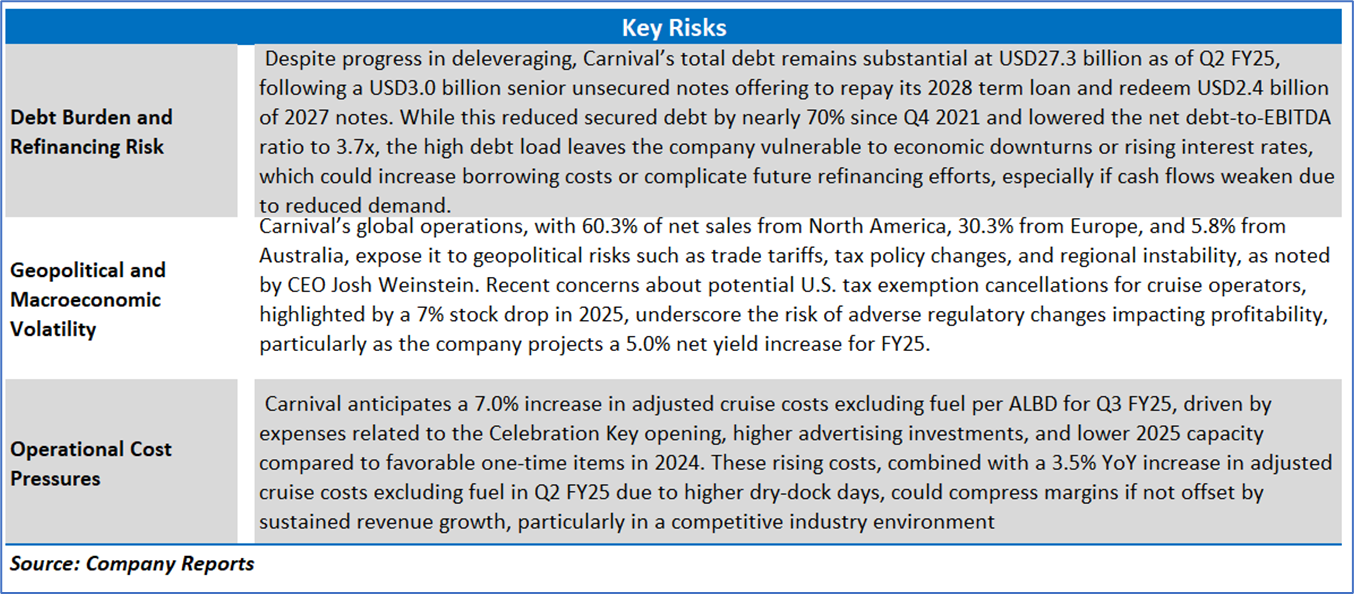
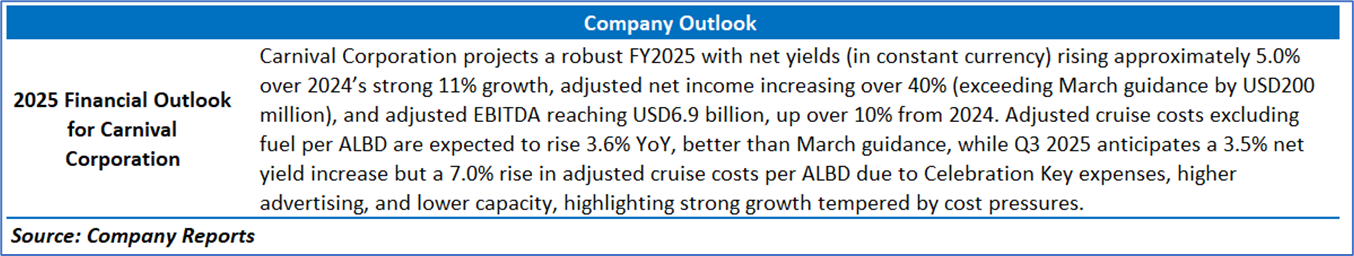
Section 3: Key Risks and Outlook:
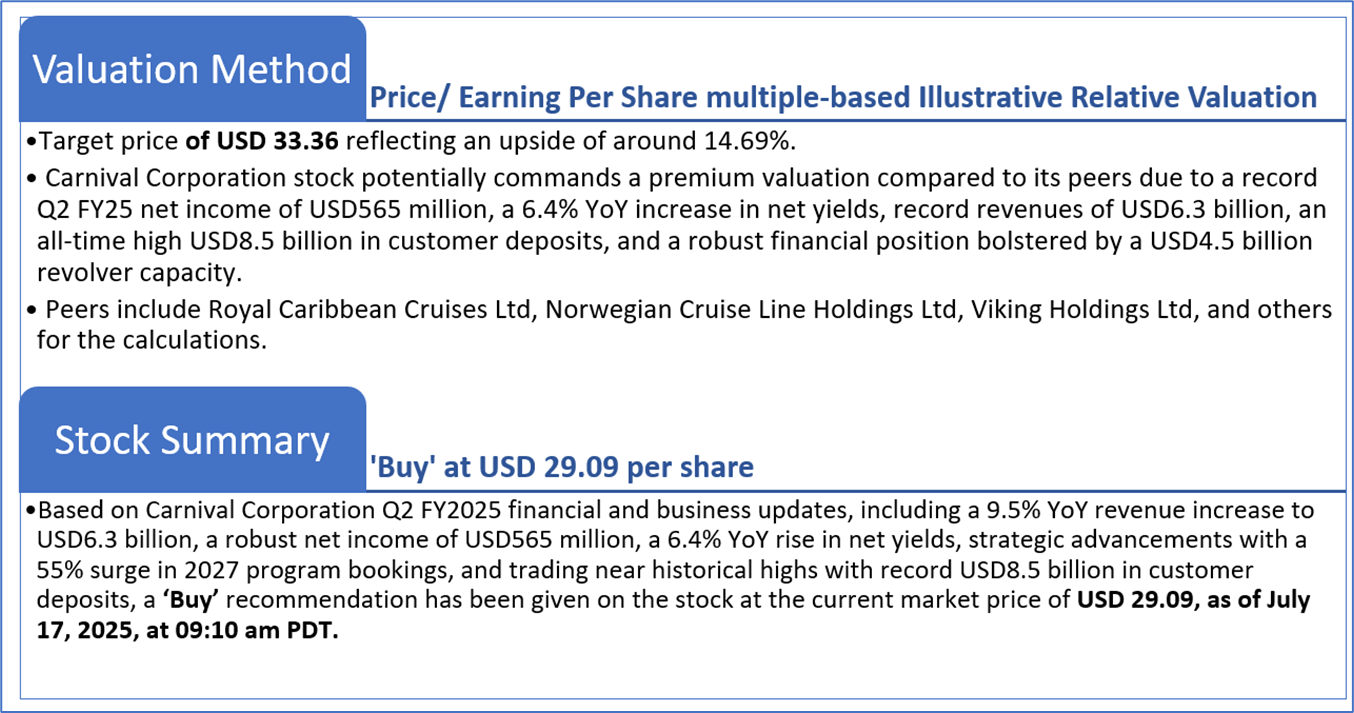
Section 4: Stock Recommendation Summary
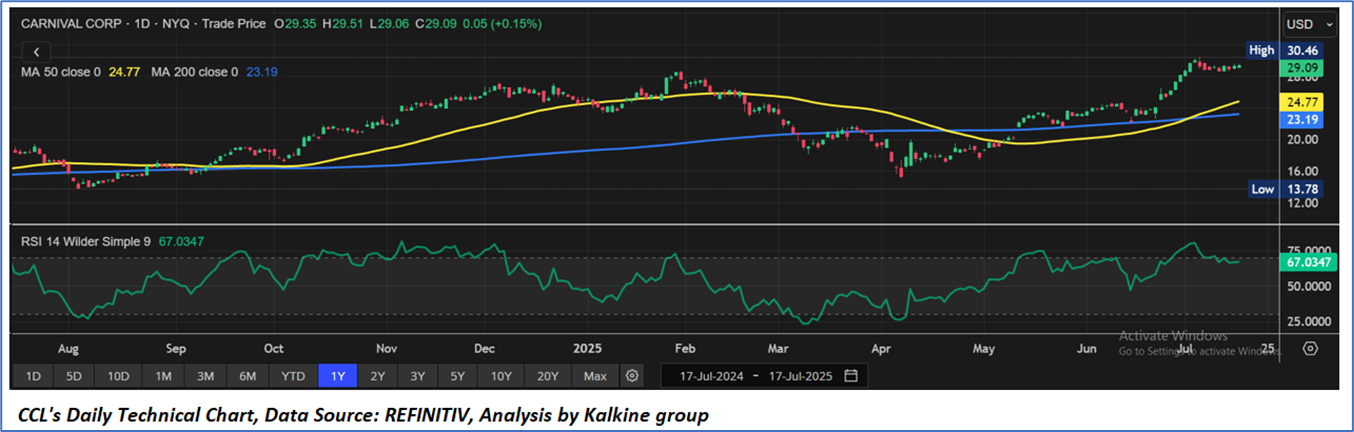
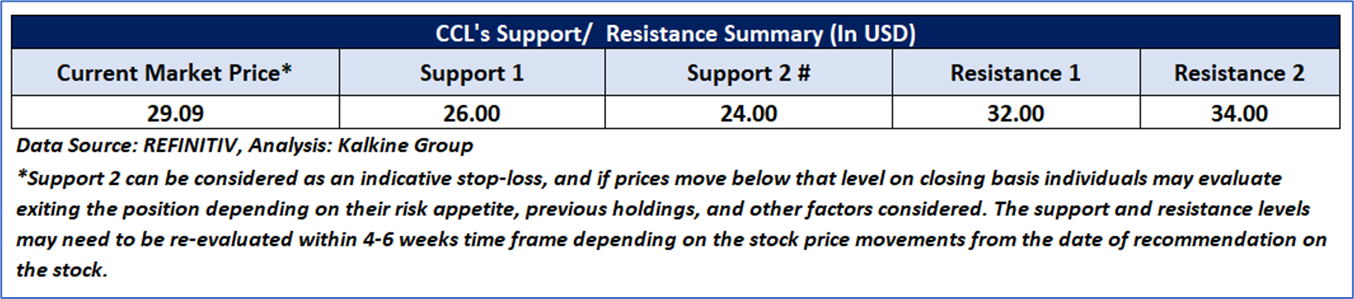
4.1 Price Performance and Technical Summary
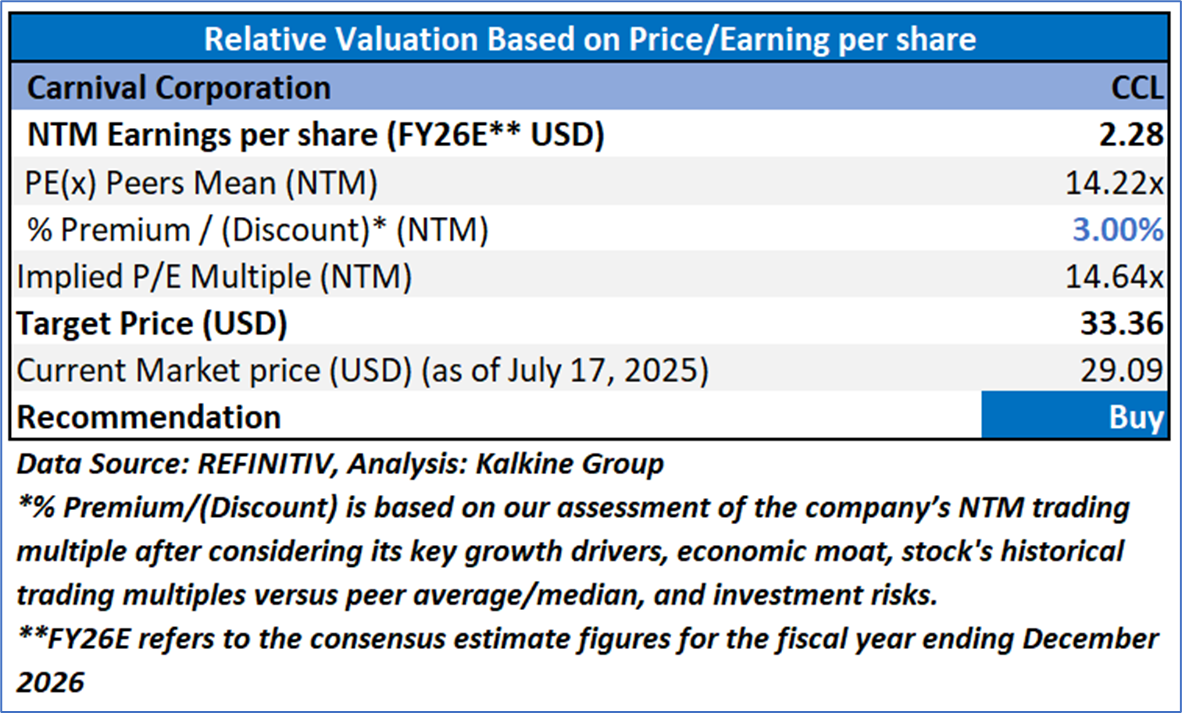
4.2 Fundamental Valuation
Valuation Methodology: Price/Earning Multiple Based Relative Valuation (Illustrative)
Markets are trading in a highly volatile zone currently due to certain macro-economic issues and geopolitical tensions prevailing. Therefore, it is prudent to follow a cautious approach while investing.
Note 1: Past performance is neither an indicator nor a guarantee of future performance.
Note 2: The reference date for all price data, currency, technical indicators, support, and resistance levels is 17 July 2025. The reference data in this report has been partly sourced from REFINITIV.
Note 3: Investment decisions should be made depending on an individual's appetite for upside potential, risks, holding duration, and any previous holdings. An 'Exit' from the stock can be considered if the Target Price mentioned as per the Valuation and or the technical levels provided has been achieved and is subject to the factors discussed above.
Note 4: Dividend Yield may vary as per the stock price movement.
Note 5: Kalkine reports are prepared based on the stock prices captured either from REFINITIV or Trading View. Typically, REFINITIV or Trading View may reflect stock prices with a delay which could be a lag of 25-30 minutes. There can be no assurance that future results or events will be consistent with the information provided in the report. The information is subject to change without any prior notice.
Technical Indicators Defined: -
Support: A level at which the stock prices tend to find support if they are falling, and a downtrend may take a pause backed by demand or buying interest. Support 1 refers to the nearby support level for the stock and if the price breaches the level, then Support 2 may act as the crucial support level for the stock.
Resistance: A level at which the stock prices tend to find resistance when they are rising, and an uptrend may take a pause due to profit booking or selling interest. Resistance 1 refers to the nearby resistance level for the stock and if the price surpasses the level, then Resistance 2 may act as the crucial resistance level for the stock.
Stop-loss: It is a level to protect further losses in case of unfavourable movement in the stock prices.
Kalkine Equities LLC, with Delaware File Number 4697384, Foreign Qualification Registration in California File Number 202109211078, and Texas File Number 805521396, is authorized to provide general advice only. The information on https://kalkine.com/ does not take into account any of your investment objectives, financial situation or needs. You should consider the appropriateness of advice taking into account your own objectives, financial situation and needs and seek independent financial advice before making any financial decisions. The link to our Terms and Conditions and Privacy Policy has been provided for your reference. On the date of publishing the reports (mentioned on the website), employees and/or associates of Kalkine do not hold positions in any of the stocks covered on the website. These stocks can change any time and readers of the reports should not consider these stocks as advice or recommendations later.
Past performance is not a reliable indicator of future performance.
 Please wait processing your request...