
Section 1: Company Overview and Fundamentals
1.1 Company Overview:
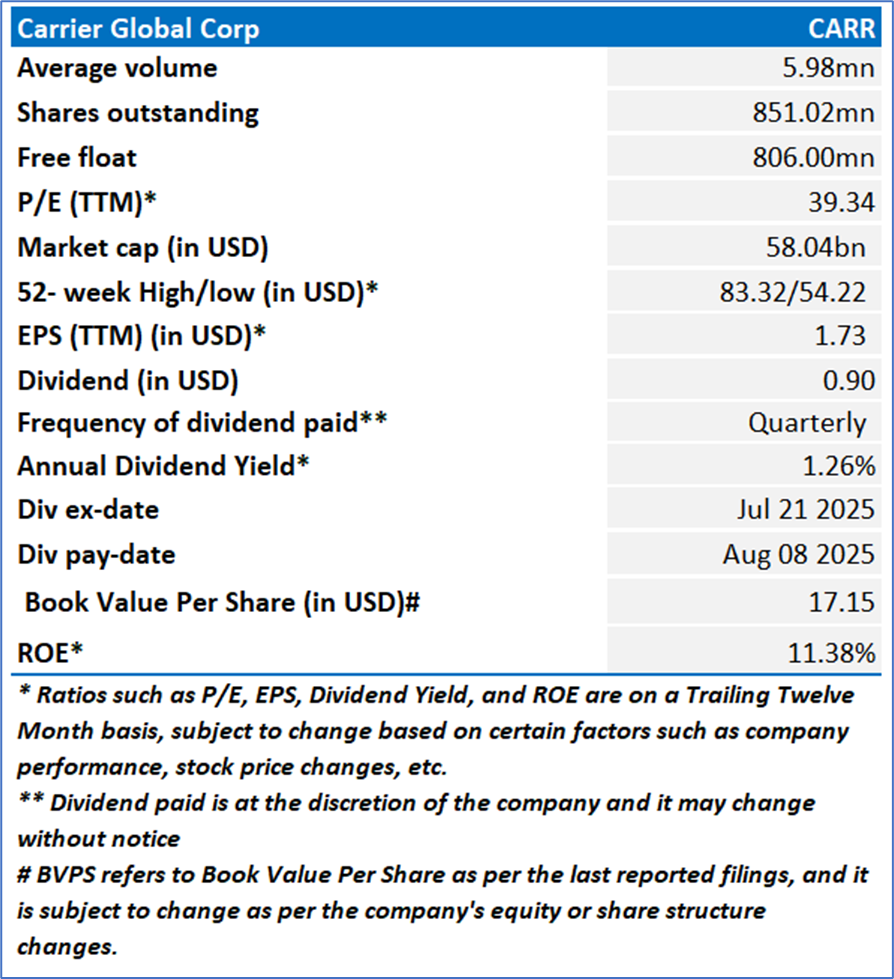
Carrier Global Corporation (NYSE: CARR) is engaged in providing intelligent climate and energy solutions with a focus on providing digitally enabled lifecycle solutions to its customers. The Company’s segment include Climate Solutions Americas, which provides products, controls, services and solutions to meet the heating, ventilation and cooling (HVAC) needs of residential and commercial customers in North and South America; Climate Solutions Europe segment provides products, controls, services and solutions to meet the HVAC needs of residential and commercial customers in Europe; Climate Solutions Asia Pacific, Middle East & Africa segment provides products, controls, services and solutions to meet the HVAC needs of residential and commercial customers in Asia Pacific, the Middle East and Africa; and Climate Solutions Transportation segment includes global transport refrigeration and monitoring products, services and digital solutions for trucks, trailers, shipping containers, intermodal and rail.
Kalkine’s Diversified Opportunities Report covers the Company Overview, Key positives & negatives, Investment summary, Key investment metrics, Top 10 shareholding, Business updates and insights into company recent financial results, Key Risks & Outlook, Price performance and technical summary, Target Price, and Recommendation on the stock.
Stock Performance:
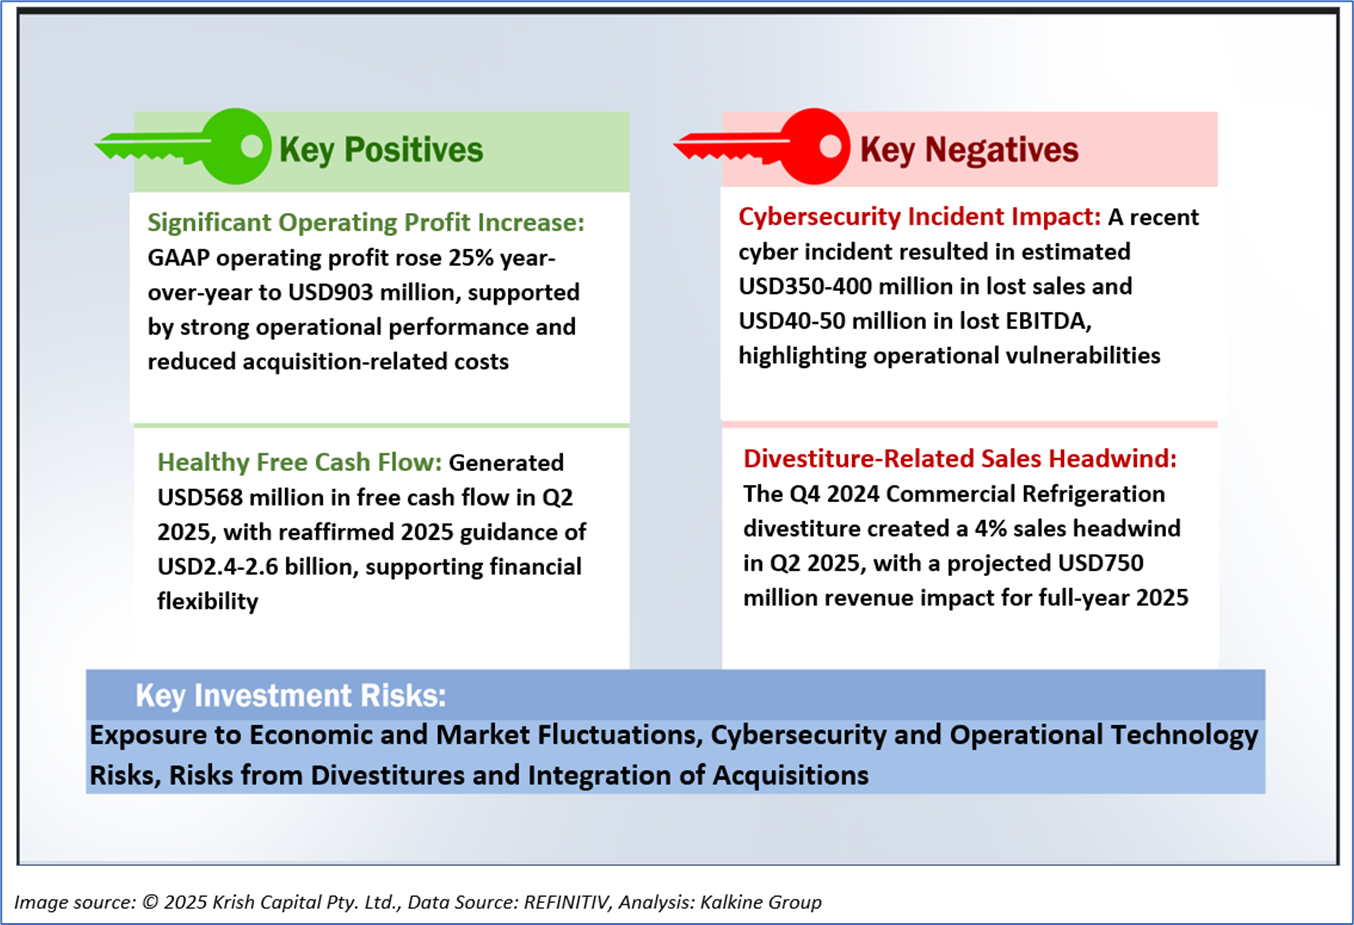
1.2 The Key Positives, Negatives, and Investment summary
1.3 Top 10 shareholders:
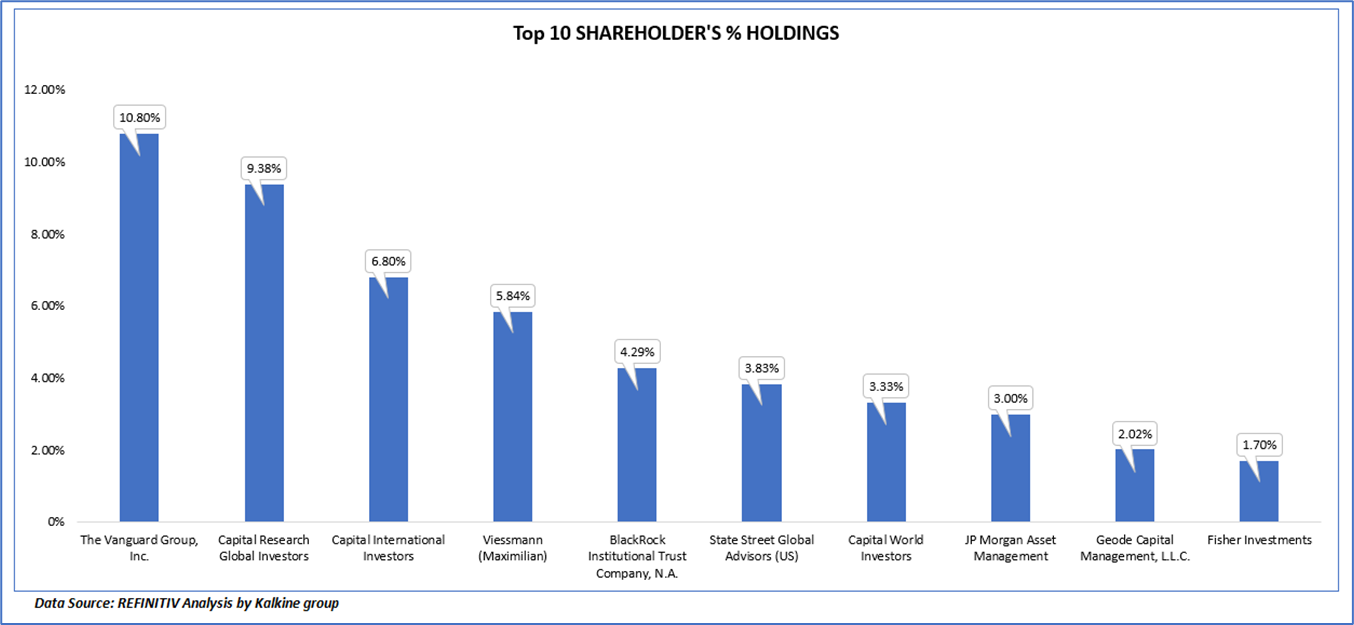
The top 10 shareholders together form ~50.99% of the total shareholding, signifying concentrated shareholding. The Vanguard Group, Inc. and Capital Research Global Investors are the biggest shareholders, holding the maximum stake in the company at 10.80% and 9.38%, respectively.
1.4 Key Metrics:
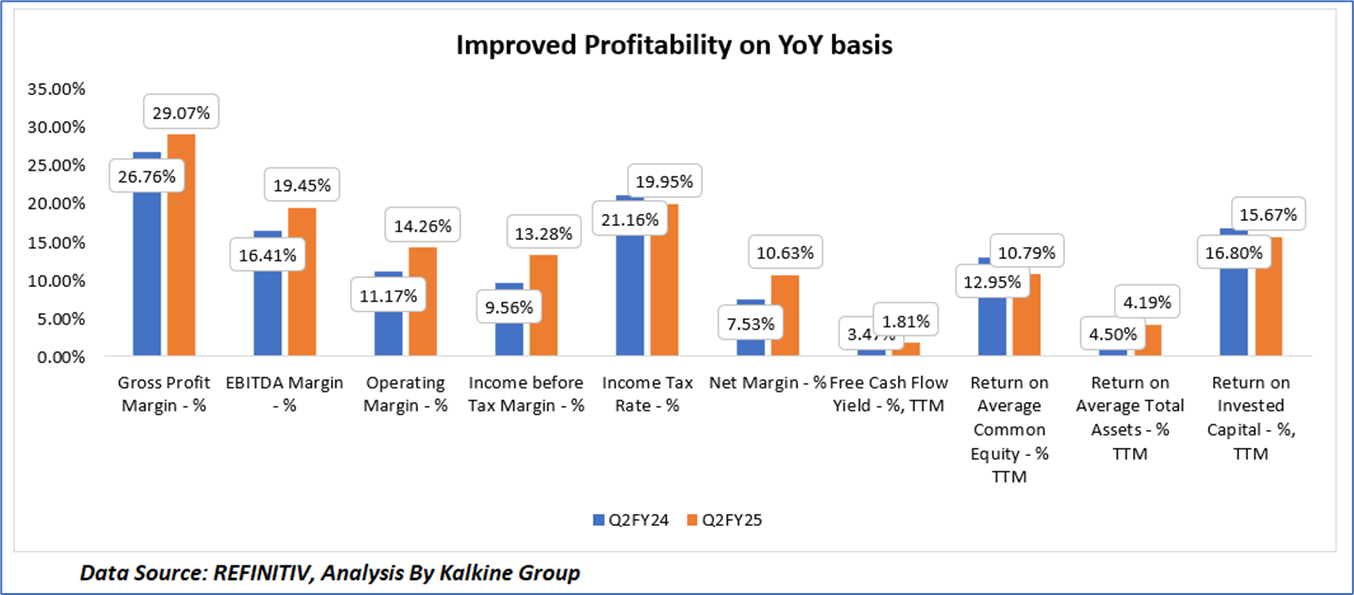
Carrier Global Corporation demonstrated robust financial progress in Q2 2025, with key profitability metrics showing significant improvement over Q2 2024, reflecting operational efficiency and strategic execution despite challenges from divestitures and regional market softness. The gross profit margin increased by 231 basis points to 29.07% from 26.76%, driven by strong organic sales growth of 6% and productivity gains, particularly in the Climate Solutions Americas segment, which saw a 45% surge in Commercial sales. The EBITDA margin expanded by 304 basis points to 19.45% from 16.41%, and the operating margin rose by 309 basis points to 14.26% from 11.17%, supported by a 25% increase in GAAP operating profit to USD903 million and reduced acquisition-related costs. The income before tax margin improved by 372 basis points to 13.28% from 9.56%, while the net margin grew by 310 basis points to 10.63% from 7.53%, aided by a lower income tax rate of 19.95% compared to 21.16%.
However, the free cash flow yield (TTM) declined to 1.81% from 3.47%, reflecting higher capital expenditures and divestiture impacts, and return metrics softened, with return on average common equity (TTM) dropping to 10.79% from 12.95%, return on average total assets (TTM) decreasing to 4.19% from 4.50%, and return on invested capital (TTM) falling to 15.67% from 16.80%, partly due to integration costs from the USD13 billion Viessmann acquisition and a recent cyber incident causing USD350-400 million in lost sales. Despite these challenges, Carrier’s reaffirmed 2025 guidance, projecting adjusted EPS of USD3.00-3.10 and free cash flow of USD2.4-2.6 billion, underscores its resilience and potential for sustained growth, though macroeconomic volatility and acquisition integration risks warrant close monitoring.
Section 2: Business Updates and Corporate Business Highlights
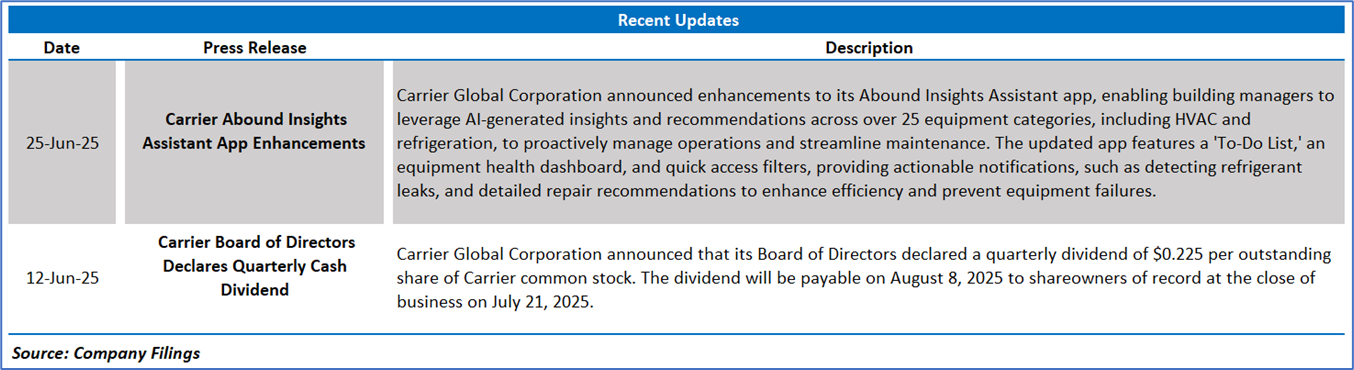
2.1 Business Updates:
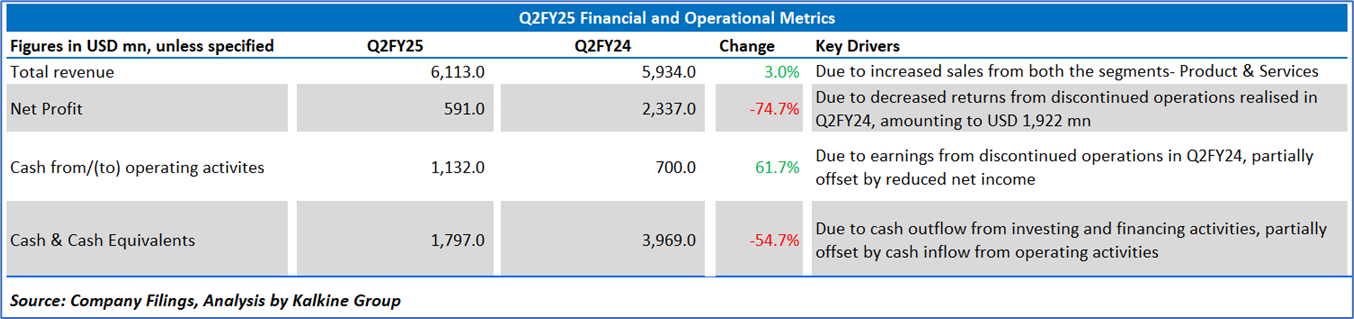
2.2 Insights of Q2FY25:
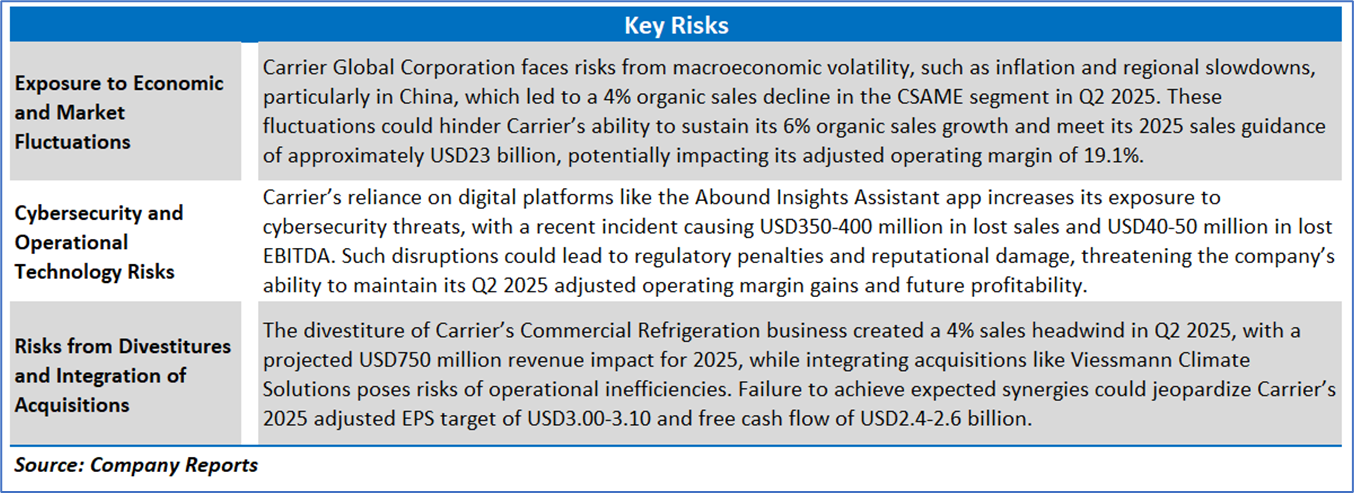
Section 3: Key Risks & Outlook
Section 4: Stock Recommendation Summary:
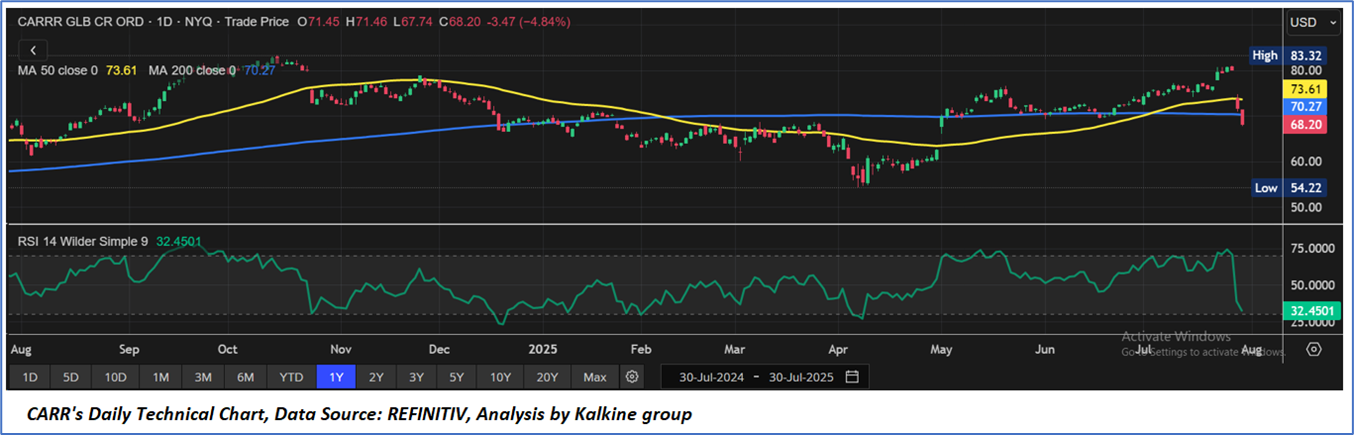
4.1 Price Performance and Technical Summary:
Stock Performance:
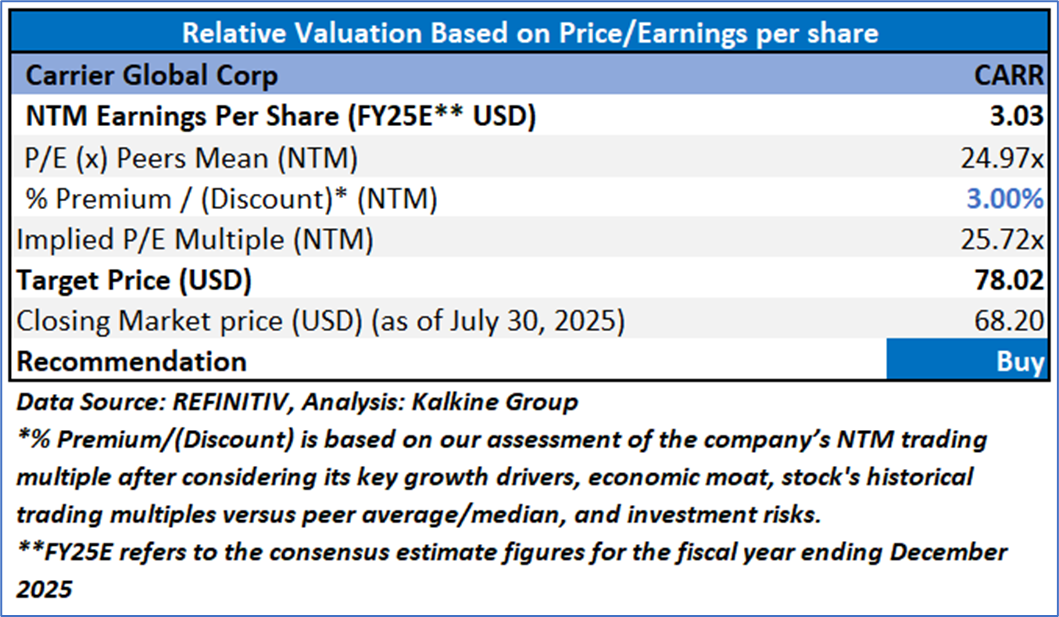
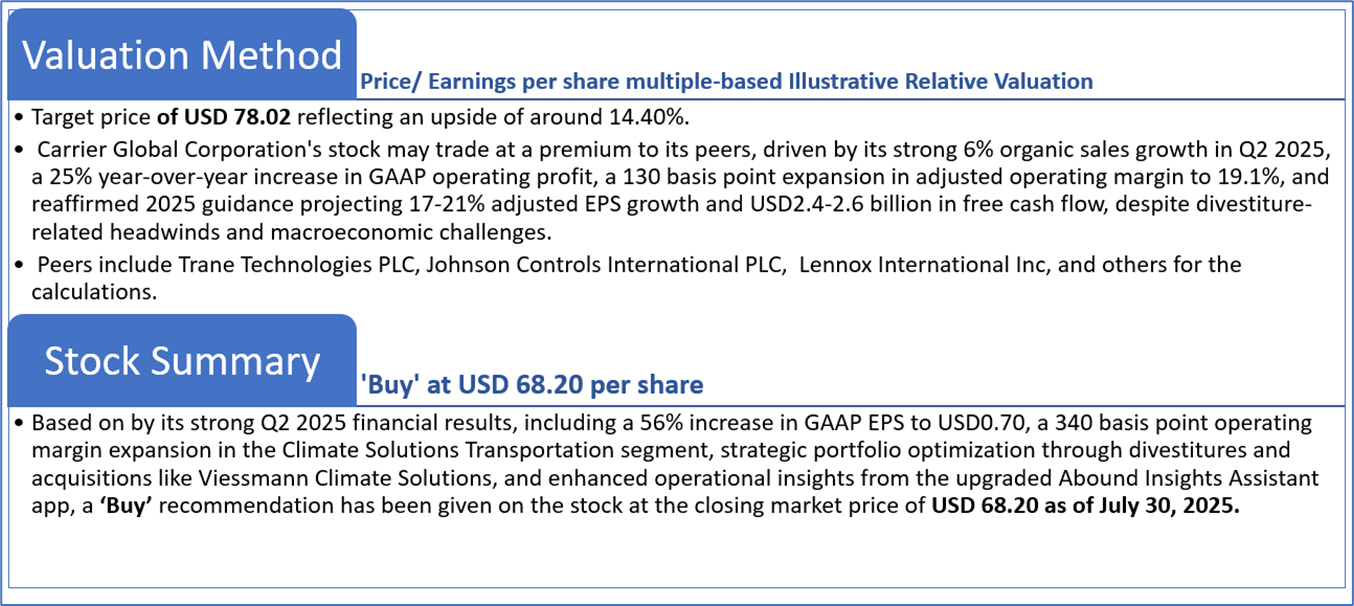
4.2 Fundamental Valuation
Valuation Methodology: Price/Earnings per share Multiple Based Relative Valuation
Markets are trading in a highly volatile zone currently due to certain macroeconomic issues and geopolitical tensions prevailing. Therefore, it is prudent to follow a cautious approach while investing.
Note 1: Past performance is not a reliable indicator of future performance.
Note 2: The reference date for all price data, currency, technical indicators, support, and resistance levels is July 30, 2025. The reference data in this report has been partly sourced from REFINITIV.
Note 3: Investment decisions should be made depending on an individual's appetite for upside potential, risks, holding duration, and any previous holdings. An 'Exit' from the stock can be considered if the Target Price mentioned as per the Valuation and or the technical levels provided has been achieved and is subject to the factors discussed above.
Note 4: The report publishing date is as per the Pacific Time Zone.
Technical Indicators Defined: -
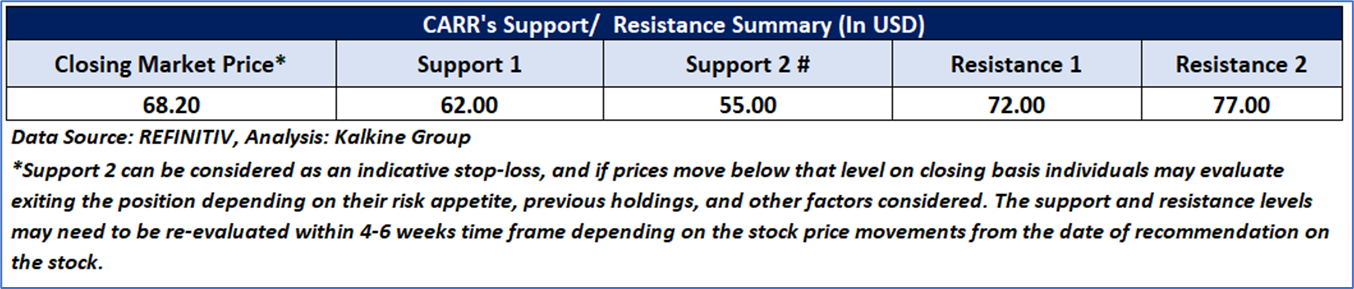
Support: A level at which the stock prices tend to find support if they are falling, and a downtrend may take a pause backed by demand or buying interest. Support 1 refers to the nearby support level for the stock and if the price breaches the level, then Support 2 may act as the crucial support level for the stock.
Resistance: A level at which the stock prices tend to find resistance when they are rising, and an uptrend may take a pause due to profit booking or selling interest. Resistance 1 refers to the nearby resistance level for the stock and if the price surpasses the level, then Resistance 2 may act as the crucial resistance level for the stock.
Stop-loss: It is a level to protect against further losses in case of unfavorable movement in the stock prices.
Kalkine Equities LLC, with Delaware File Number 4697384, Foreign Qualification Registration in California File Number 202109211078, and Texas File Number 805521396, is authorized to provide general advice only. The information on https://kalkine.com/ does not take into account any of your investment objectives, financial situation or needs. You should consider the appropriateness of advice taking into account your own objectives, financial situation and needs and seek independent financial advice before making any financial decisions. The link to our Terms and Conditions and Privacy Policy has been provided for your reference. On the date of publishing the reports (mentioned on the website), employees and/or associates of Kalkine do not hold positions in any of the stocks covered on the website. These stocks can change any time and readers of the reports should not consider these stocks as advice or recommendations later.
Past performance is not a reliable indicator of future performance.
 Please wait processing your request...