
Section 1: Company Overview and Fundamentals
1.1 Company Overview:
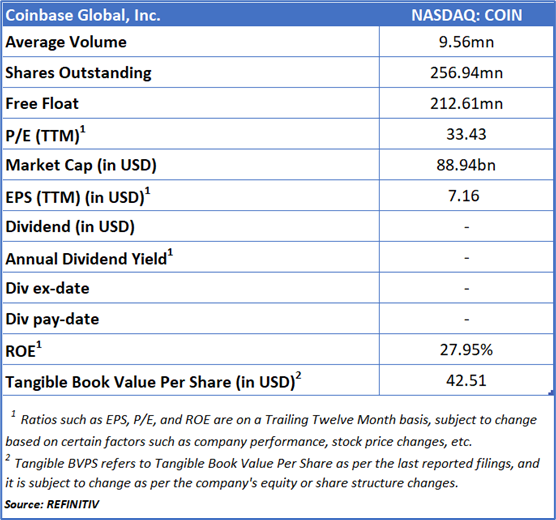
Coinbase Global, Inc. (NASDAQ: COIN) the parent company of Coinbase, Inc. and its subsidiaries, operates as a leading platform for accessing and interacting with crypto assets while also delivering essential infrastructure to support the onchain economy. The company serves three primary customer segments—Consumers, Institutions, and Developers—through a broad range of products and services tailored to their needs.
Kalkine’s Diversified Opportunities Report covers the Company Overview, Key positives & negatives, Investment summary, Key investment metrics, Top 10 shareholding, Business updates and insights into company recent financial results, Key Risks & Outlook, Price performance and technical summary, Target Price, and Recommendation on the stock.
Stock Performance:
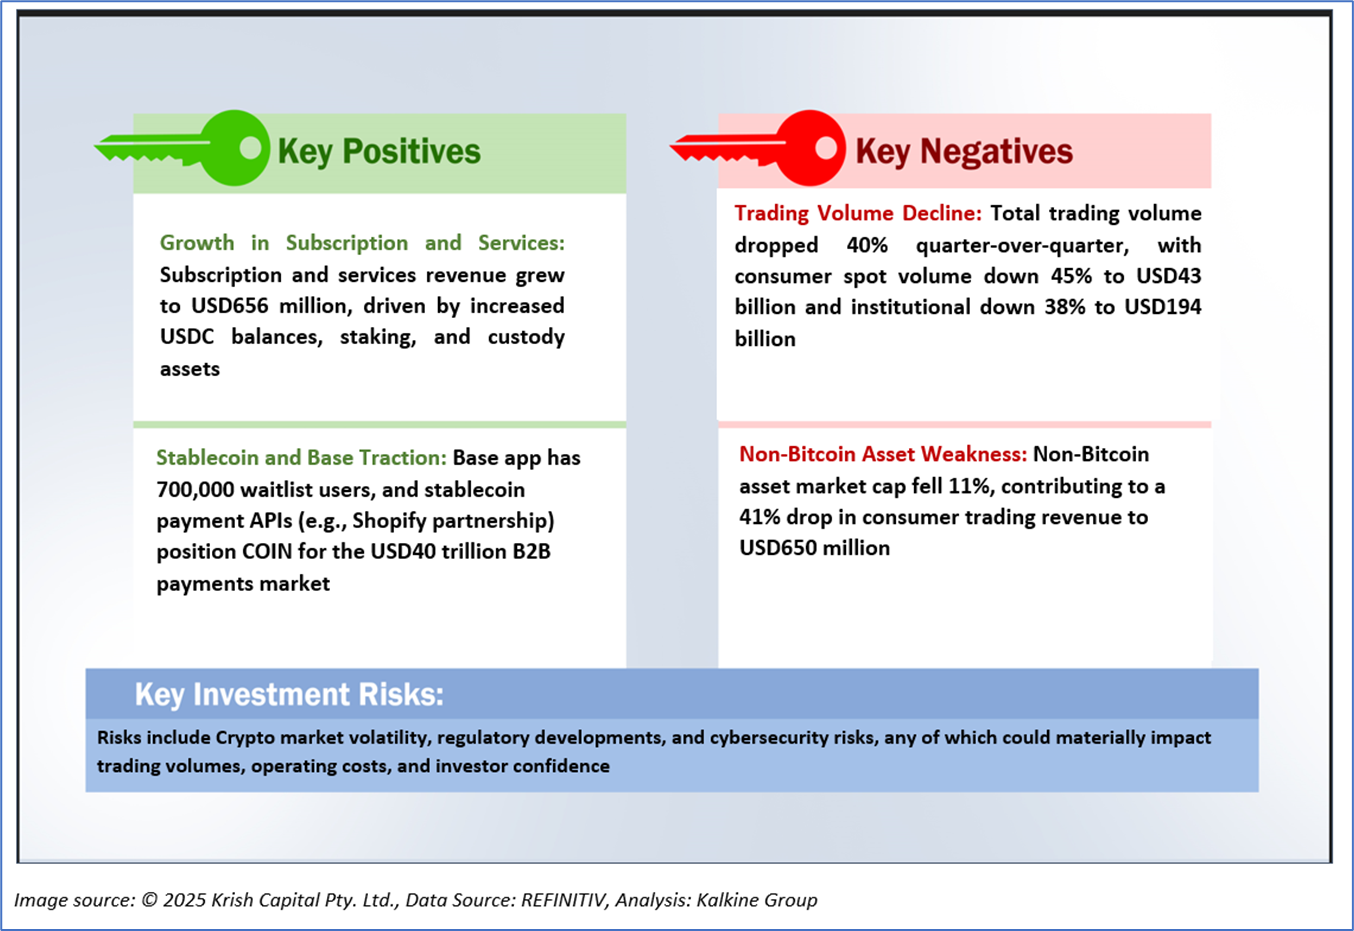
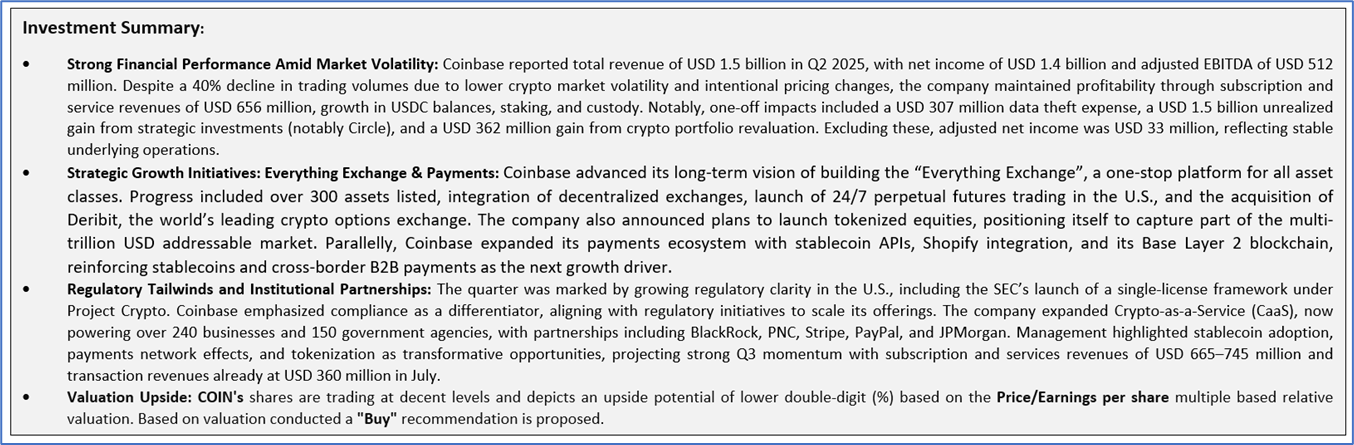
1.2 The Key Positives, Negatives, and Investment summary
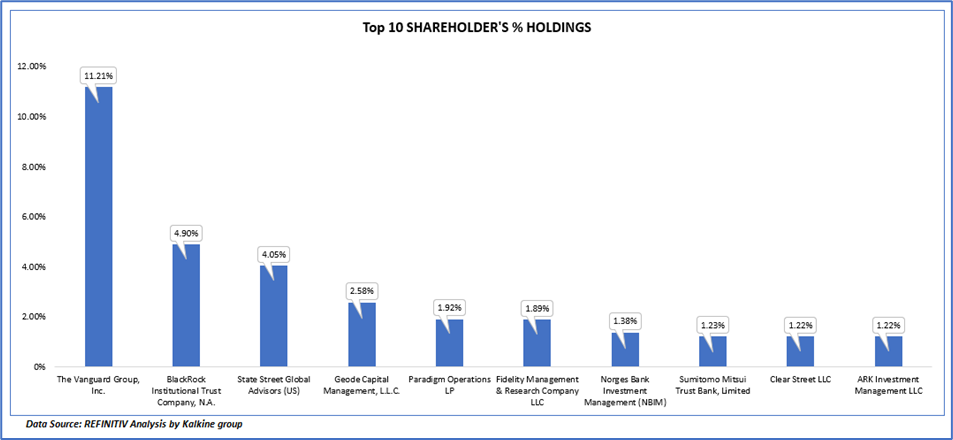
1.3 Top 10 shareholders:
The top 10 shareholders together form ~ 31.61% of the total shareholding, signifying concentrated shareholding. The Vanguard Group, Inc. and BlackRock Institutional Trust Company, N.A. are the biggest shareholders, holding the maximum stake in the company at 11.21% and 4.90%, respectively.
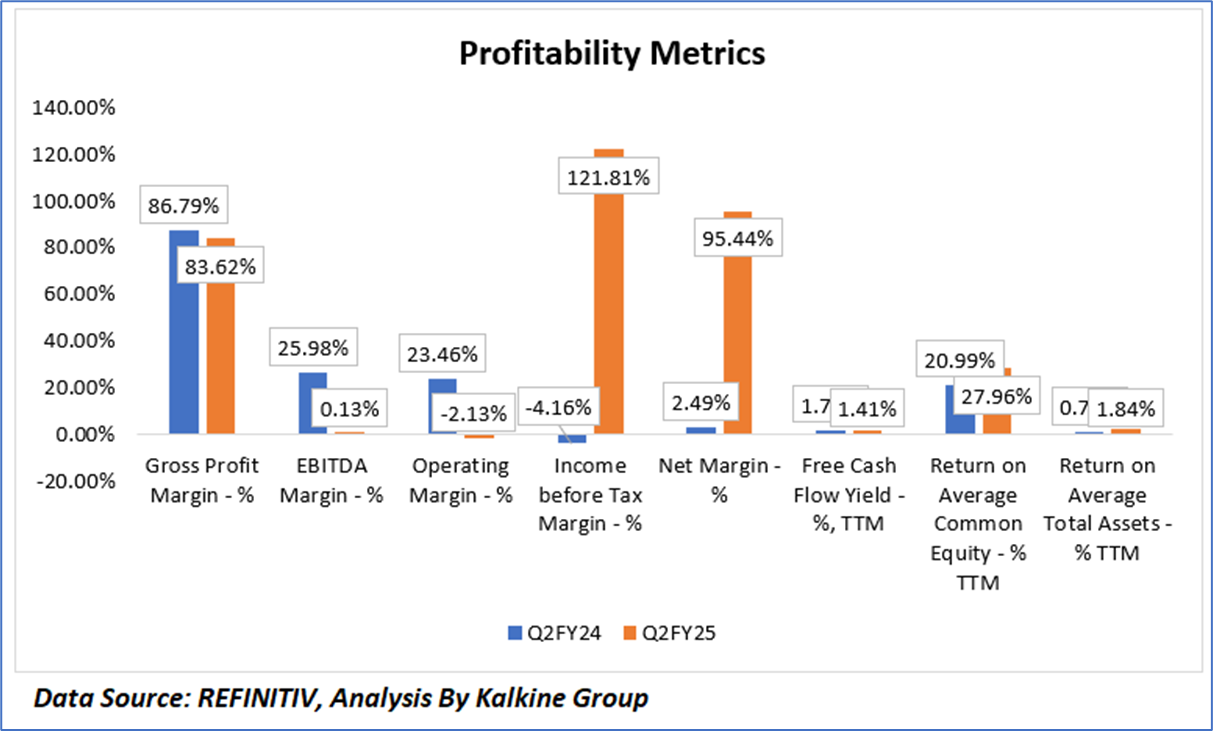
1.4 Key Metrics:
In Q2 FY25, Coinbase’s financial performance reflected a mixed picture of margin compression in operating efficiency but a sharp uplift in profitability on a net basis. Gross profit margin declined from 86.79% in Q2 FY24 to 83.62% in Q2 FY25, indicating rising cost pressures relative to revenues. Similarly, EBITDA margin contracted significantly from 25.98% to 0.13%, and the operating margin deteriorated from 23.46% to -2.13%, reflecting elevated expenses and one-off costs such as the data theft charge. However, profitability at the bottom line expanded materially, with income before tax margin improving from -4.16% to 121.81% and net margin surging from 2.49% to 95.44%, primarily due to large unrealized gains from strategic investments and crypto portfolio revaluations. On a capital efficiency front, the company delivered higher returns, with ROE rising from 20.99% to 27.96% and ROA improving from 0.70% to 1.84%, though the free cash flow yield slipped modestly from 1.70% to 1.41% TTM, underscoring reduced cash conversion. Overall, while operating performance weakened, extraordinary gains and improved capital returns drove robust bottom-line metrics.
Section 2: Business Updates and Corporate Business Highlights
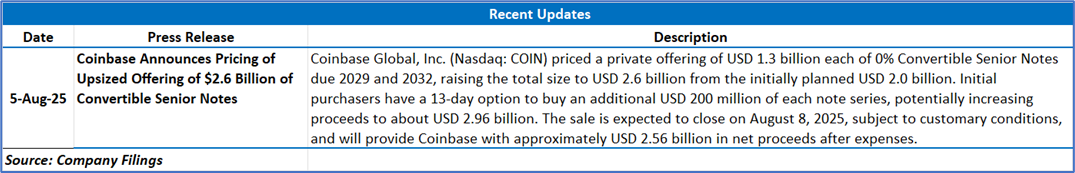
2.1 Recent Business Updates
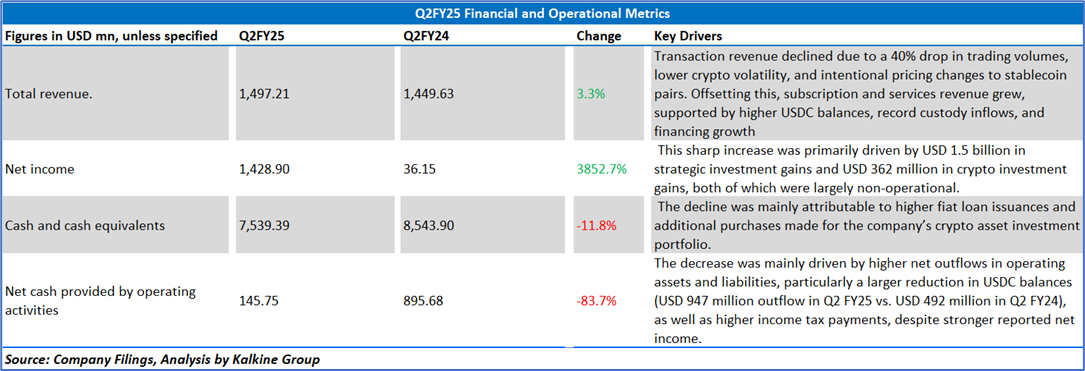
2.2 Insights of Q2FY25:
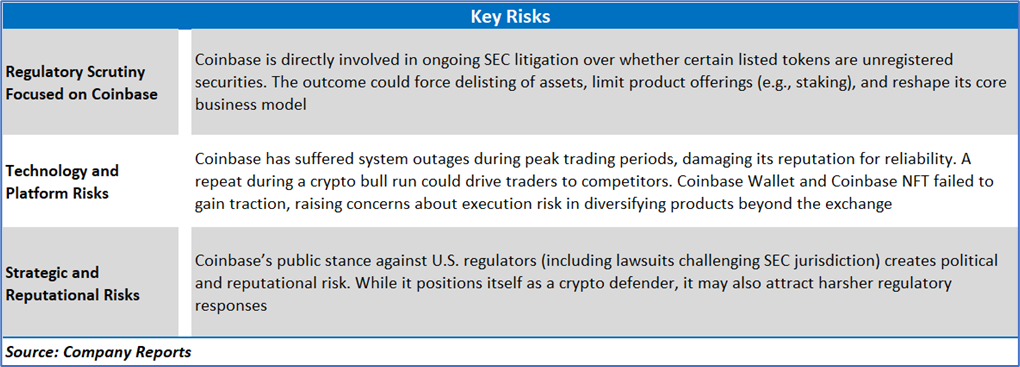
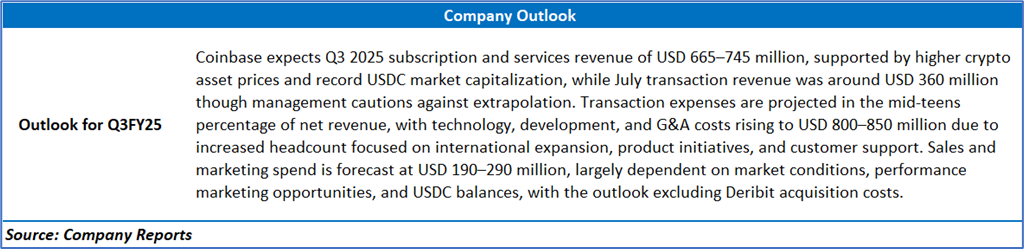
Section 3: Key Risks & Outlook
Section 4: Stock Recommendation Summary:
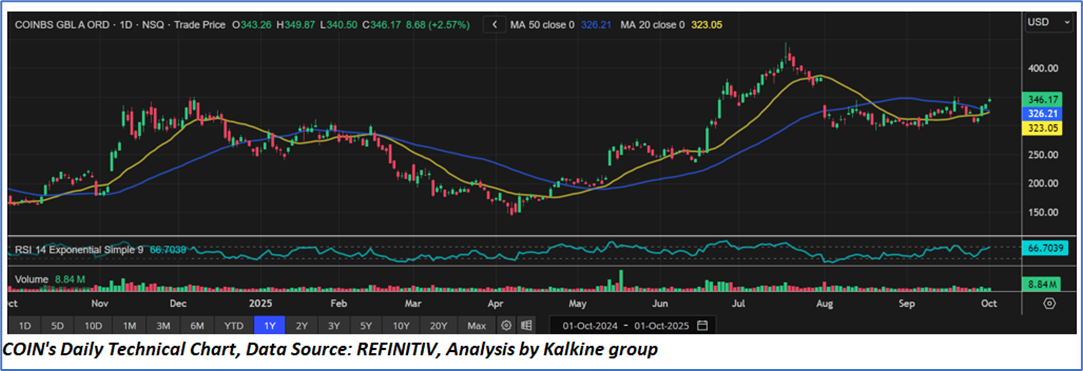
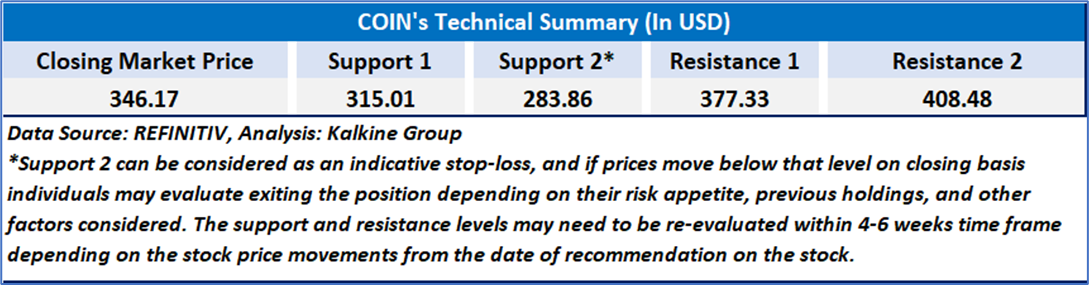
4.1 Price Performance and Technical Summary:
Stock Performance:
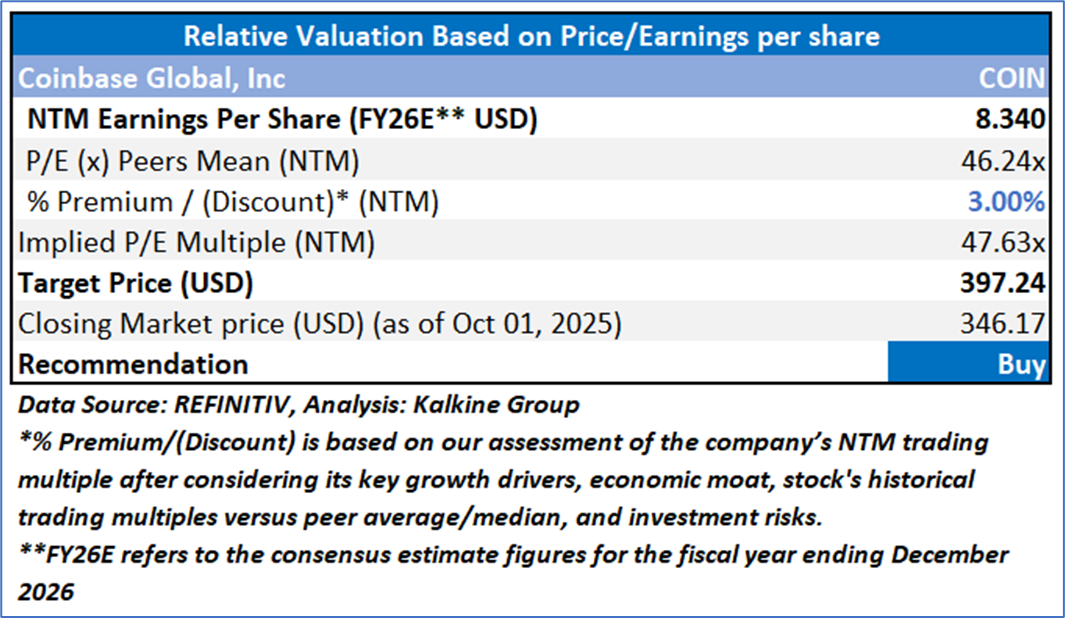
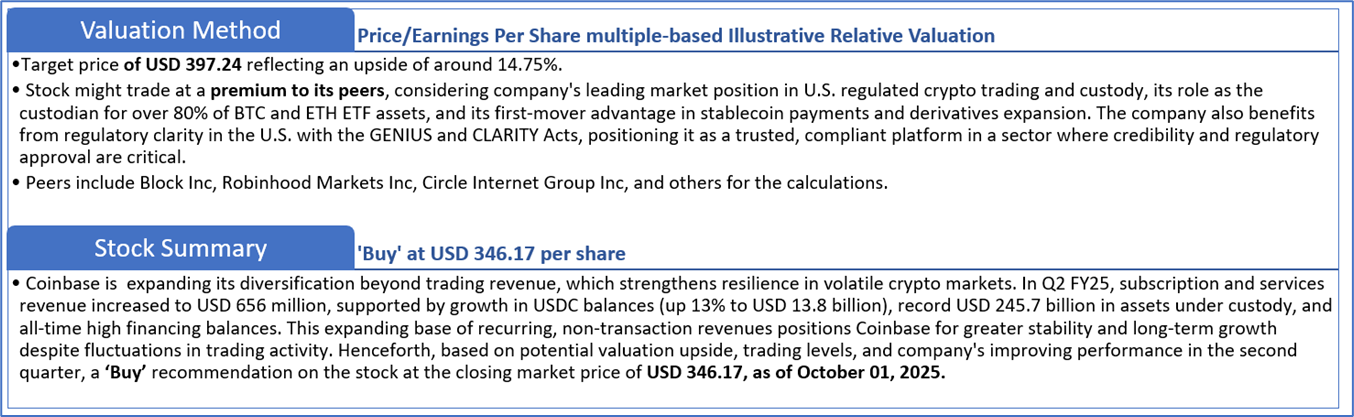
4.2 Fundamental Valuation
Valuation Methodology: Price/Earnings Per Share Multiple Based Relative Valuation
Markets are trading in a highly volatile zone currently due to certain macroeconomic issues and geopolitical tensions prevailing. Therefore, it is prudent to follow a cautious approach while investing.
Note 1: Past performance is not a reliable indicator of future performance.
Note 2: The reference date for all price data, currency, technical indicators, support, and resistance levels is October 01, 2025. The reference data in this report has been partly sourced from REFINITIV.
Note 3: Investment decisions should be made depending on an individual's appetite for upside potential, risks, holding duration, and any previous holdings. An 'Exit' from the stock can be considered if the Target Price mentioned as per the Valuation and or the technical levels provided has been achieved and is subject to the factors discussed above.
Note 4: The report publishing date is as per the Pacific Time Zone.
Technical Indicators Defined: -
Support: A level at which the stock prices tend to find support if they are falling, and a downtrend may take a pause backed by demand or buying interest. Support 1 refers to the nearby support level for the stock and if the price breaches the level, then Support 2 may act as the crucial support level for the stock.
Resistance: A level at which the stock prices tend to find resistance when they are rising, and an uptrend may take a pause due to profit booking or selling interest. Resistance 1 refers to the nearby resistance level for the stock and if the price surpasses the level, then Resistance 2 may act as the crucial resistance level for the stock.
Stop-loss: It is a level to protect against further losses in case of unfavorable movement in the stock prices.
Kalkine Equities LLC, with Delaware File Number 4697384, Foreign Qualification Registration in California File Number 202109211078, and Texas File Number 805521396, is authorized to provide general advice only. The information on https://kalkine.com/ does not take into account any of your investment objectives, financial situation or needs. You should consider the appropriateness of advice taking into account your own objectives, financial situation and needs and seek independent financial advice before making any financial decisions. The link to our Terms and Conditions and Privacy Policy has been provided for your reference. On the date of publishing the reports (mentioned on the website), employees and/or associates of Kalkine do not hold positions in any of the stocks covered on the website. These stocks can change any time and readers of the reports should not consider these stocks as advice or recommendations later.
Past performance is not a reliable indicator of future performance.
 Please wait processing your request...