
Section 1: Company Overview and Fundamentals
1.1 Company Overview:
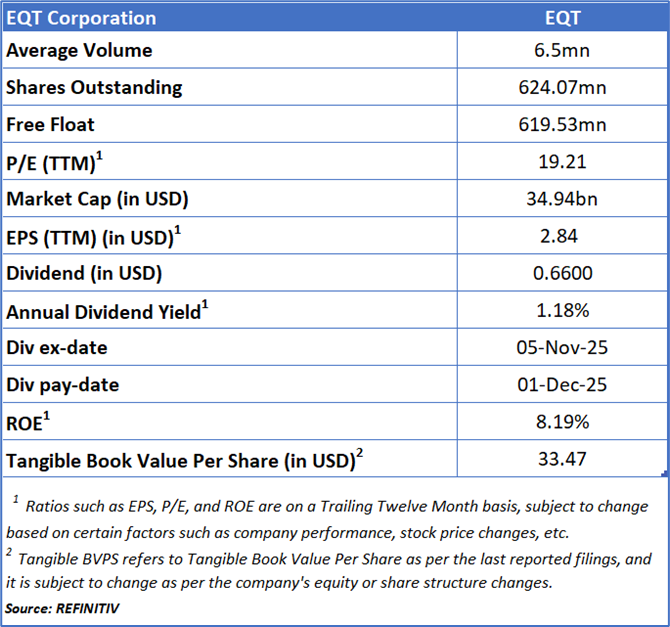
EQT Corporation (NYSE: EQT) is a leading vertically integrated U.S. natural gas producer with both upstream and midstream operations concentrated in the Appalachian Basin. The company operates primarily across Pennsylvania, West Virginia, and Ohio, holding or leasing roughly 610,000 net acres in Pennsylvania—predominantly in the state’s southwest, particularly within Greene and Washington Counties.
Kalkine’s Diversified Opportunities Report covers the Company Overview, Key positives & negatives, Investment summary, Key investment metrics, Top 10 shareholding, Business updates and insights into company recent financial results, Key Risks & Outlook, Price performance and technical summary, Target Price, and Recommendation on the stock.
Stock Performance:
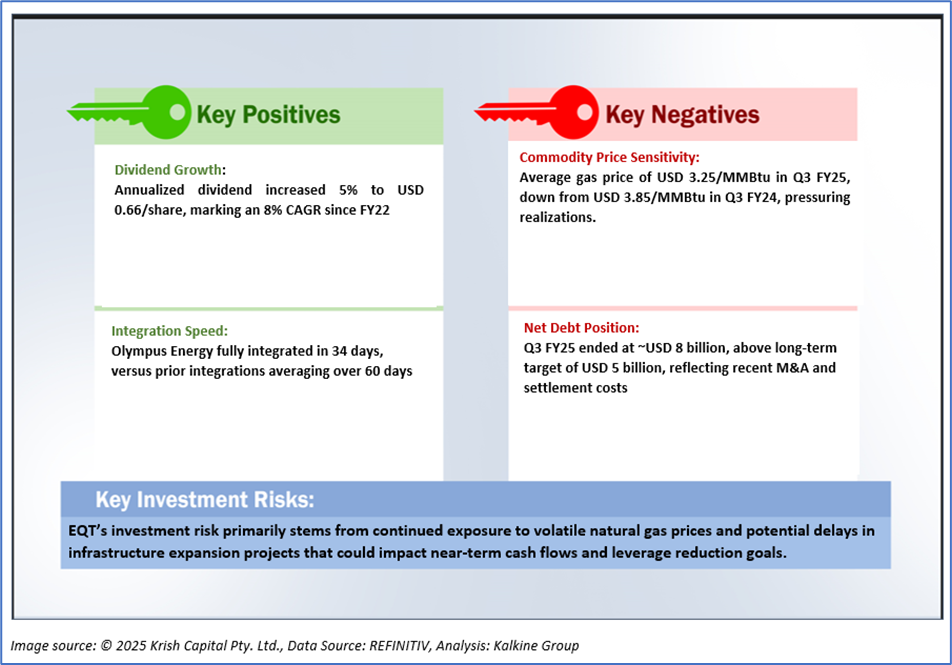
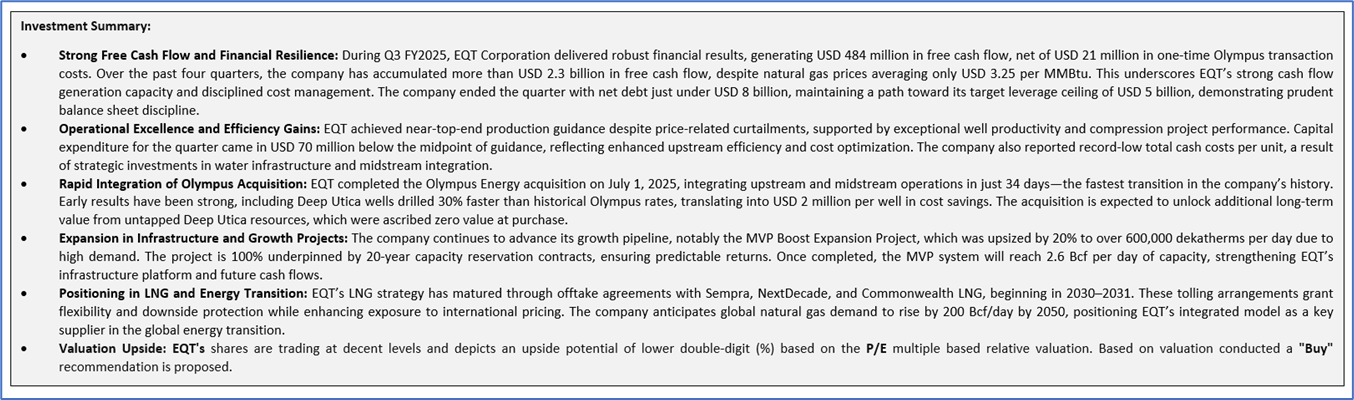
1.2 The Key Positives, Negatives, and Investment summary
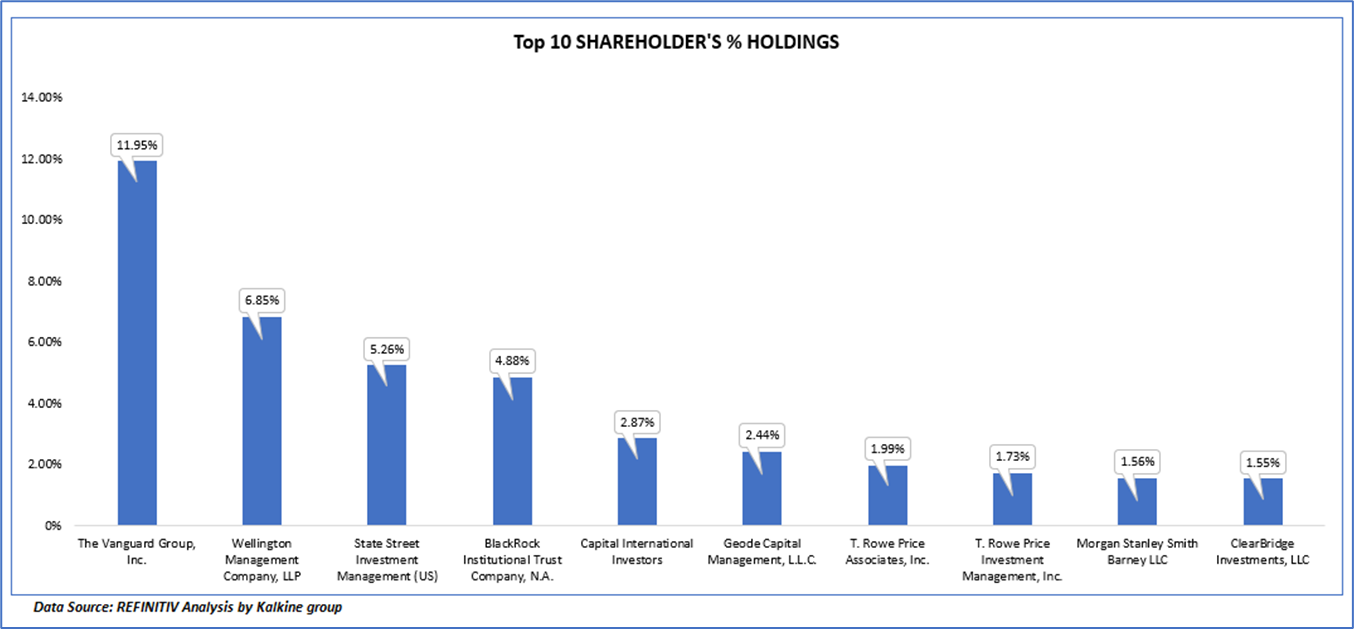
1.3 Top 10 shareholders:
The top 10 shareholders together form ~ 41.09% of the total shareholding, signifying concentrated shareholding. The Vanguard Group, Inc. and Wellington Management Company, LLP are the biggest shareholders, holding the maximum stake in the company at 11.95% and 6.85%, respectively.
1.4 Key Metrics:
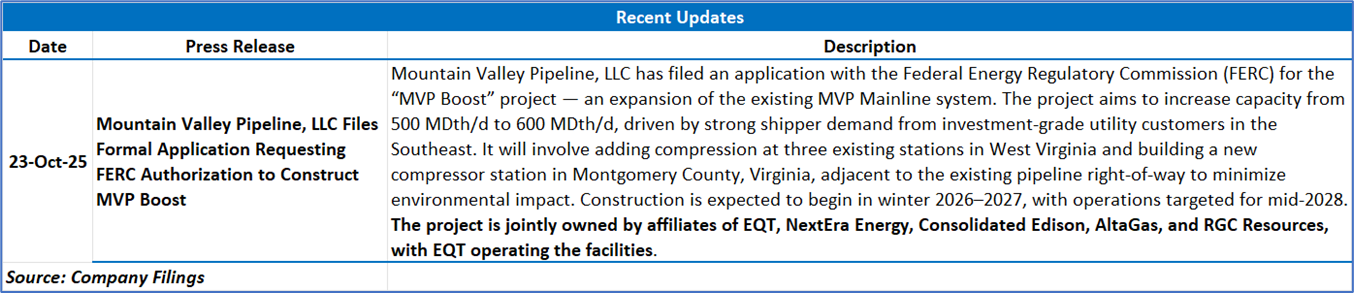
Between Q3 FY2024 and Q3 FY2025, EQT Corporation demonstrated a marked improvement across all margin metrics, driven by a combination of stronger realized gas prices, higher production volumes, and lower per-unit operating costs. The company’s gross and EBITDA margins expanded significantly, reflecting efficiency gains from its integrated operations, including cost synergies and enhanced productivity following the rapid Olympus acquisition integration. Operating and pretax margins turned positive as disciplined capital spending, record-low total cash costs, and reduced one-time expenses improved profitability. Net margins also swung into positive territory, supported by robust free cash flow generation, lower leverage, and enhanced marketing optimization that tightened price differentials. Overall, EQT’s vertically integrated, low-cost model and operational excellence enabled a strong recovery in profitability, positioning it well above the industry median across all key performance measures.
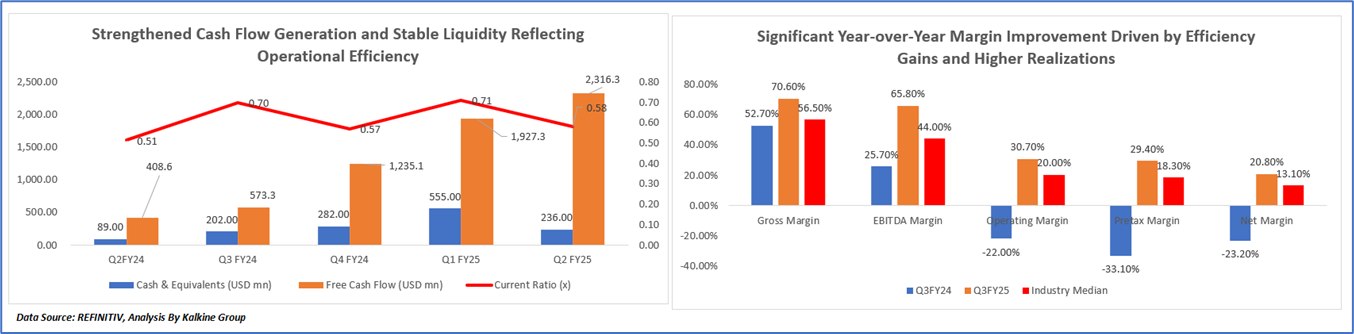
Moreover, from Q2 FY2024 to Q2 FY2025, EQT Corporation exhibited a notable increase in free cash flow, which grew from USD 408.6 million to USD 2,316.3 million, driven by stronger operational performance, effective cost optimization, and favorable gas price realizations. Cash and cash equivalents also rose over the period, supported by improved cash generation and synergies from the Olympus Energy integration, although a modest decline in Q2 FY2025 reflected targeted spending on dividends and strategic growth projects. The current ratio moved within a range of 0.51 to 0.71, signifying stable liquidity management and disciplined reinvestment of cash flows. Collectively, these trends underscore EQT’s strengthened cash flow profile and financial stability, supported by operational efficiency and a focused approach to capital deployment.
Section 2: Business Updates and Corporate Business Highlights
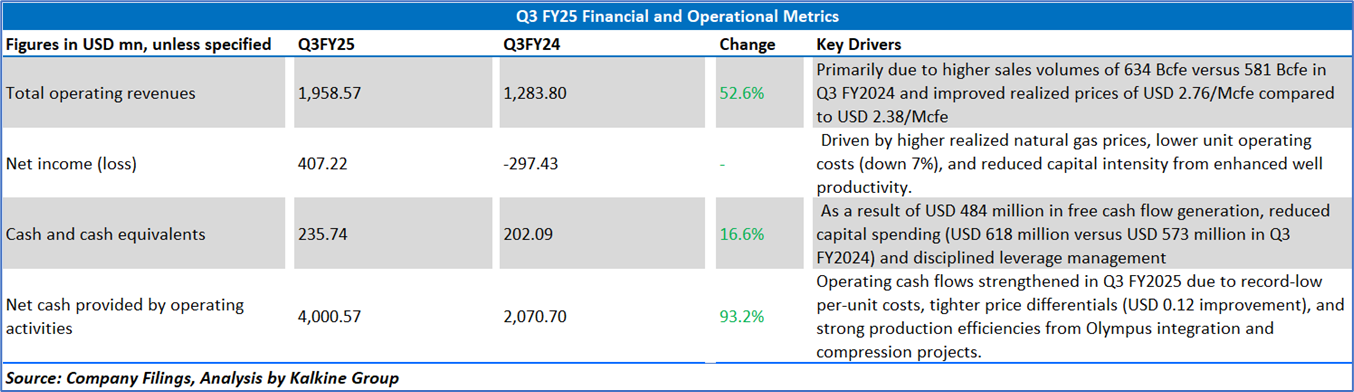
2.1 Recent Business Updates
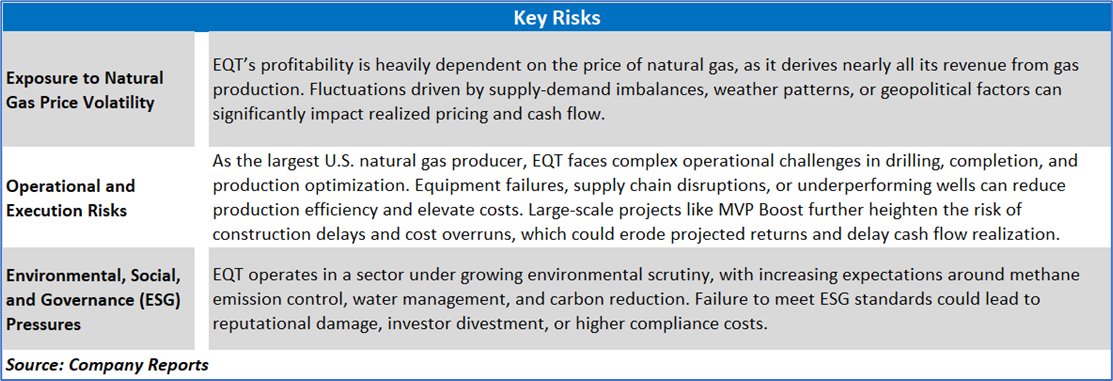
2.2 Insights of Q3FY25:
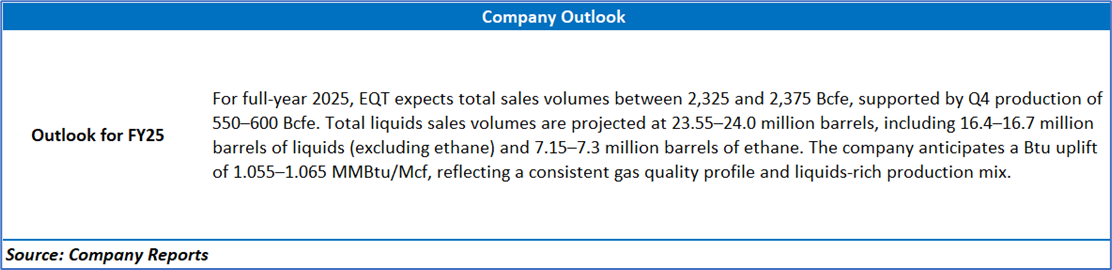
Section 3: Key Risks & Outlook
Section 4: Stock Recommendation Summary:
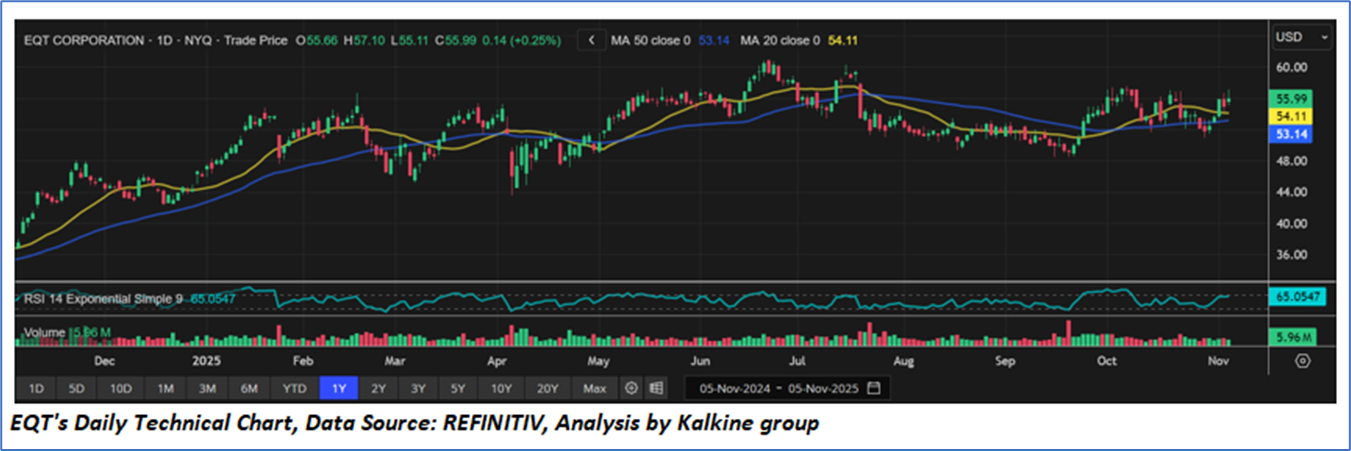
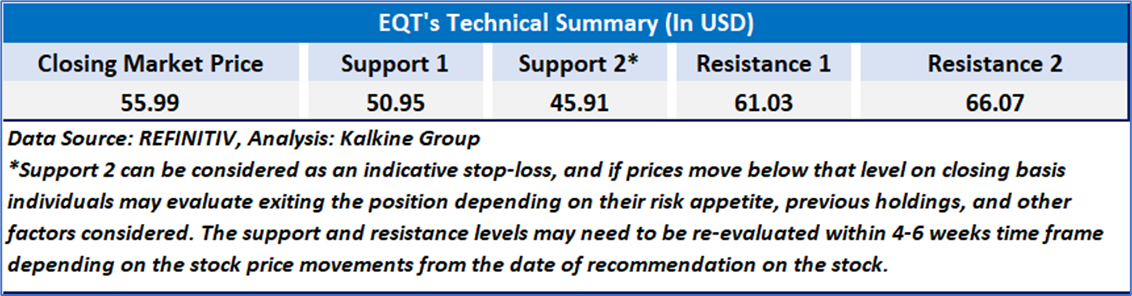
4.1 Price Performance and Technical Summary:
Stock Performance:
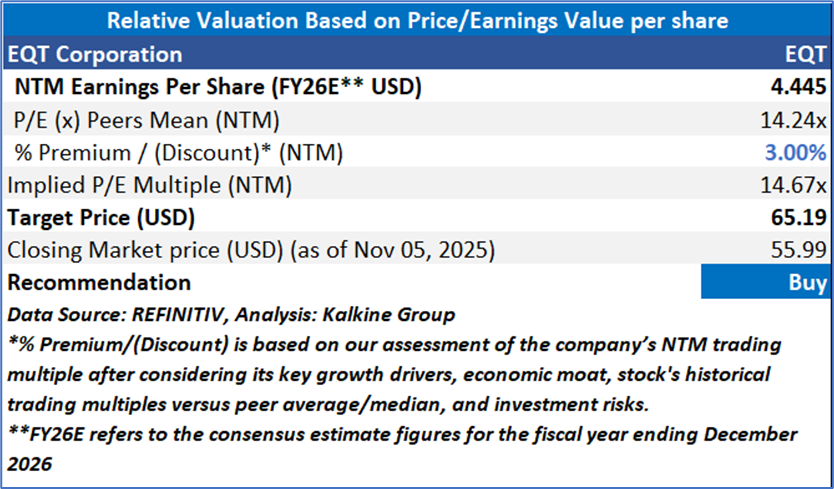
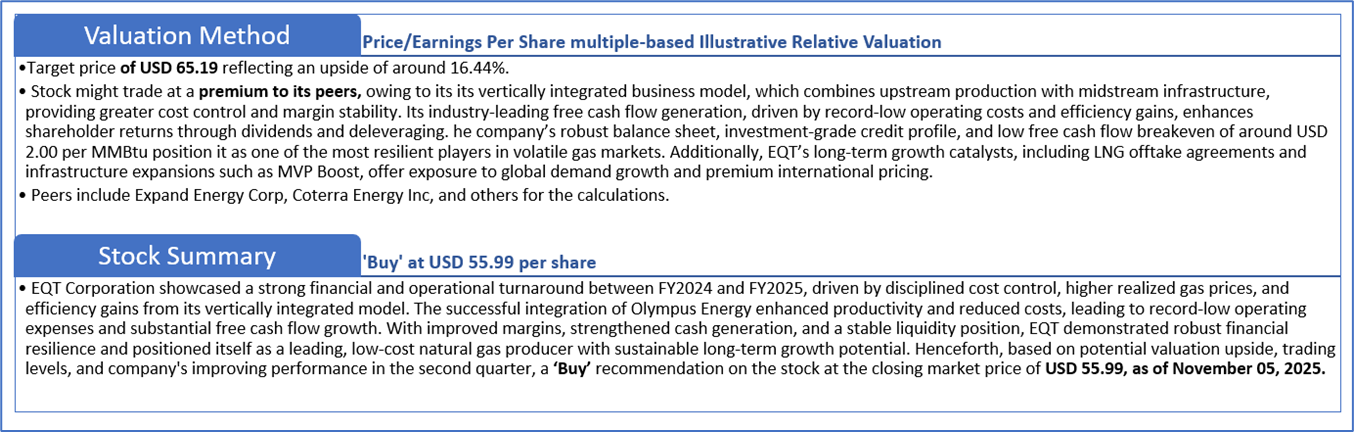
4.2 Fundamental Valuation
Valuation Methodology: Price/Earnings Multiple Based Relative Valuation
Markets are trading in a highly volatile zone currently due to certain macroeconomic issues and geopolitical tensions prevailing. Therefore, it is prudent to follow a cautious approach while investing.
Note 1: Past performance is not a reliable indicator of future performance.
Note 2: The reference date for all price data, currency, technical indicators, support, and resistance levels is November 05, 2025. The reference data in this report has been partly sourced from REFINITIV.
Note 3: Investment decisions should be made depending on an individual's appetite for upside potential, risks, holding duration, and any previous holdings. An 'Exit' from the stock can be considered if the Target Price mentioned as per the Valuation and or the technical levels provided has been achieved and is subject to the factors discussed above.
Note 4: The report publishing date is as per the Pacific Time Zone.
Technical Indicators Defined: -
Support: A level at which the stock prices tend to find support if they are falling, and a downtrend may take a pause backed by demand or buying interest. Support 1 refers to the nearby support level for the stock and if the price breaches the level, then Support 2 may act as the crucial support level for the stock.
Resistance: A level at which the stock prices tend to find resistance when they are rising, and an uptrend may take a pause due to profit booking or selling interest. Resistance 1 refers to the nearby resistance level for the stock and if the price surpasses the level, then Resistance 2 may act as the crucial resistance level for the stock.
Stop-loss: It is a level to protect against further losses in case of unfavorable movement in the stock prices.
Kalkine Equities LLC, with Delaware File Number 4697384, Foreign Qualification Registration in California File Number 202109211078, and Texas File Number 805521396, is authorized to provide general advice only. The information on https://kalkine.com/ does not take into account any of your investment objectives, financial situation or needs. You should consider the appropriateness of advice taking into account your own objectives, financial situation and needs and seek independent financial advice before making any financial decisions. The link to our Terms and Conditions and Privacy Policy has been provided for your reference. On the date of publishing the reports (mentioned on the website), employees and/or associates of Kalkine do not hold positions in any of the stocks covered on the website. These stocks can change any time and readers of the reports should not consider these stocks as advice or recommendations later.
Past performance is not a reliable indicator of future performance.
 Please wait processing your request...