

Kalkine’s Global Travel & Leisure Report offers a comprehensive view of the key companies and evolving trends across the travel value chain covering countries including US, Canada, Australia, UK, and New Zealand. This includes airlines, hospitality chains, digital travel platforms, as well as the rapidly growing leisure, entertainment, and gaming segments that are redefining the way people engage with travel experiences.

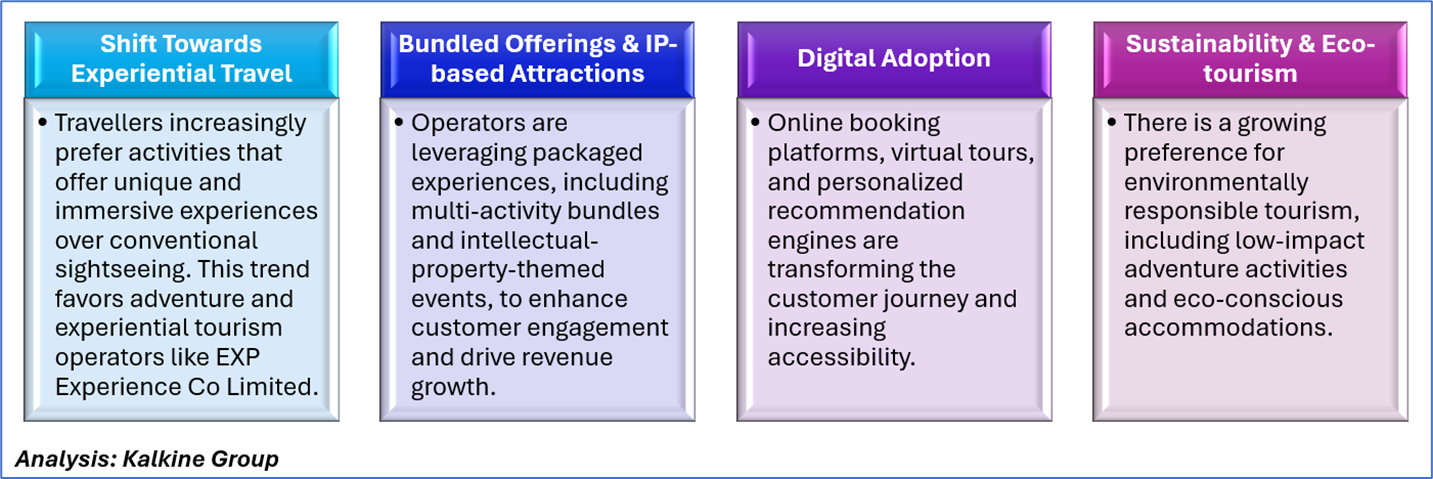
The Australian and New Zealand adventure tourism industry has demonstrated resilience and adaptability in the post-pandemic era. The sector encompasses a wide range of offerings, including adventure activities, eco-tourism, marine experiences, skydiving, and other immersive travel experiences. Recent data from the Australian Bureau of Statistics indicates a moderation in travel volumes, with international arrivals declining from 2.38 million in January 2025 to 1.81 million in August 2025, while departures slightly decreased from 2.03 million to 1.84 million over the same period, reflecting both seasonal fluctuations and the ongoing impact of economic conditions on consumer travel demand.
Looking ahead, the industry’s medium-term outlook remains positive. International arrivals are forecast to grow by more than 15% in 2024 compared with 2023 and are expected to increase by a further 41% over the following five years. Domestic tourism continues to show robust demand, with both domestic trip numbers and spending projected to rise steadily. Total short-term visitor expenditure in Australia covering both domestic and international visitors is expected to increase from $177 billion in 2024 to $223 billion by 2029, representing an average annual growth of 4.7%, outpacing expected inflation.
These projections, provided by Tourism Research Australia, highlight a resilient and expanding tourism sector, offering a favorable environment for adventure and experiential operators like EXP Experience Co Limited, driven by both returning international visitors and sustained domestic demand.
Source: Tourism Research Australia, Tourism Forecasts for Australia 2023–2028, Australian Government, Department of Industry, Science and Resources.
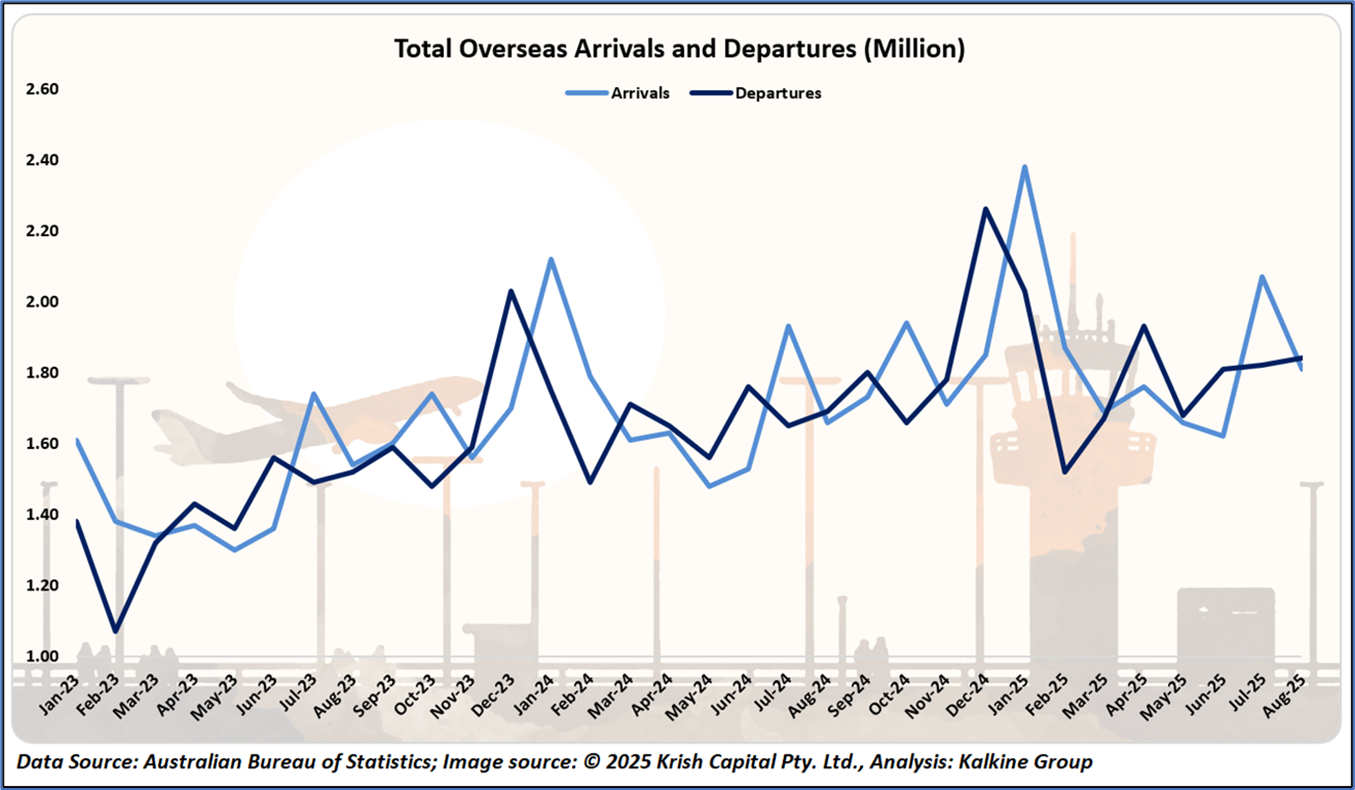


The outlook for the adventure tourism sector in Australia and New Zealand is cautiously optimistic. While international arrivals and departures show a gradual decline mid-year, domestic demand remains strong, providing a stable revenue base. Recovery is expected to be gradual but steady, supported by new attractions, diversified offerings, and targeted marketing strategies aimed at both domestic and international travelers.

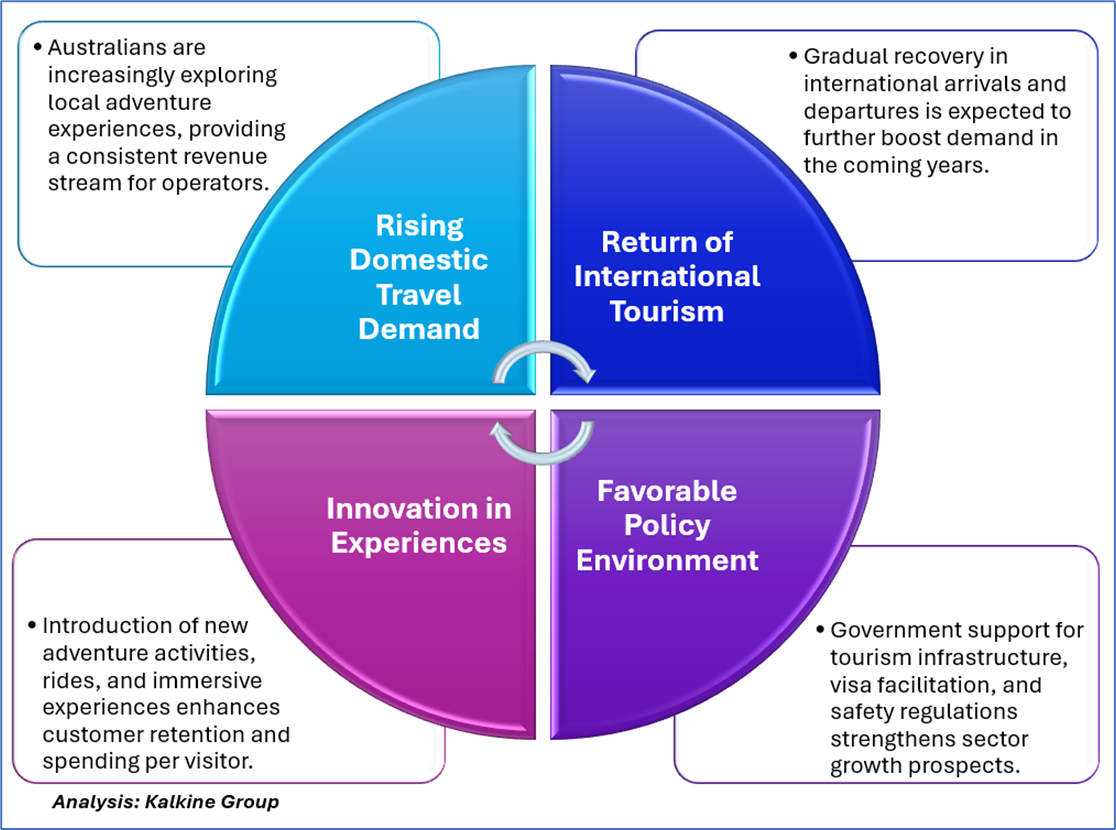
The Australian adventure tourism industry is supported by several factors that help maintain and expand visitor engagement, revenue, and operational efficiency:
Based on the above data, one ASX-listed Travel & Leisure stock has been identified to showcase the momentum.
Section 1: Company Overview and Fundamentals Insights
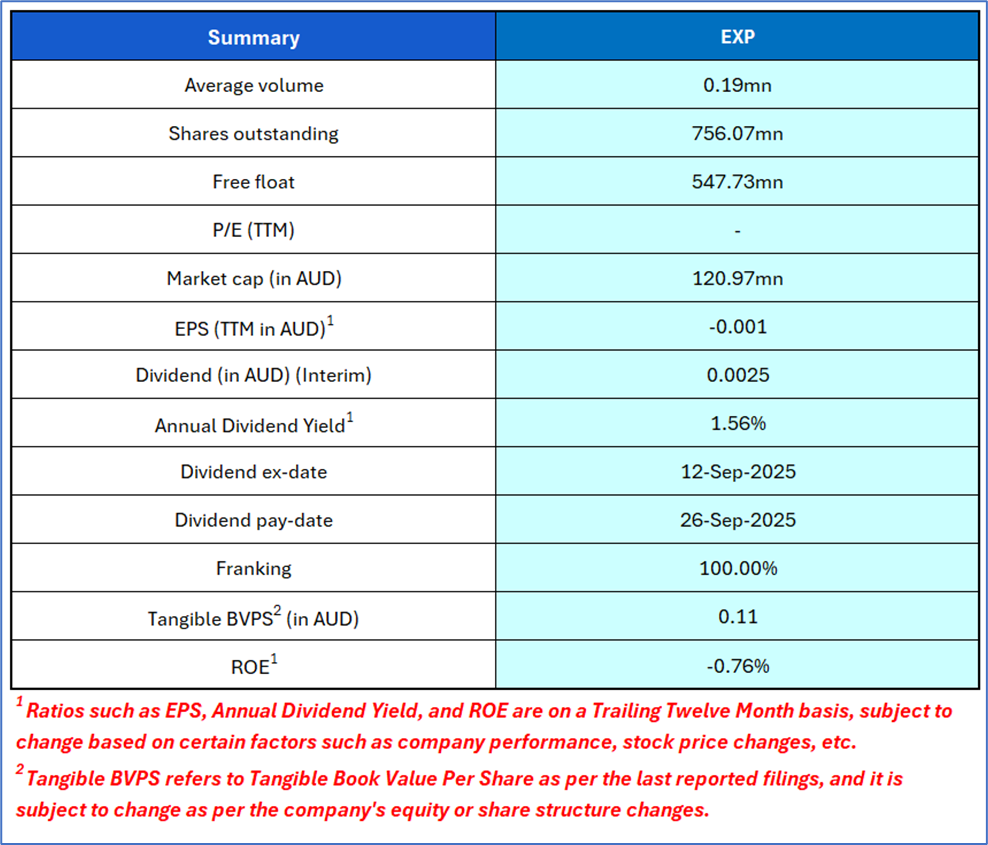
Company Overview: Experience Co Limited (ASX: EXP) an Australian adventure tourism firm, offers a variety of exciting activities such as tandem skydiving, indigenous cultural excursions, and vacations to the Great Barrier Reef, with several sites throughout Australia and New Zealand. Kalkine’s Global Travel & Leisure Report covers the Investment Highlights, Key Financial Metrics, Risks, and Technical Analysis along with the Valuation, Target Price, and Recommendation on the stock.
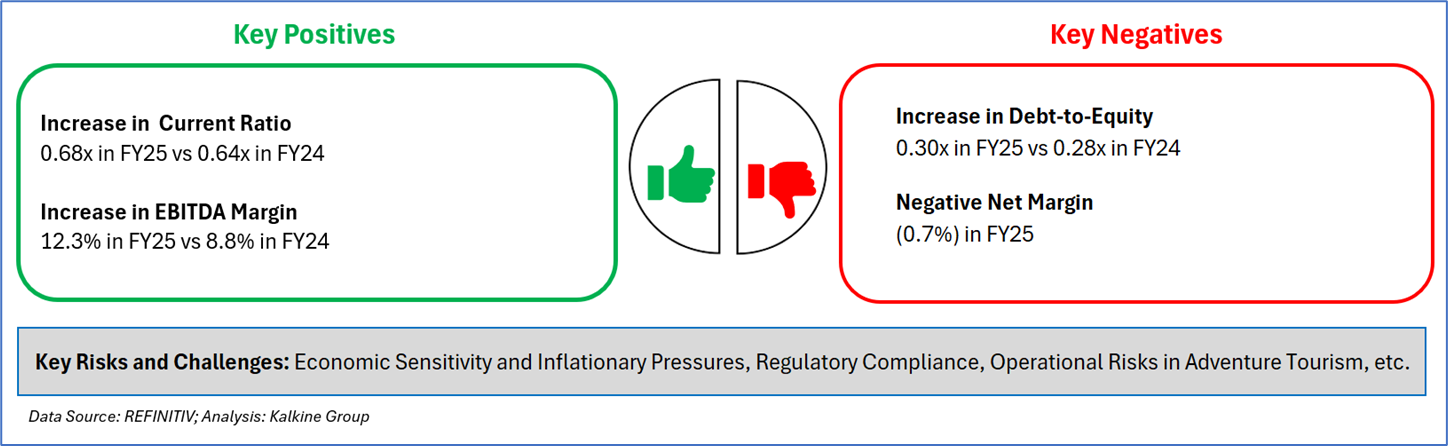
1.2 The Key Positives, Negatives, Investment Highlights, and Risks

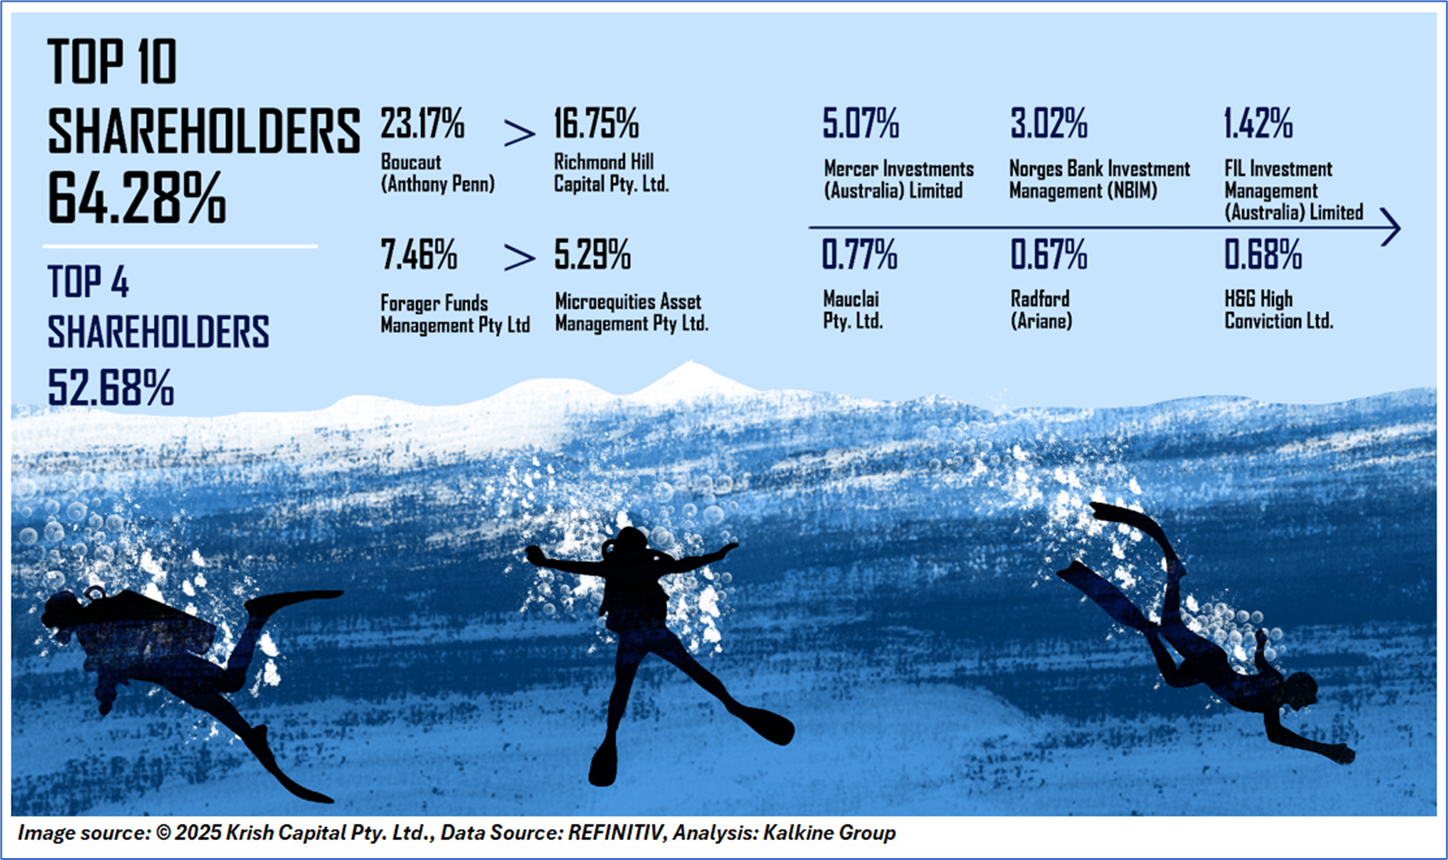
1.3 Top 10 Shareholders:
The top 10 shareholders together form ~64.28% of the total shareholding. Boucaut (Anthony Penn) and Richmond Hill Capital Pty. Ltd. hold maximum stakes of 23.17% and 16.75%, respectively.
1.4 Key Metrics: EXP’s EBITDA margin increased to 12.30% in FY25 compared to 8.8% in FY24. Below is captured other metrics:
Section 2: Business Updates, Financial and Operational Highlights
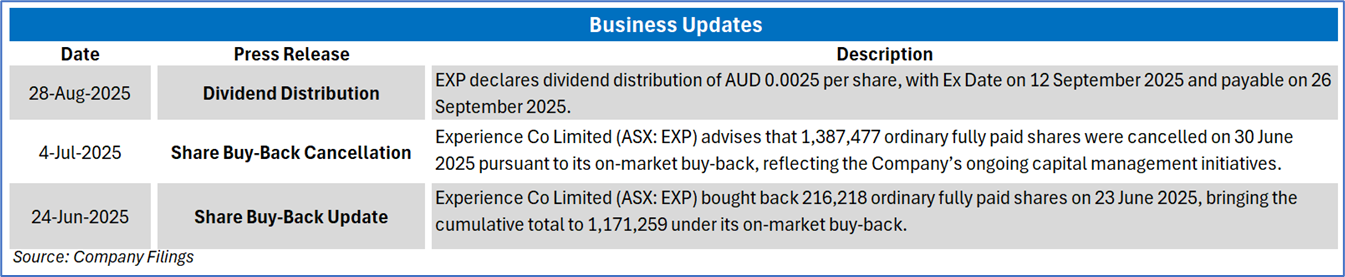
2.1 Recent Business Updates:
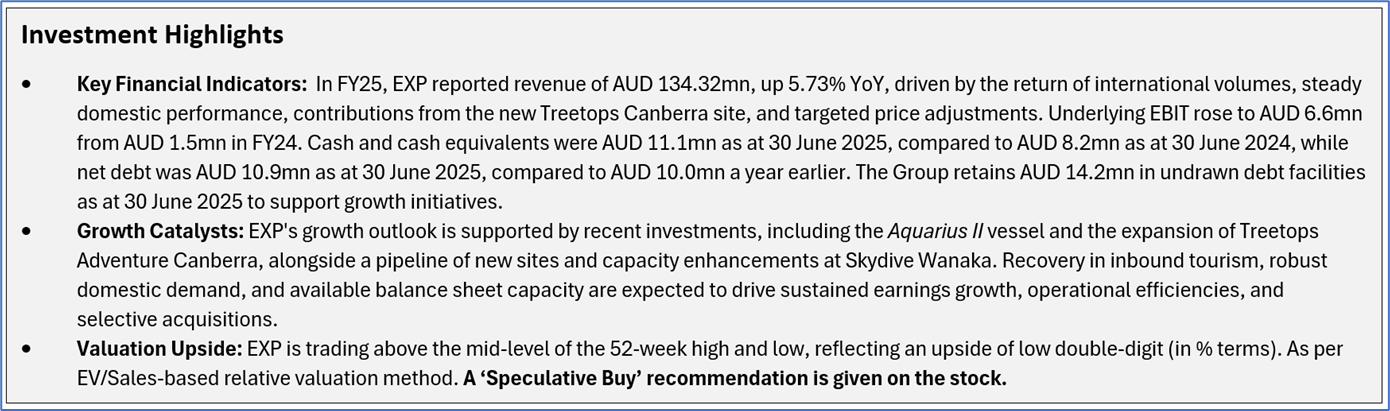
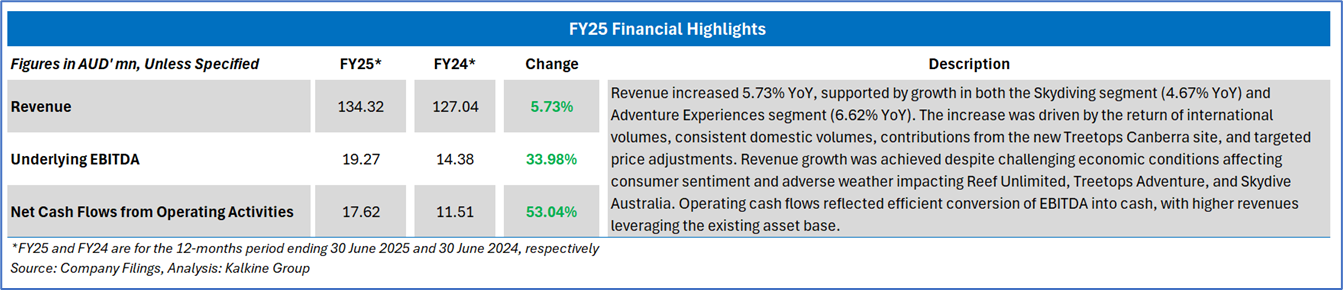
2.2 FY25 Results Highlights (for the 12 months ended 30 June 2025): Below mentioned are some key financial highlights:
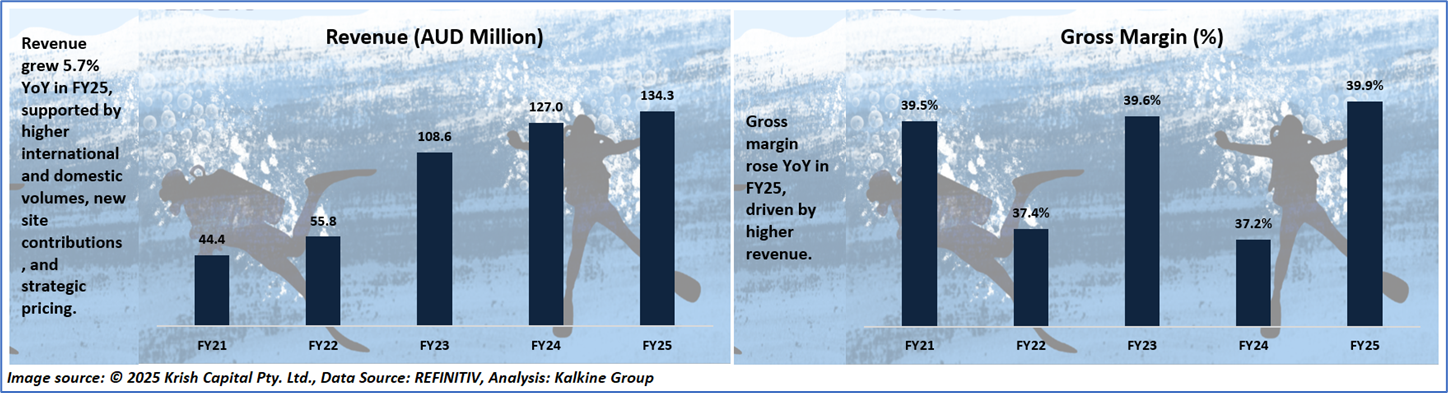
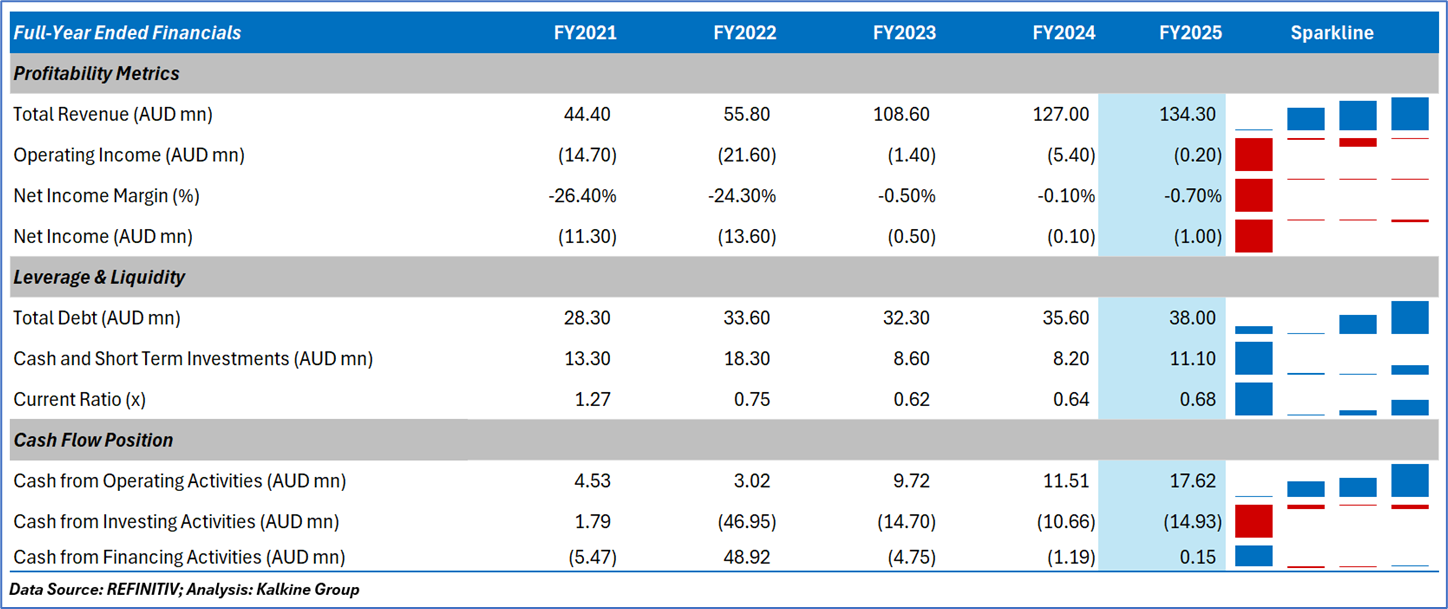
2.3 Historical Financial Trend
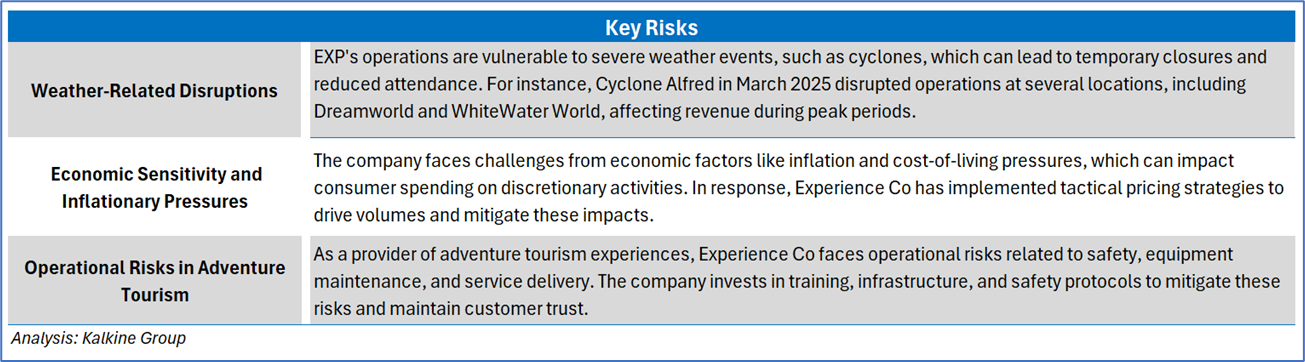
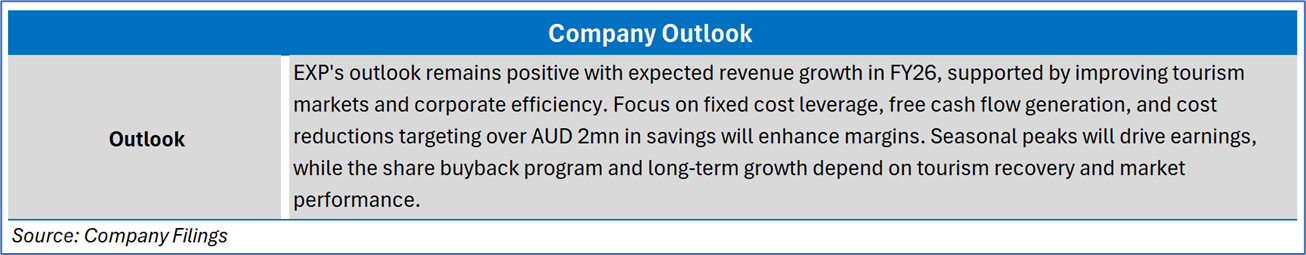
Section 3: Key Risks and Outlook:
Section 4: Stock Recommendation Summary
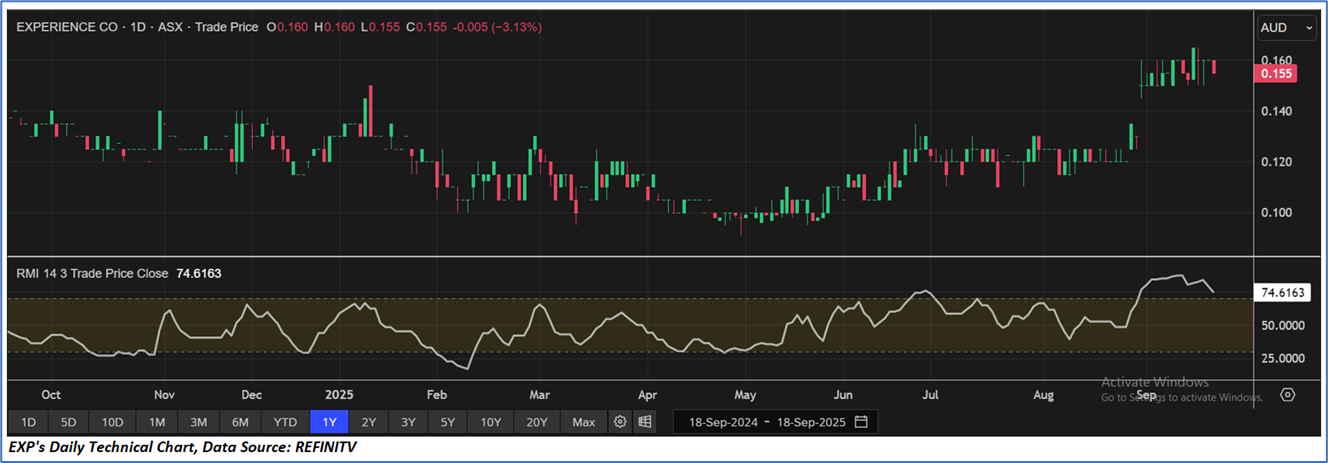
4.1 Price Performance and Technical Summary
The stock has increased by ~34.78% in the last six months, whereas over the past one year, stock has increased by ~12.73%. The stock has a 52-week low and 52-week high of AUD 0.091 and AUD 0.165, respectively, and is currently trading above the 52-week high-low average. EXP was last covered in a report dated ‘18 June 2025’.
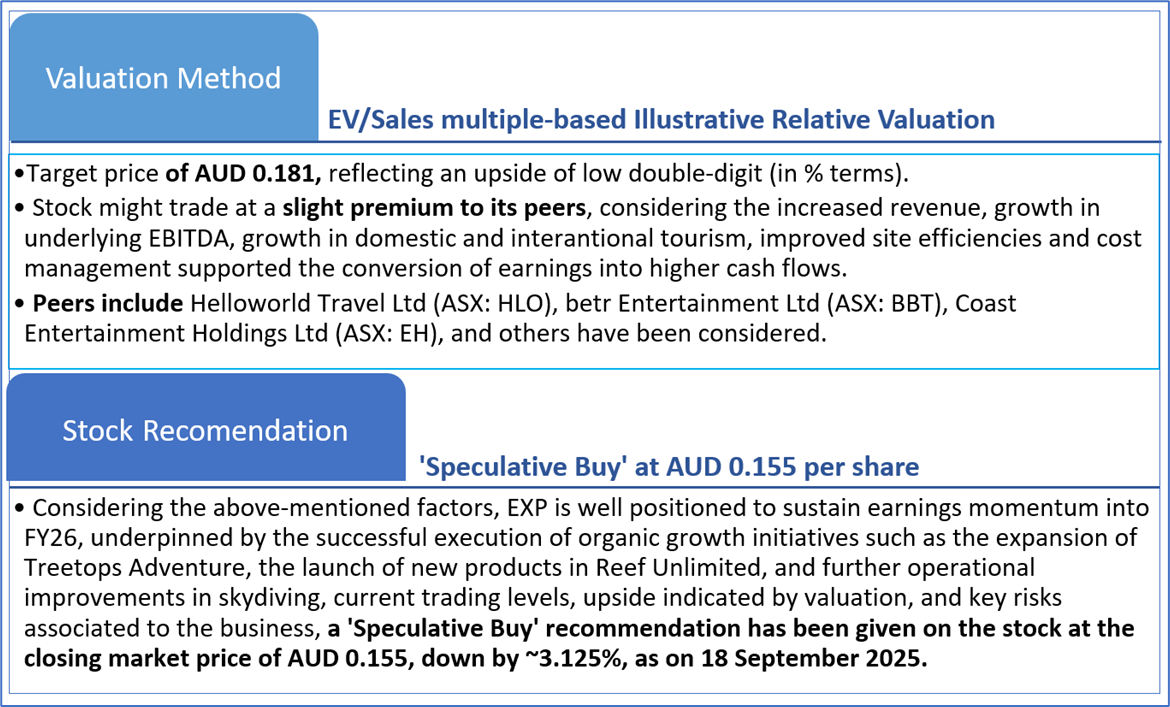
4.2 Fundamental Valuation and Stock Recommendation
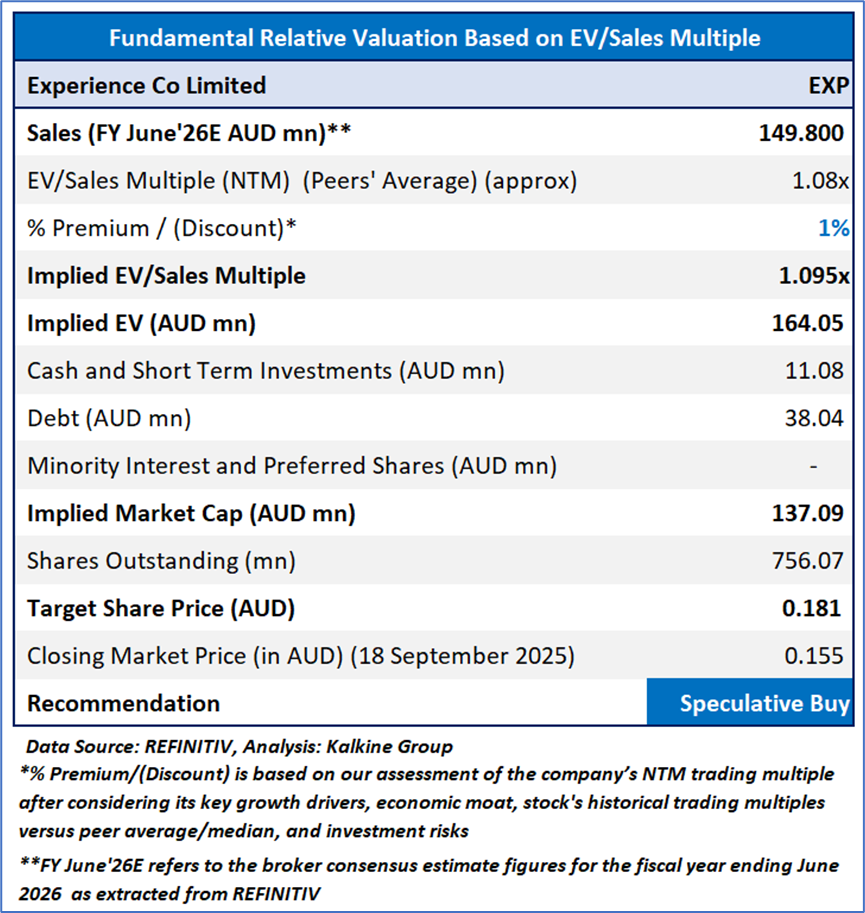
Markets are trading in a highly volatile zone currently due to certain macro-economic issues and geopolitical tensions prevailing. Therefore, it is prudent to follow a cautious approach while investing.
Note 1: Past performance is neither an indicator nor a guarantee of future performance.
Note 2: The reference date for all price data, currency, technical indicators, support, and resistance levels is 18 September 2025. The reference data in this report has been partly sourced from REFINITIV.
Note 3: Investment decisions should be made depending on an individual's appetite for upside potential, risks, holding duration, and any previous holdings. An 'Exit' from the stock can be considered if the Target Price mentioned as per the Valuation and or the technical levels provided have been achieved and is subject to the factors discussed above.
Note 4: Dividend Yield may vary as per the stock price movement.
Note 5: Kalkine reports are prepared based on the stock prices captured either from REFINITIV or Trading View. Typically, REFINITIV or Trading View may reflect stock prices with a delay which could be a lag of 25-30 minutes. There can be no assurance that future results or events will be consistent with the information provided in the report. The information is subject to change without any prior notice.
Technical Indicators Defined: -
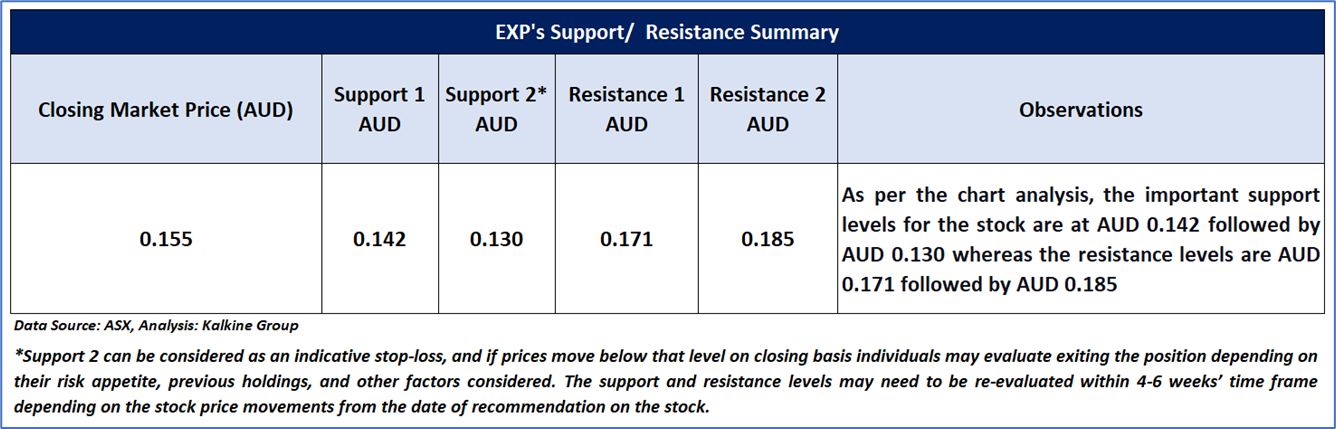
Support: A level at which the stock prices tend to find support if they are falling, and a downtrend may take a pause backed by demand or buying interest. Support 1 refers to the nearby support level for the stock and if the price breaches the level, then Support 2 may act as the crucial support level for the stock.
Resistance: A level at which the stock prices tend to find resistance when they are rising, and an uptrend may take a pause due to profit booking or selling interest. Resistance 1 refers to the nearby resistance level for the stock and if the price surpasses the level, then Resistance 2 may act as the crucial resistance level for the stock.
Stop-loss: It is a level to protect further losses in case of unfavourable movement in the stock prices.
Kalkine Equities LLC, with Delaware File Number 4697384, Foreign Qualification Registration in California File Number 202109211078, and Texas File Number 805521396, is authorized to provide general advice only. The information on https://kalkine.com/ does not take into account any of your investment objectives, financial situation or needs. You should consider the appropriateness of advice taking into account your own objectives, financial situation and needs and seek independent financial advice before making any financial decisions. The link to our Terms and Conditions and Privacy Policy has been provided for your reference. On the date of publishing the reports (mentioned on the website), employees and/or associates of Kalkine do not hold positions in any of the stocks covered on the website. These stocks can change any time and readers of the reports should not consider these stocks as advice or recommendations later.
Past performance is not a reliable indicator of future performance.
 Please wait processing your request...