
Section 1: Company Overview and Fundamentals
1.1 Company Overview:
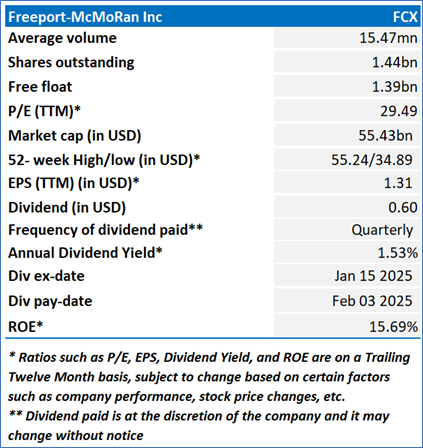
Freeport-McMoRan Inc. (NYSE: FCX) is an international mining company. The Company operates geographically diverse assets with significant proven and probable reserves of copper, gold and molybdenum. Its portfolio of assets includes the Grasberg minerals district in Indonesia, which is a copper and gold deposits, and significant mining operations in North America and South America, including the Morenci minerals district in Arizona and the Cerro Verde operation in Peru.
Kalkine’s Diversified Opportunities Report covers the Company Overview, Key positives & negatives, Investment summary, Key investment metrics, Top 10 shareholding, Business updates and insights into company recent financial results, Key Risks & Outlook, Price performance and technical summary, Target Price, and Recommendation on the stock.
Stock Performance:
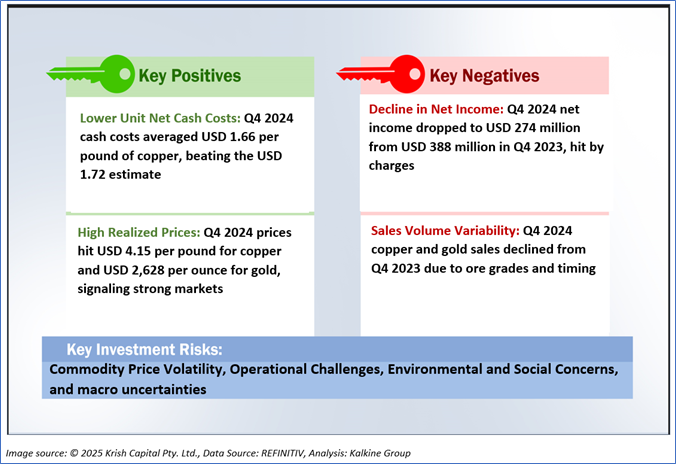
1.2 The Key Positives, Negatives, and Investment summary

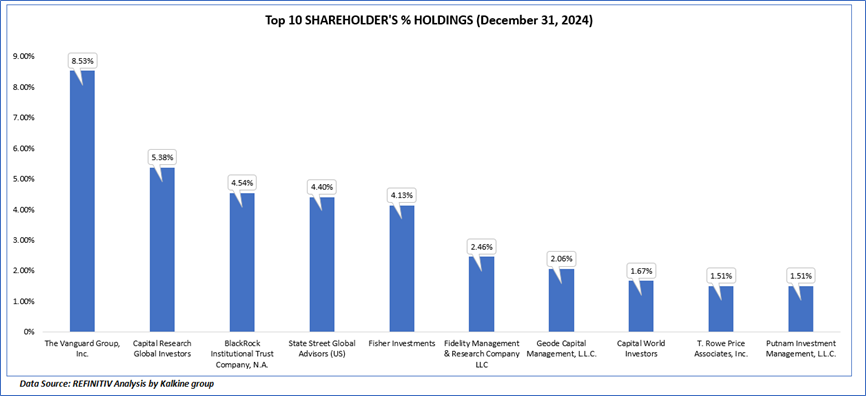
1.3 Top 10 shareholders:
The top 10 shareholders together form ~36.21% of the total shareholding, signifying concentrated shareholding. The Vanguard Group, Inc., and Capital Research Global Investors, are the biggest shareholders, holding the maximum stake in the company at 8.53% and 5.38%, respectively.
1.4 Key Metrics
Freeport-McMoRan Inc. (FCX) exhibited a mixed financial performance from 2020 to 2024, with revenue growing steadily from USD 14,198 million in 2020 to USD 25,455 million in 2024, reflecting robust demand for its copper, gold, and molybdenum operations. Gross profit fluctuated significantly, peaking at USD 8,919 million in 2021 with a high gross margin of 39.04%, but declining to USD 7,850 million in 2024 with a gross margin of 30.84%, indicating increased cost pressures or pricing challenges. Despite revenue growth, FCX’s gross margin trend shows a downward trajectory since 2021, suggesting potential operational or market-related challenges, though the company maintains strong revenue growth, particularly in 2024, amid favorable commodity market conditions.

Section 2: Business Updates and Corporate Business Highlights
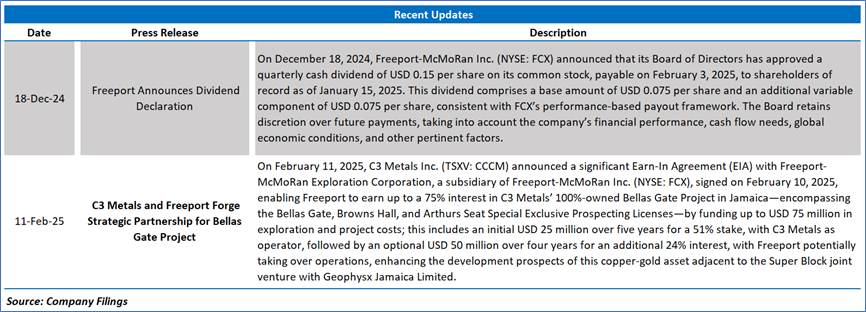
2.1 Recent Updates:
The below picture gives an overview of the recent updates:
2.2 Insights of FY24:

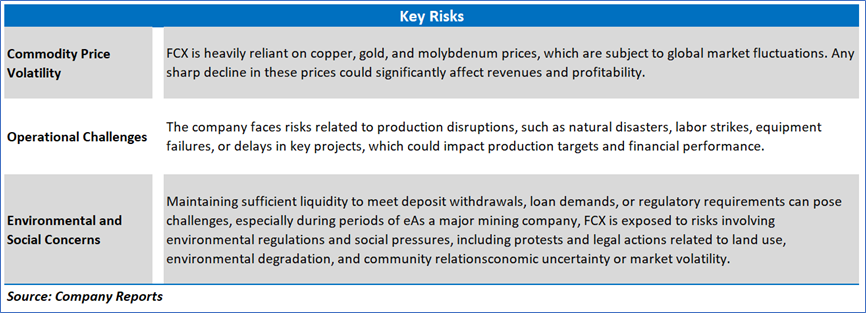
Section 3: Key Risks & Outlook
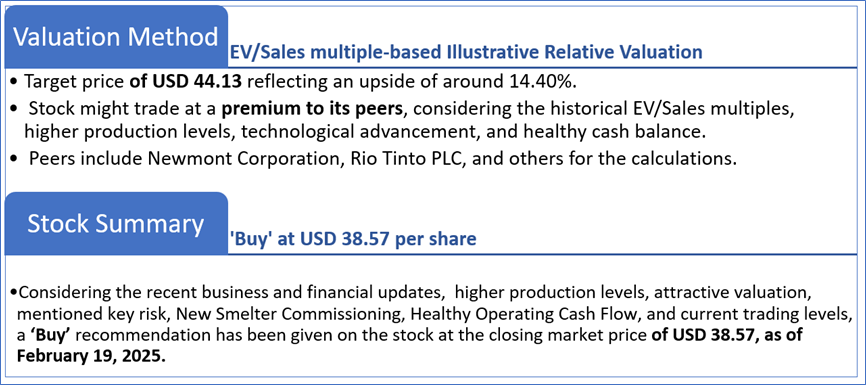
Section 4: Stock Recommendation Summary:
4.1 Price Performance and Technical Summary:
Stock Performance:


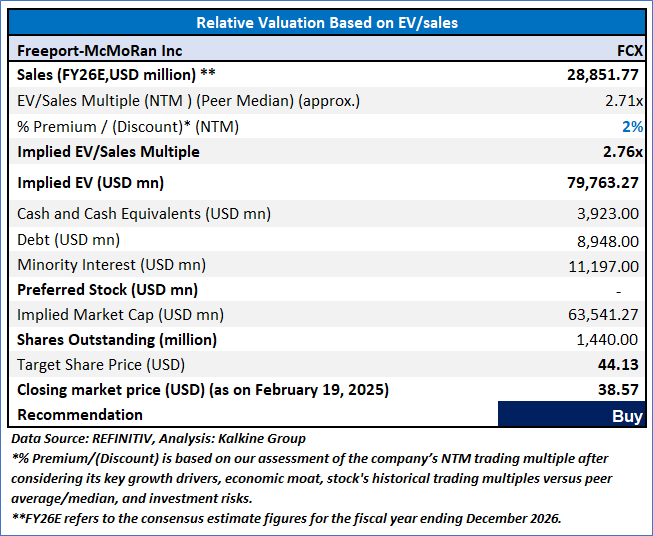
4.2 Fundamental Valuation
Valuation Methodology: EV/Sales Multiple Based Relative Valuation
Markets are trading in a highly volatile zone currently due to certain macroeconomic issues and geopolitical tensions prevailing. Therefore, it is prudent to follow a cautious approach while investing.
Note 1: Past performance is not a reliable indicator of future performance.
Note 2: The reference date for all price data, currency, technical indicators, support, and resistance levels is February 19, 2025. The reference data in this report has been partly sourced from REFINITIV.
Note 3: Investment decisions should be made depending on an individual's appetite for upside potential, risks, holding duration, and any previous holdings. An 'Exit' from the stock can be considered if the Target Price mentioned as per the Valuation and or the technical levels provided has been achieved and is subject to the factors discussed above.
Note 4: The report publishing date is as per the Pacific Time Zone.
Technical Indicators Defined: -
Support: A level at which the stock prices tend to find support if they are falling, and a downtrend may take a pause backed by demand or buying interest. Support 1 refers to the nearby support level for the stock and if the price breaches the level, then Support 2 may act as the crucial support level for the stock.
Resistance: A level at which the stock prices tend to find resistance when they are rising, and an uptrend may take a pause due to profit booking or selling interest. Resistance 1 refers to the nearby resistance level for the stock and if the price surpasses the level, then Resistance 2 may act as the crucial resistance level for the stock.
Stop-loss: It is a level to protect against further losses in case of unfavorable movement in the stock prices.
Kalkine Equities LLC, with Delaware File Number 4697384, Foreign Qualification Registration in California File Number 202109211078, and Texas File Number 805521396, is authorized to provide general advice only. The information on https://kalkine.com/ does not take into account any of your investment objectives, financial situation or needs. You should consider the appropriateness of advice taking into account your own objectives, financial situation and needs and seek independent financial advice before making any financial decisions. The link to our Terms and Conditions and Privacy Policy has been provided for your reference. On the date of publishing the reports (mentioned on the website), employees and/or associates of Kalkine do not hold positions in any of the stocks covered on the website. These stocks can change any time and readers of the reports should not consider these stocks as advice or recommendations later.
Past performance is not a reliable indicator of future performance.
 Please wait processing your request...