
Section 1: Company Overview and Fundamentals
1.1 Company Overview:
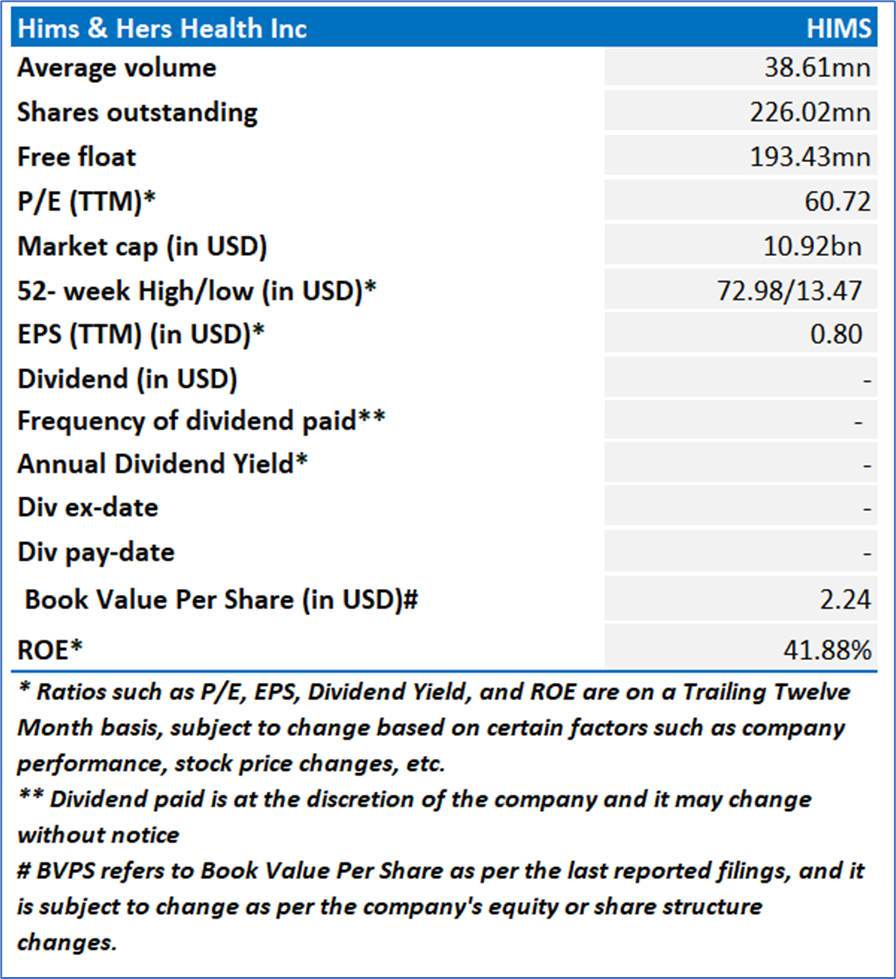
Hims & Hers Health, Inc. (NYSE: HIMS) provides a consumer-first platform, which helps customers to fulfill their health and wellness needs. Its platform includes access to a provider network, a clinically focused electronic medical record system, digital prescriptions, cloud pharmacy fulfillment, and personalization capabilities. Its digital platform enables access to treatments for a range of chronic conditions, including those related to sexual health, hair loss, dermatology, mental health, and weight loss.
Kalkine’s Diversified Opportunities Report covers the Company Overview, Key positives & negatives, Investment summary, Key investment metrics, Top 10 shareholding, Business updates and insights into company recent financial results, Key Risks & Outlook, Price performance and technical summary, Target Price, and Recommendation on the stock.
Stock Performance:
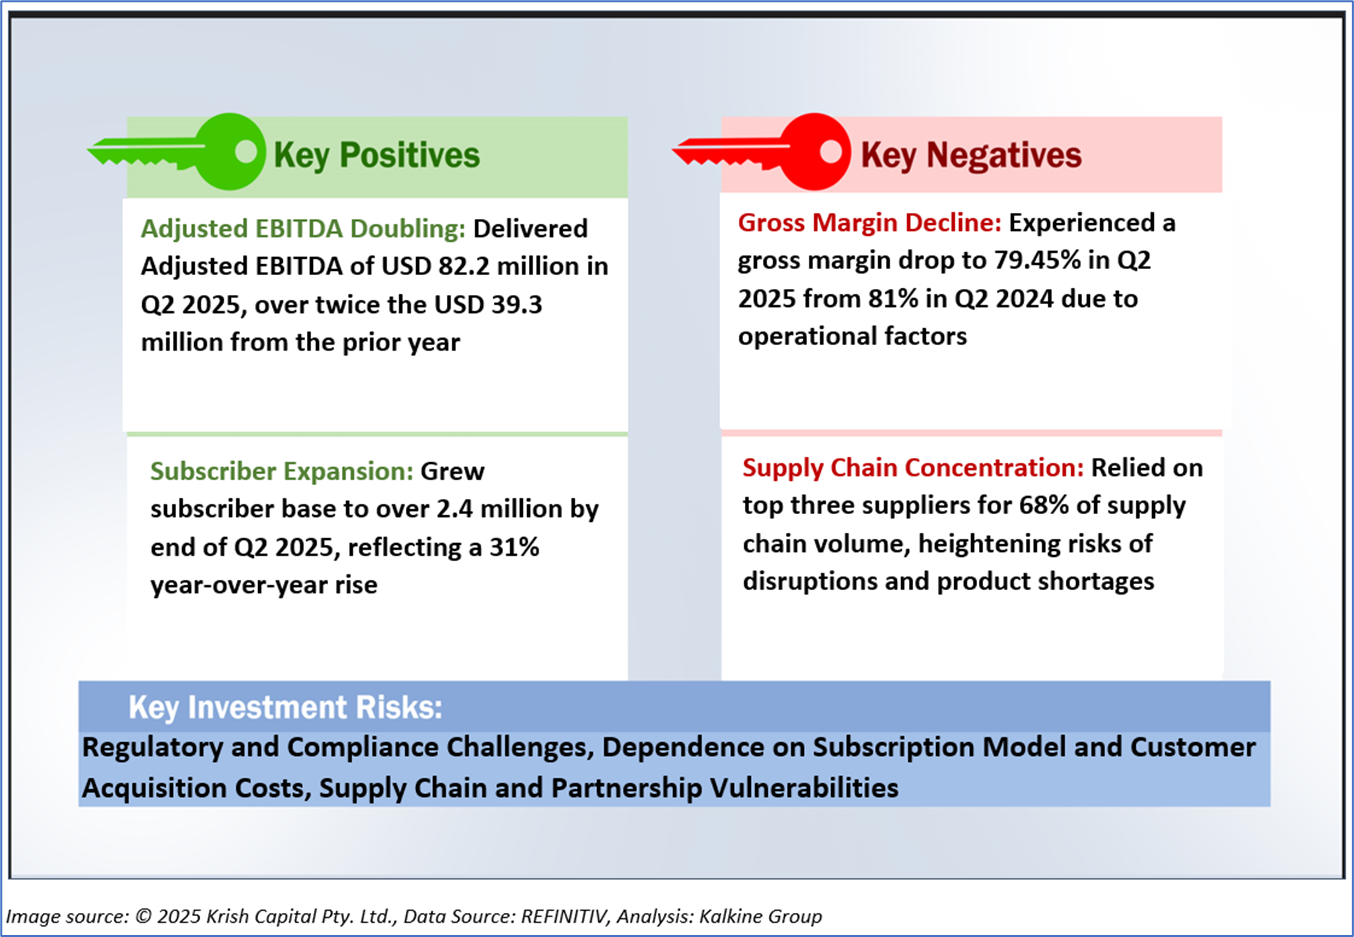
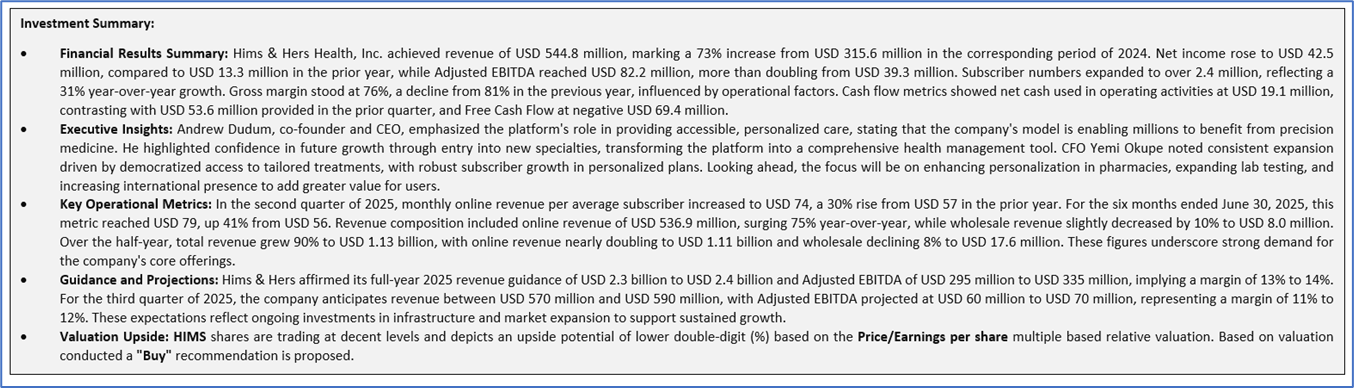
1.2 The Key Positives, Negatives, and Investment summary
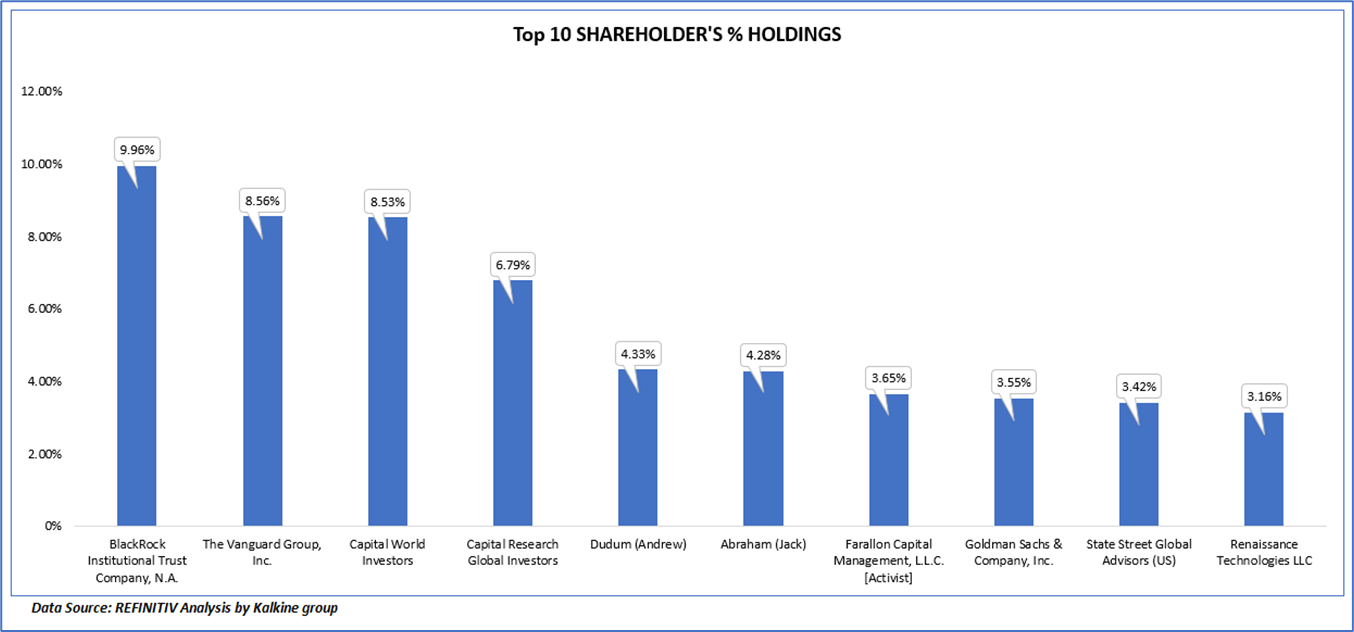
1.3 Top 10 shareholders:
The top 10 shareholders together form ~56.23% of the total shareholding, signifying concentrated shareholding. BlackRock Institutional Trust Company, N.A. and The Vanguard Group, Inc. are the biggest shareholders, holding the maximum stake in the company at 9.96% and 9.38%, respectively.
1.4 Key Metrics:
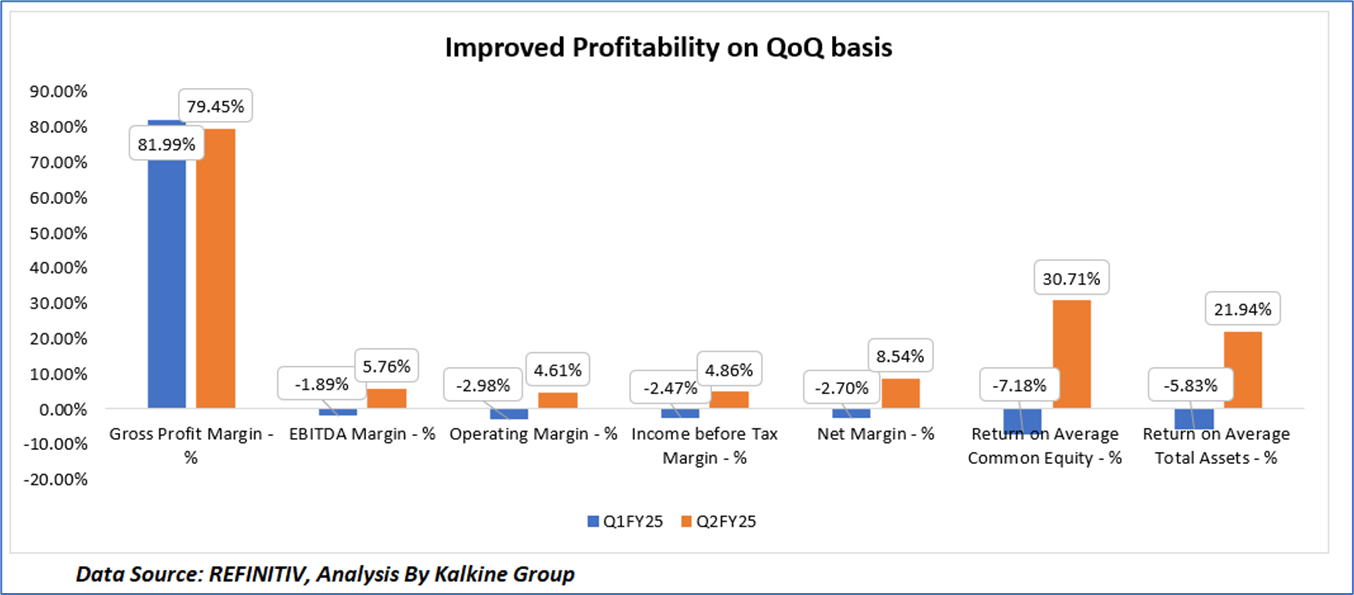
Hims & Hers Health, Inc. exhibited substantial sequential enhancement in financial performance from Q1 FY25 to Q2 FY25, evidenced by a transition from negative to positive margins in most profitability indicators, although gross profit margin modestly decreased from 81.99% to 79.45%, potentially attributable to elevated costs from rapid subscriber scaling and personalized care initiatives. EBITDA margin improved from -1.89% to 5.76%, operating margin shifted from -2.98% to 4.61%, income before tax margin rose from -2.47% to 4.86%, and net margin experienced a notable upswing from -2.70% to 8.54%, collectively reflecting stronger operational efficiency, revenue diversification through a 31% subscriber growth to over 2.4 million, and effective cost controls amid surging demand for its telehealth services.
Return on average common equity dramatically reversed from -7.18% to 30.71%, and return on average total assets advanced from -5.83% to 21.94%, indicating superior capital efficiency and value generation for shareholders, bolstered by the platform's focus on precision medicine; however, sustained investments in infrastructure like pharmacy enhancements and global expansion may exert downward pressure on margins if revenue acceleration does not keep pace.
Section 2: Business Updates and Corporate Business Highlights
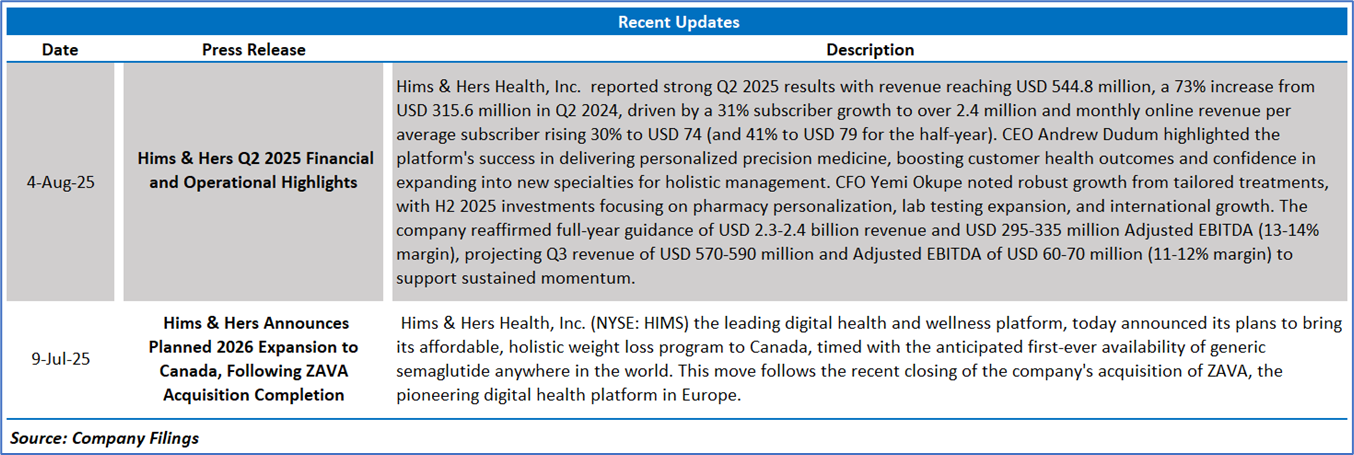
2.1 Business Updates:
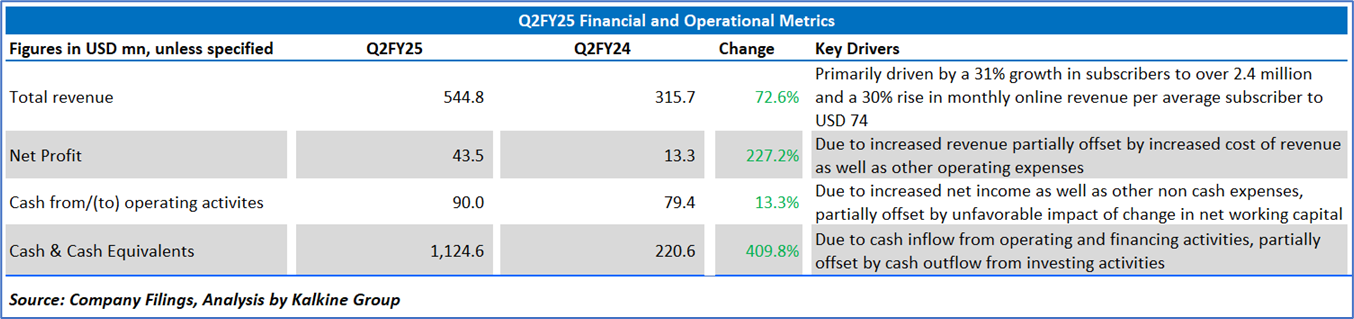
2.2 Insights of Q2FY25:
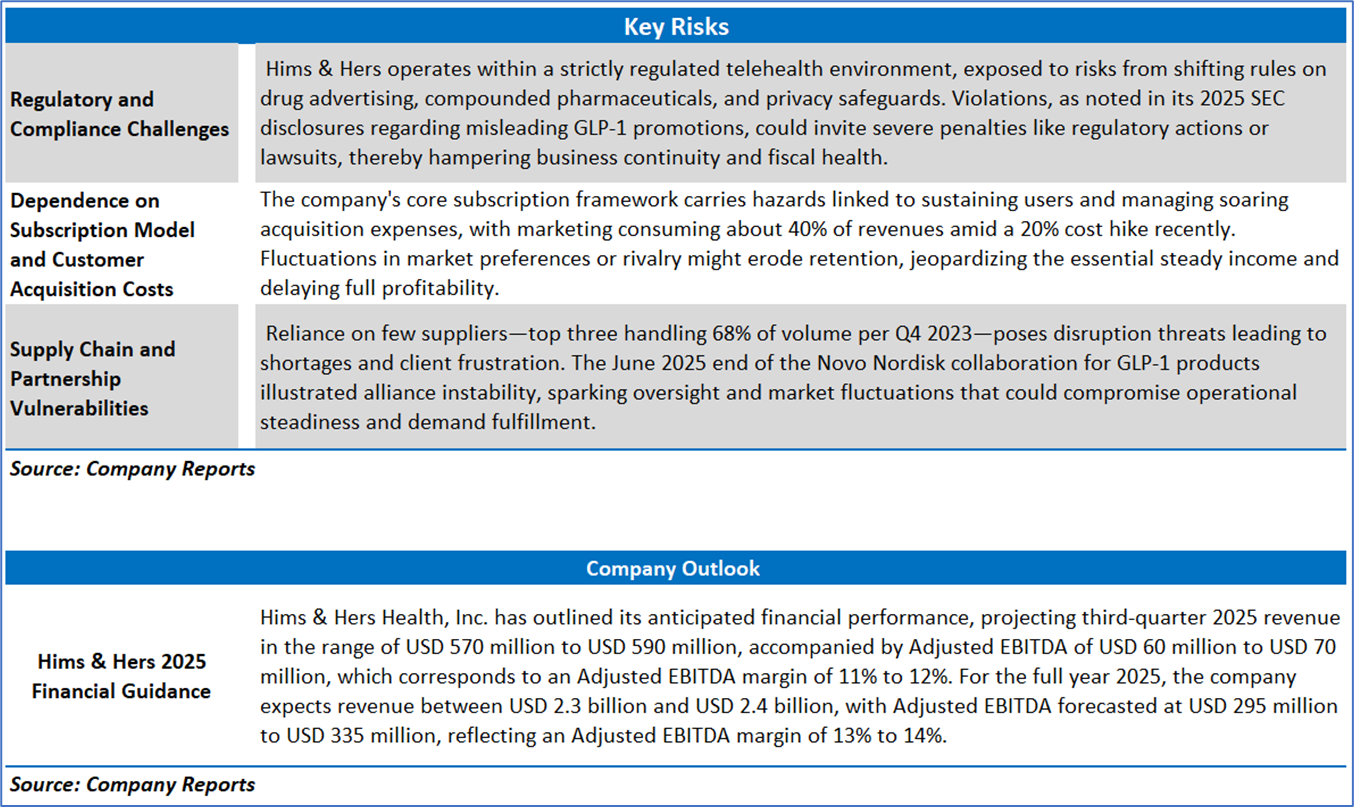
Section 3: Key Risks & Outlook
Section 4: Stock Recommendation Summary:
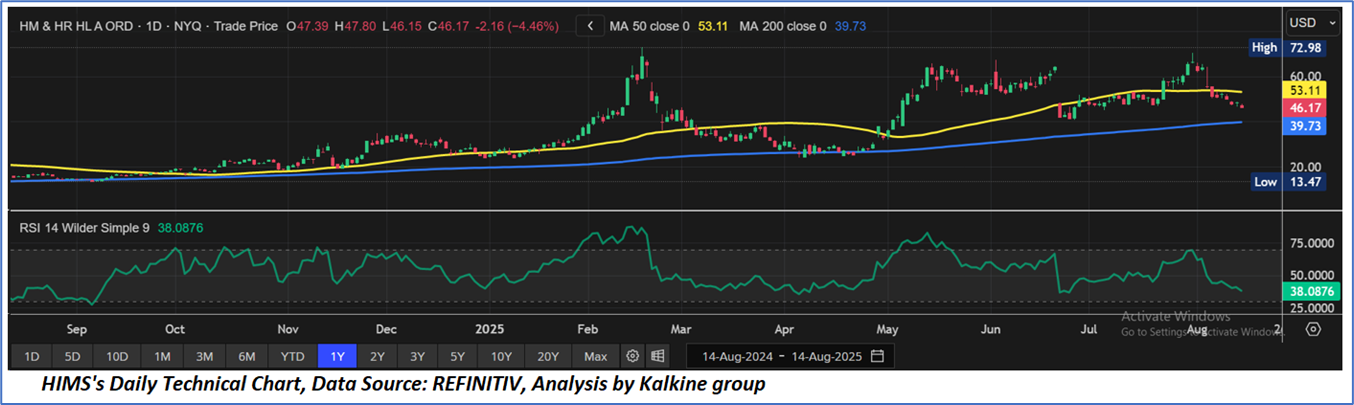
4.1 Price Performance and Technical Summary:
Stock Performance:
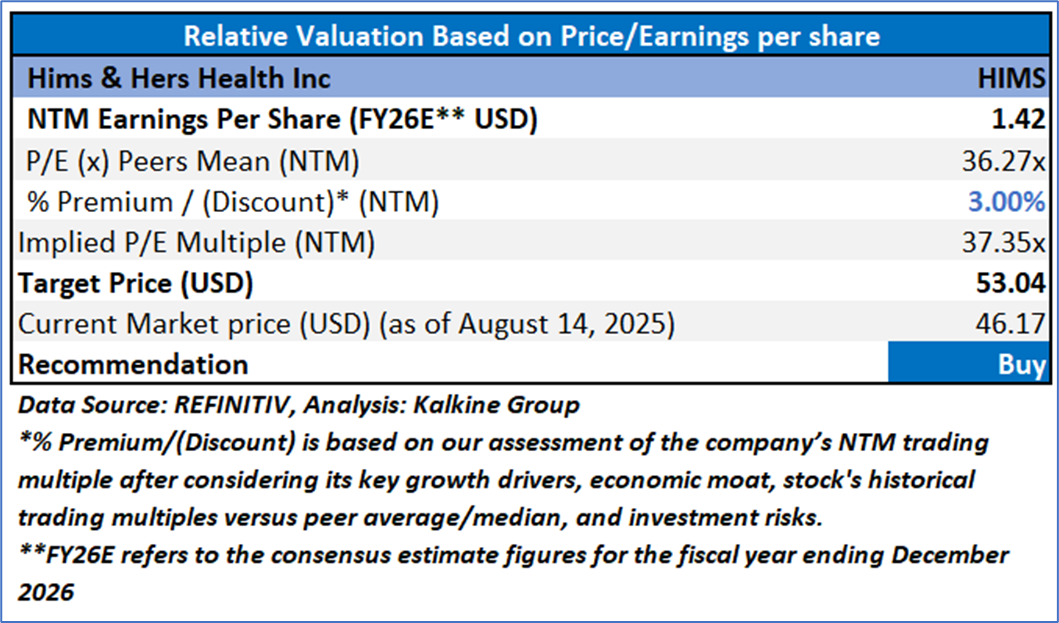
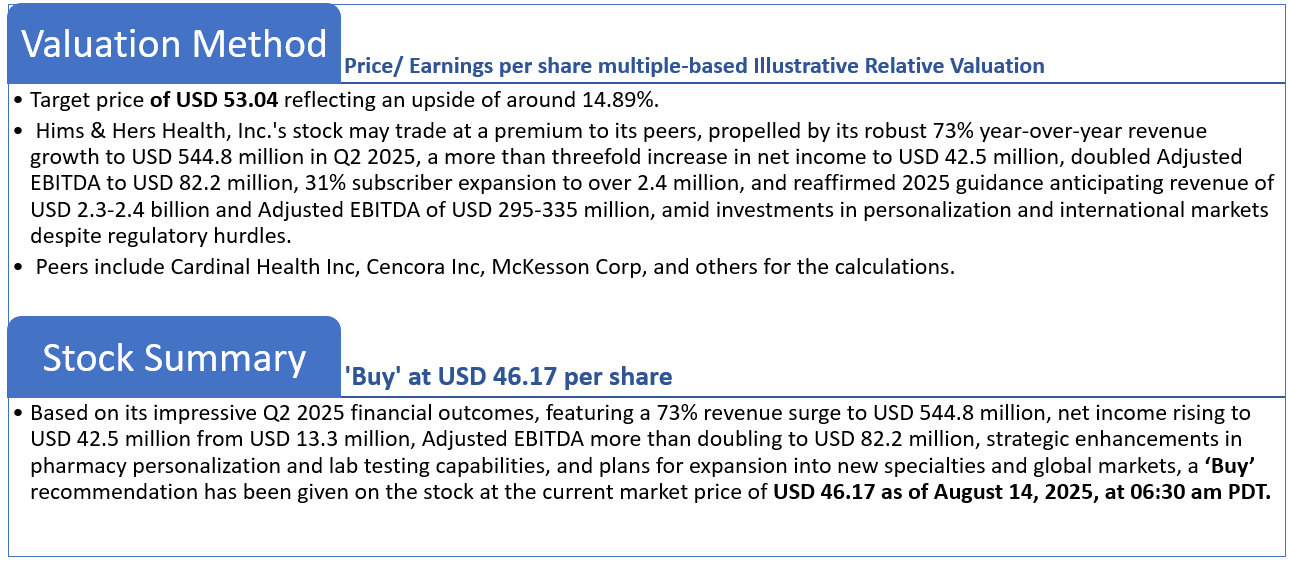
4.2 Fundamental Valuation
Valuation Methodology: Price/Earnings per share Multiple Based Relative Valuation
Markets are trading in a highly volatile zone currently due to certain macroeconomic issues and geopolitical tensions prevailing. Therefore, it is prudent to follow a cautious approach while investing.
Note 1: Past performance is not a reliable indicator of future performance.
Note 2: The reference date for all price data, currency, technical indicators, support, and resistance levels is August 14, 2025. The reference data in this report has been partly sourced from REFINITIV.
Note 3: Investment decisions should be made depending on an individual's appetite for upside potential, risks, holding duration, and any previous holdings. An 'Exit' from the stock can be considered if the Target Price mentioned as per the Valuation and or the technical levels provided has been achieved and is subject to the factors discussed above.
Note 4: The report publishing date is as per the Pacific Time Zone.
Technical Indicators Defined: -
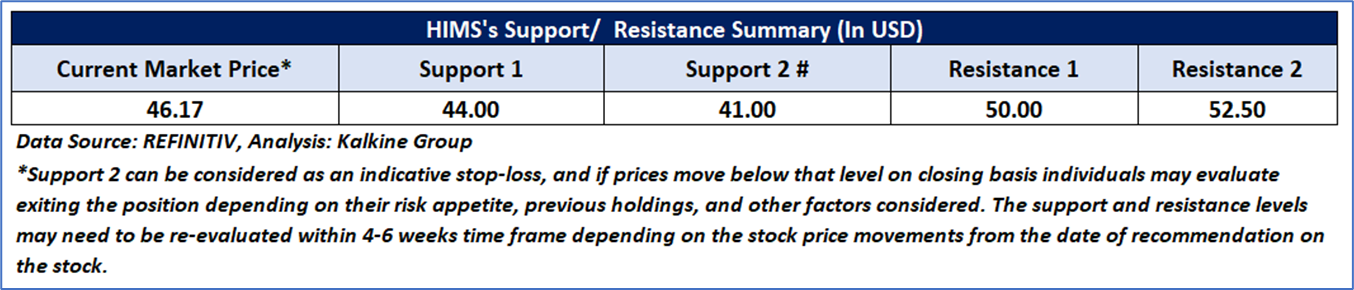
Support: A level at which the stock prices tend to find support if they are falling, and a downtrend may take a pause backed by demand or buying interest. Support 1 refers to the nearby support level for the stock and if the price breaches the level, then Support 2 may act as the crucial support level for the stock.
Resistance: A level at which the stock prices tend to find resistance when they are rising, and an uptrend may take a pause due to profit booking or selling interest. Resistance 1 refers to the nearby resistance level for the stock and if the price surpasses the level, then Resistance 2 may act as the crucial resistance level for the stock.
Stop-loss: It is a level to protect against further losses in case of unfavorable movement in the stock prices.
Kalkine Equities LLC, with Delaware File Number 4697384, Foreign Qualification Registration in California File Number 202109211078, and Texas File Number 805521396, is authorized to provide general advice only. The information on https://kalkine.com/ does not take into account any of your investment objectives, financial situation or needs. You should consider the appropriateness of advice taking into account your own objectives, financial situation and needs and seek independent financial advice before making any financial decisions. The link to our Terms and Conditions and Privacy Policy has been provided for your reference. On the date of publishing the reports (mentioned on the website), employees and/or associates of Kalkine do not hold positions in any of the stocks covered on the website. These stocks can change any time and readers of the reports should not consider these stocks as advice or recommendations later.
Past performance is not a reliable indicator of future performance.
 Please wait processing your request...