
Kalkine’s Global Travel & Leisure Report offers a comprehensive view of the key companies and evolving trends across the travel value chain covering countries including US, Canada, Australia, UK, and New Zealand. This includes airlines, hospitality chains, digital travel platforms, as well as the rapidly growing leisure, entertainment, and gaming segments that are redefining the way people engage with travel experiences.

Global Hotel and Resorts Market: A Dynamic Growth Trajectory:

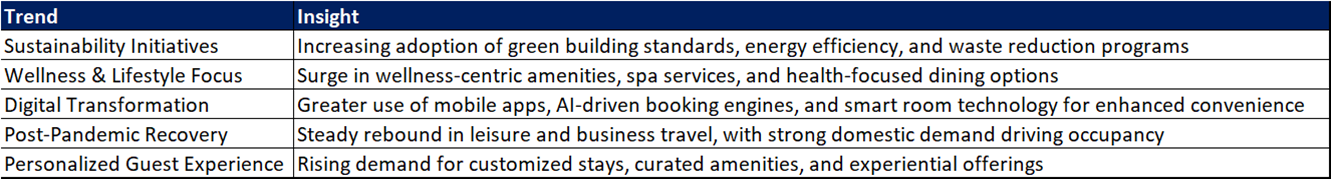

Between 2020 and 2025, the global hotel industry experienced a profound recovery from the pandemic’s disruptions, transitioning from crisis management to sustained profitability and growth. The period marked a structural shift toward efficiency, technology, and asset-light scalability — aligning strongly with IHG’s business model.
Kalkine’s Global Travel & Leisure Report covers the Investment Highlights, Key Financial Metrics, Risks, Technical Analysis along with the Valuation, Target Price, and Recommendation on InterContinental Hotels Group PLC (NYSE: IHG).
Section 1: Company Overview and Fundamentals Insights
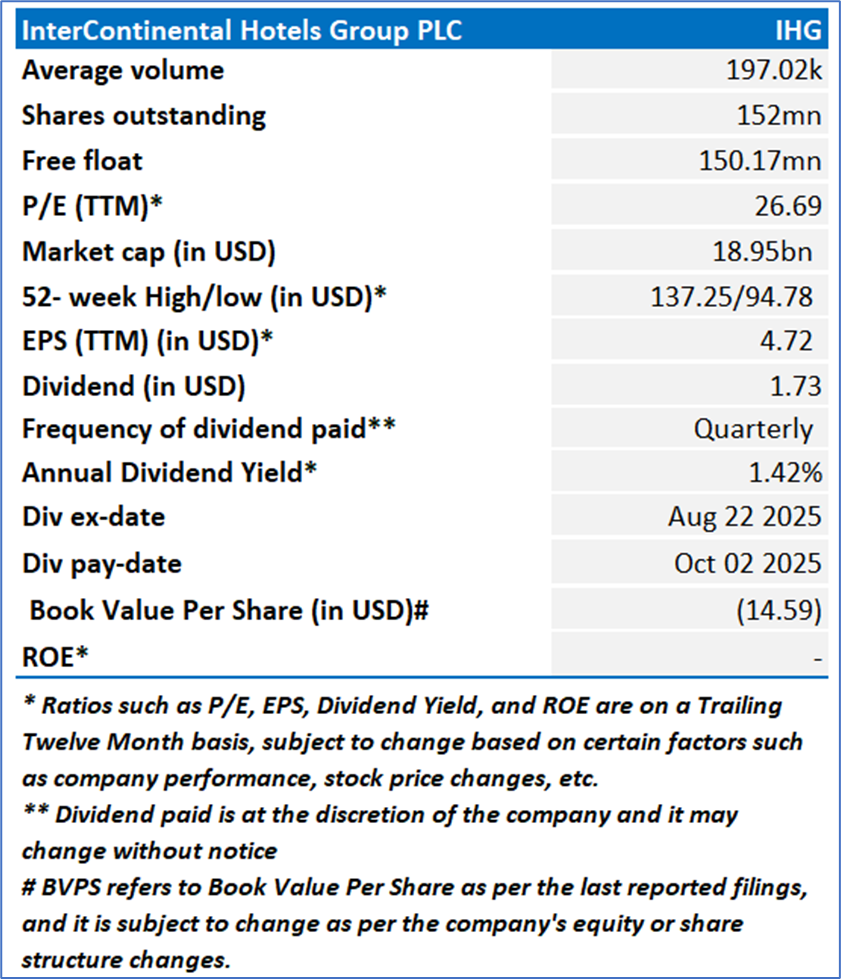
Company Overview: InterContinental Hotels Group PLC (NYSE: IHG) is a United Kingdom-based global hospitality company. The Company has a diverse portfolio of differentiated brands. With 20 hotel brands and IHG One Rewards, which is a hotel loyalty program, the Company has approximately 6,600 open hotels in more than 100 countries, and a development pipeline of over 2,200 properties.
Kalkine’s Global Travel and Leisure Report cover the Investment Highlights, Key Financial Metrics, Risks, and Technical Analysis along with the Valuation, Target Price, and Recommendation on the stock.
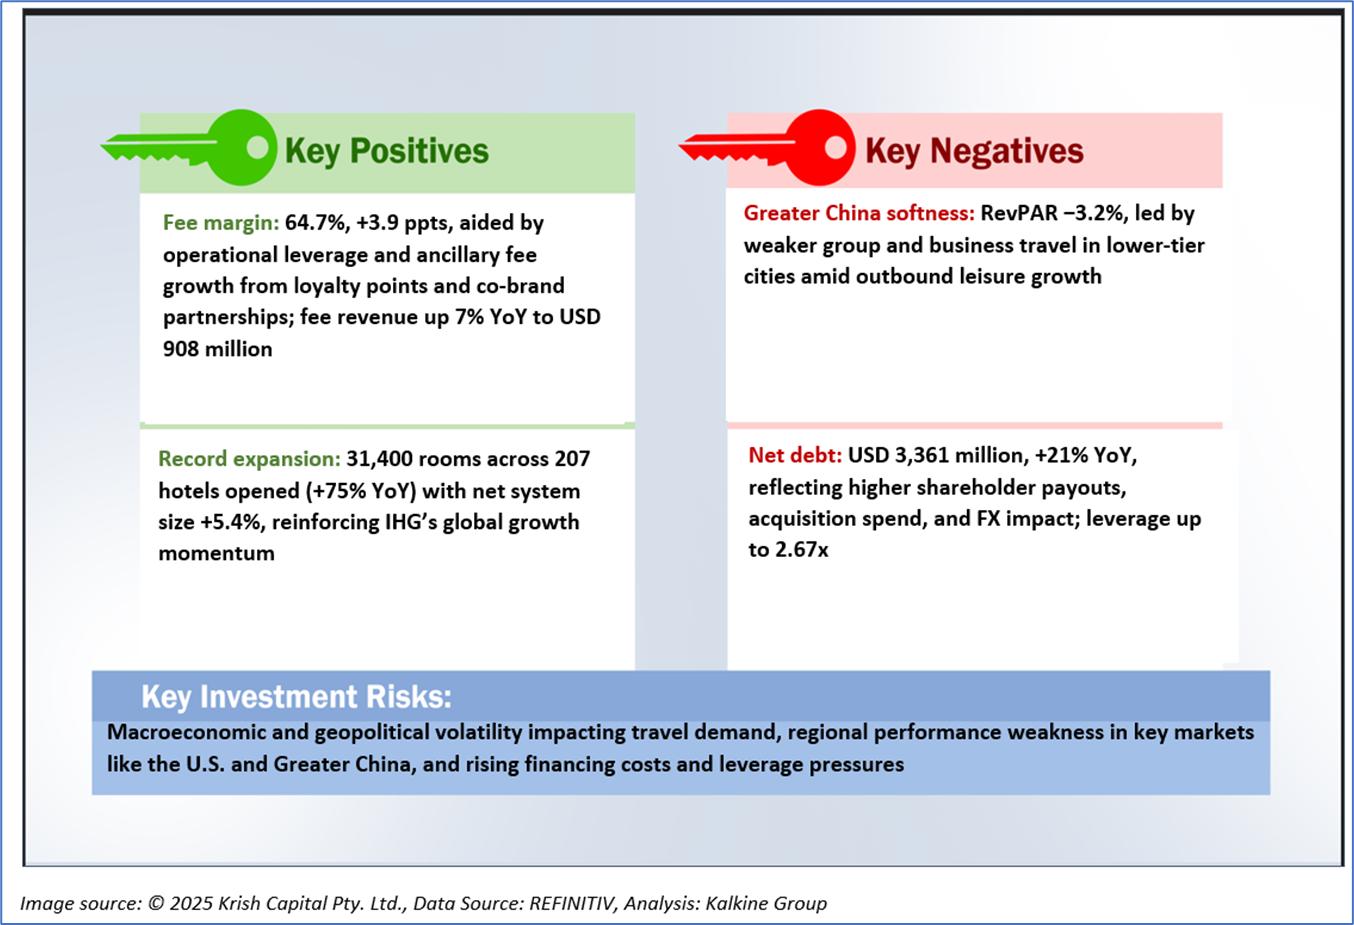
1.2 The Key Positives, Negatives, Investment Highlights, and Risks
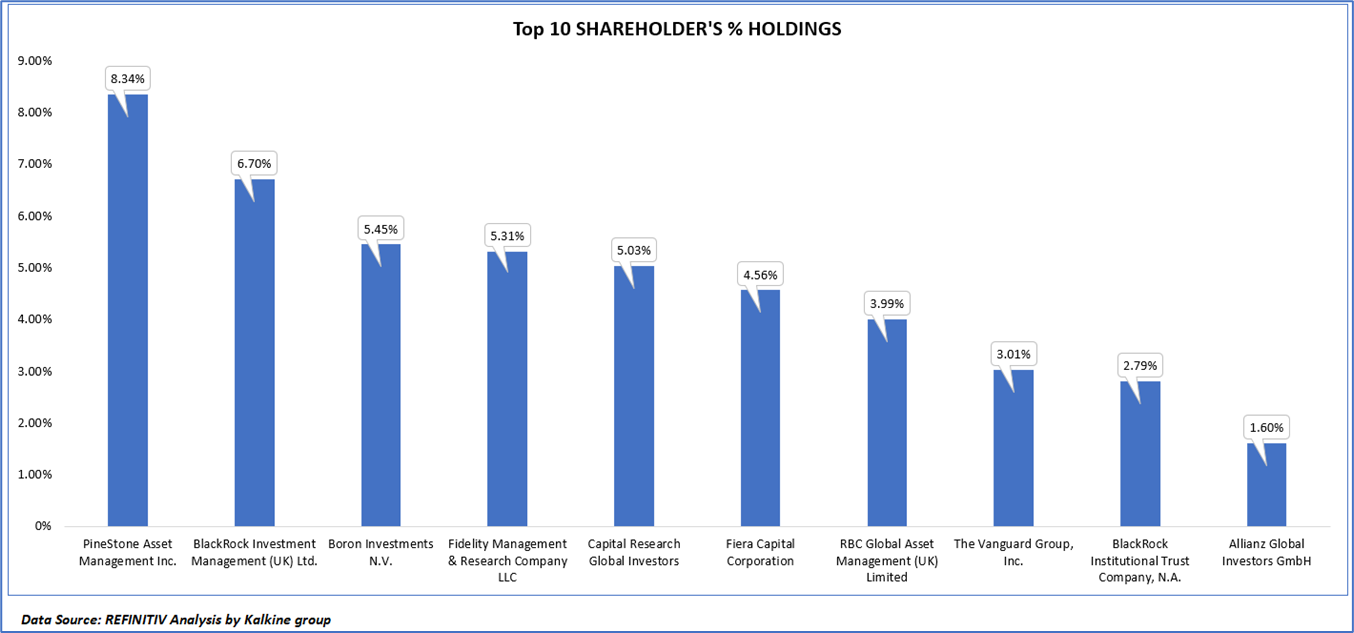
1.3 Top 10 Shareholders:
The top 10 shareholders together form ~46.79% of the total shareholding. PineStone Asset Management Inc. and BlackRock Investment Management (UK) Ltd. hold maximum stakes of 8.34% and 6.70%, respectively.
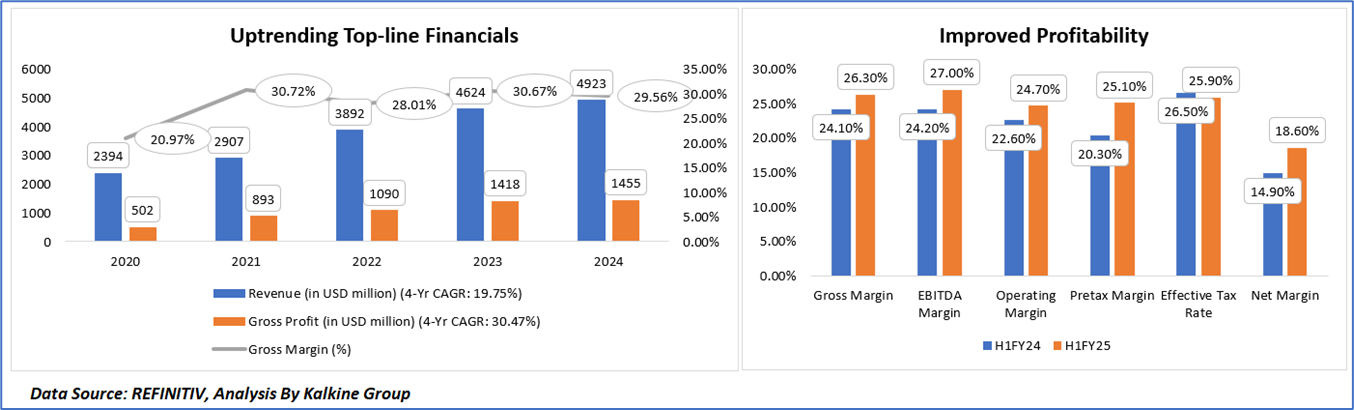
1.4 Key Metrics:
InterContinental Hotels Group (IHG) delivered a strong financial recovery between 2020 and 2024, with revenue rising from USD 2,394 million to USD 4,923 million at a CAGR of 19.75%, reflecting the post-pandemic rebound in global travel and the strength of its asset-light, fee-driven model. Gross profit grew even faster at a 30.47% CAGR, supported by improved cost efficiency and higher-margin fee income, leading to gross margin expansion from 20.97% to 29.56% over the period. The company’s profitability surge highlights its effective operational leverage, cost control, and growing contribution from management and franchising operations.
In the first half of 2025, IHG continued to enhance margins across all levels, driven by stronger pricing, cost optimization, and ancillary fee growth. Gross margin rose to 26.3%, while EBITDA and operating margins improved to 27.0% and 24.7%, respectively. Pretax margin expanded to 25.1%, reflecting disciplined expense management and solid revenue quality, while the net margin increased to 18.6% from 14.9%. The modest decline in the effective tax rate to 25.9% also supported bottom-line growth. Overall, IHG’s financial performance underscores a shift from recovery to sustained, high-quality profitability, backed by operational efficiency and balanced global growth.
Section 2: Business Updates, Financial and Operational Highlights
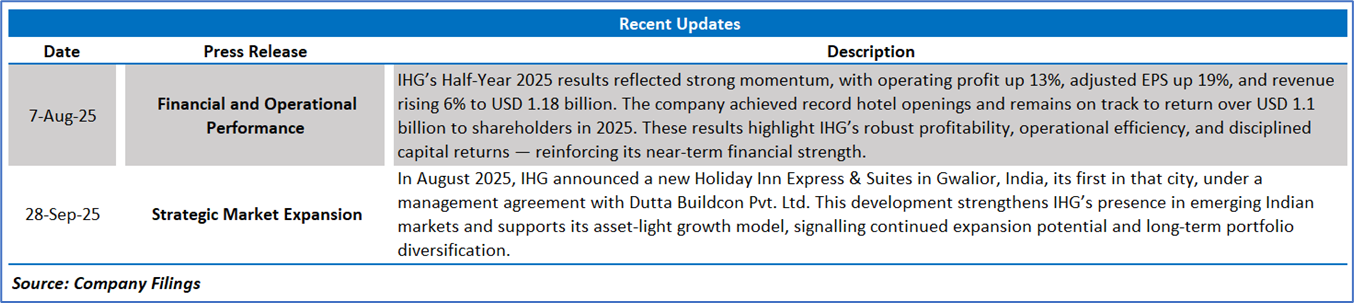
2.1 Recent Business Updates:
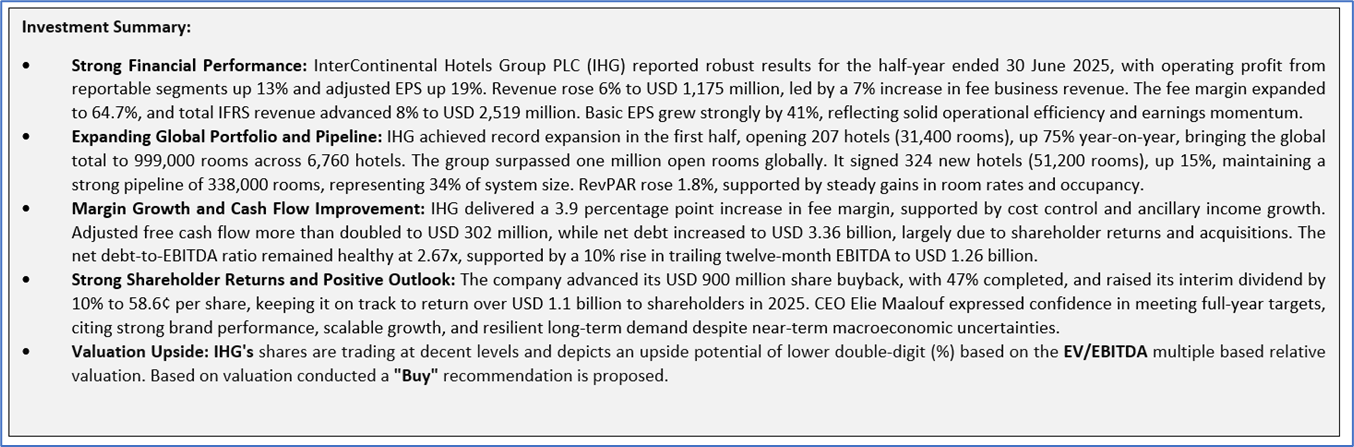
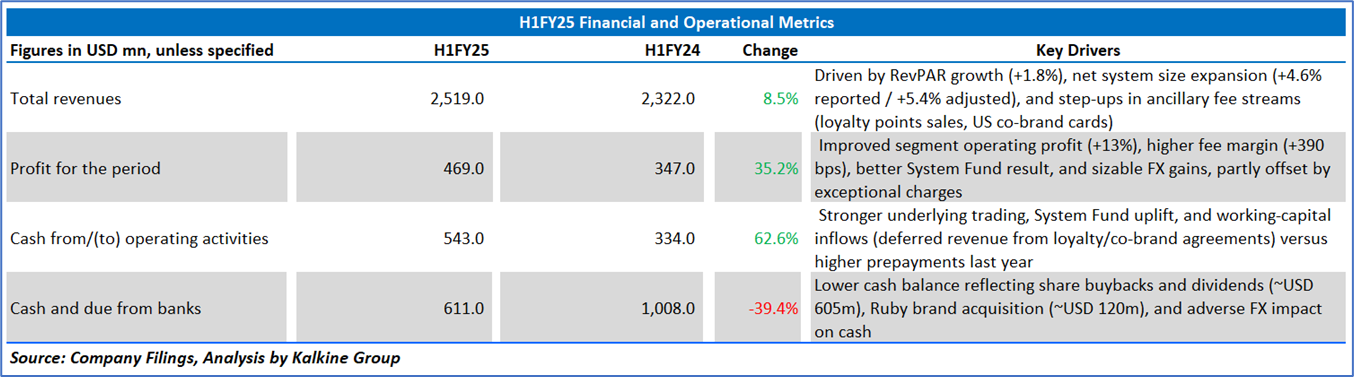
2.2 Q2FY25 Results Highlights (for the 06 months ending June 30, 2025): Below are some key financial highlights:
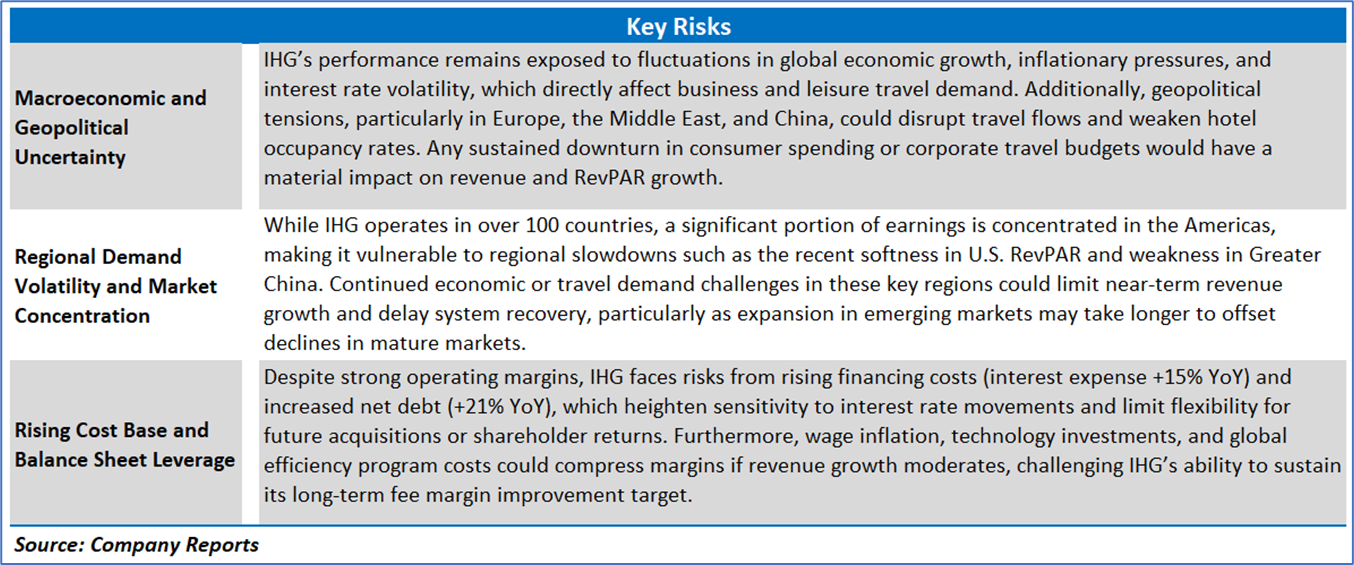
Section 3: Key Risks and Outlook:
Section 4: Stock Recommendation Summary
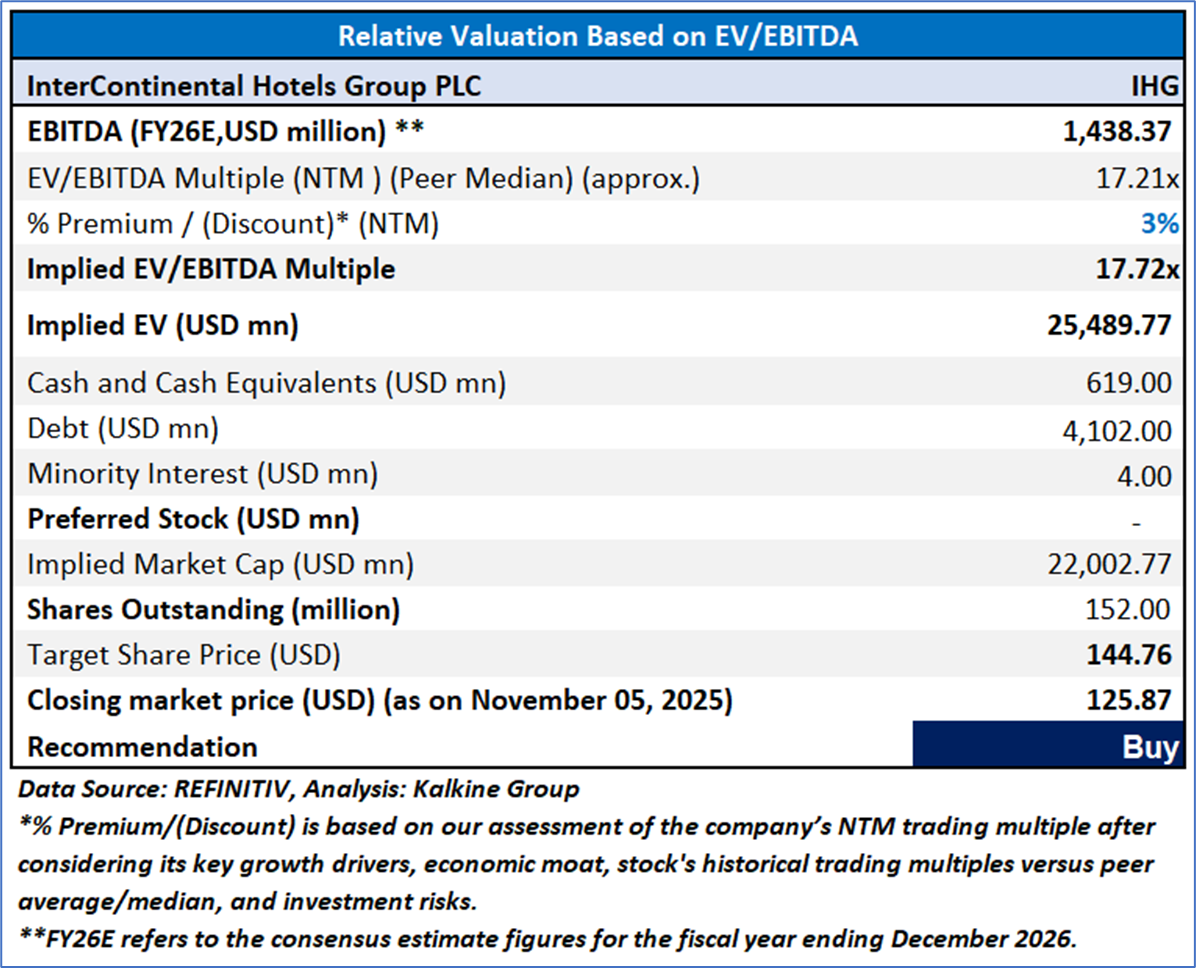
4.2 Fundamental Valuation
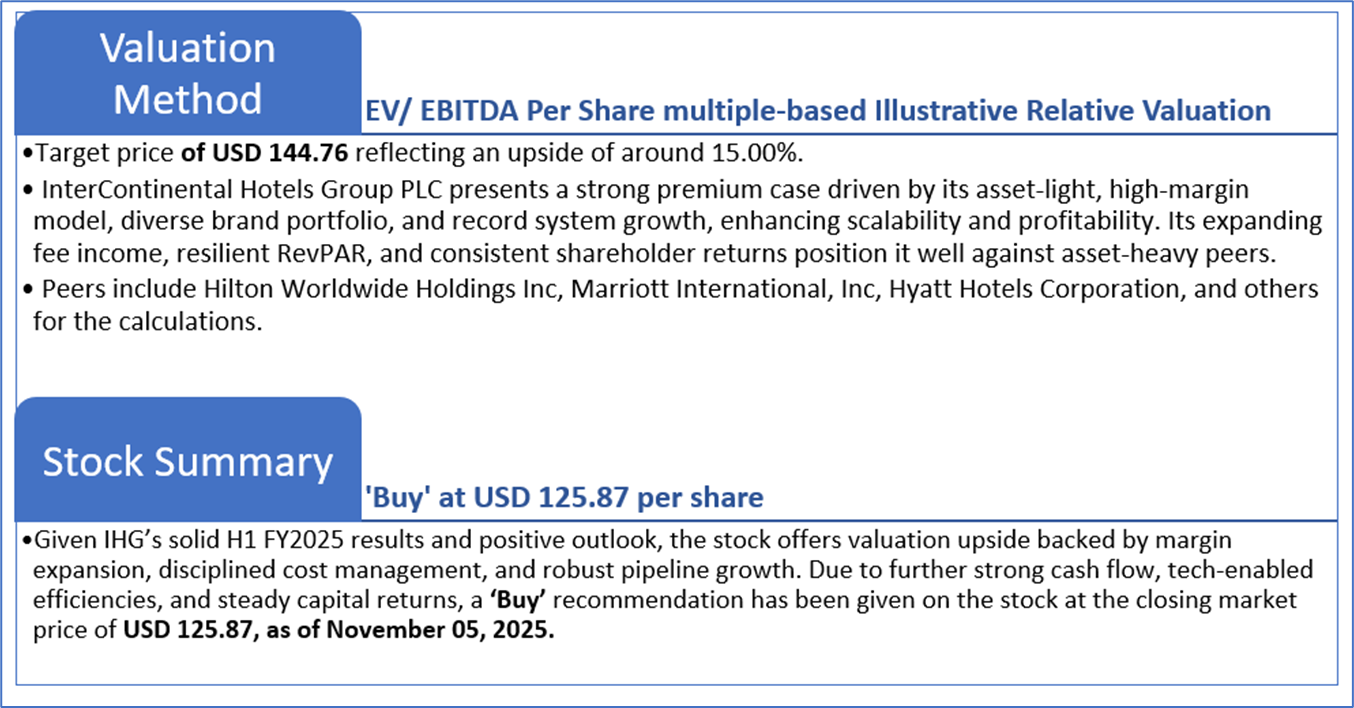
Valuation Methodology: EV/EBITDA Multiple Based Relative Valuation (Illustrative)
Markets are trading in a highly volatile zone currently due to certain macro-economic issues and geopolitical tensions prevailing. Therefore, it is prudent to follow a cautious approach while investing.
Note 1: Past performance is neither an indicator nor a guarantee of future performance.
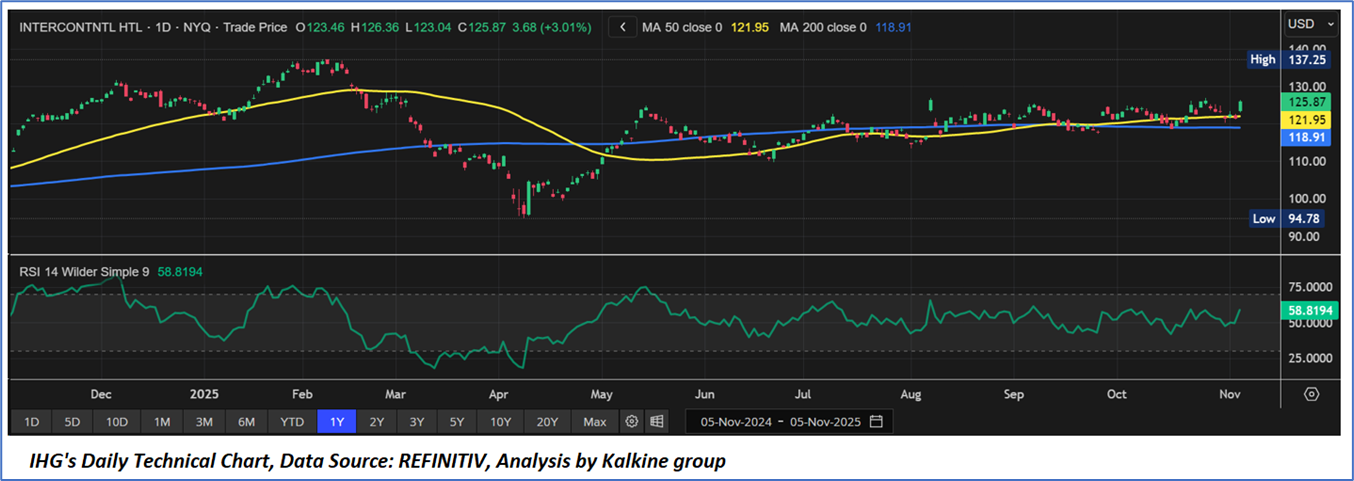
Note 2: The reference date for all price data, currency, technical indicators, support, and resistance levels is November 05, 2025. The reference data in this report has been partly sourced from REFINITIV.
Note 3: Investment decisions should be made depending on an individual's appetite for upside potential, risks, holding duration, and any previous holdings. An 'Exit' from the stock can be considered if the Target Price mentioned as per the Valuation and or the technical levels provided has been achieved and is subject to the factors discussed above.
Note 4: Dividend Yield may vary as per the stock price movement.
Note 5: Kalkine reports are prepared based on the stock prices captured either from REFINITIV or Trading View. Typically, REFINITIV or Trading View may reflect stock prices with a delay which could be a lag of 25-30 minutes. There can be no assurance that future results or events will be consistent with the information provided in the report. The information is subject to change without any prior notice.
Technical Indicators Defined: -
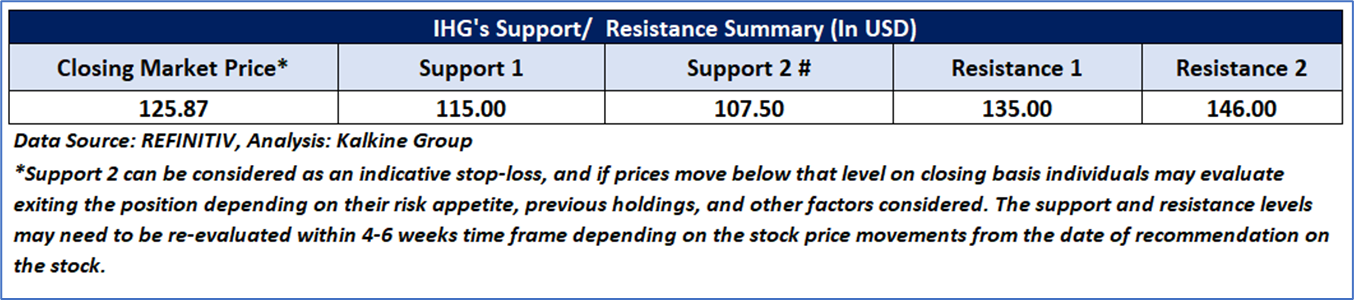
Support: A level at which the stock prices tend to find support if they are falling, and a downtrend may take a pause backed by demand or buying interest. Support 1 refers to the nearby support level for the stock and if the price breaches the level, then Support 2 may act as the crucial support level for the stock.
Resistance: A level at which the stock prices tend to find resistance when they are rising, and an uptrend may take a pause due to profit booking or selling interest. Resistance 1 refers to the nearby resistance level for the stock and if the price surpasses the level, then Resistance 2 may act as the crucial resistance level for the stock.
Stop-loss: It is a level to protect further losses in case of unfavourable movement in the stock prices.
Kalkine Equities LLC, with Delaware File Number 4697384, Foreign Qualification Registration in California File Number 202109211078, and Texas File Number 805521396, is authorized to provide general advice only. The information on https://kalkine.com/ does not take into account any of your investment objectives, financial situation or needs. You should consider the appropriateness of advice taking into account your own objectives, financial situation and needs and seek independent financial advice before making any financial decisions. The link to our Terms and Conditions and Privacy Policy has been provided for your reference. On the date of publishing the reports (mentioned on the website), employees and/or associates of Kalkine do not hold positions in any of the stocks covered on the website. These stocks can change any time and readers of the reports should not consider these stocks as advice or recommendations later.
Past performance is not a reliable indicator of future performance.
 Please wait processing your request...