
Section 1: Company Overview and Fundamentals
1.1 Company Overview:
IREN Limited (NASDAQ: IREN) an Australia-based company, operates data centers that run entirely on renewable energy. These facilities are designed to support high-density computing workloads, including Bitcoin mining, AI cloud services, and other intensive compute applications. The company’s data center operations are located across Canal Flats, Mackenzie, Prince George, and Childress.
Kalkine’s Diversified Opportunities Report covers the Company Overview, Key positives & negatives, Investment summary, Key investment metrics, Top 10 shareholding, Business updates and insights into company recent financial results, Key Risks & Outlook, Price performance and technical summary, Target Price, and Recommendation on the stock.
Stock Performance:
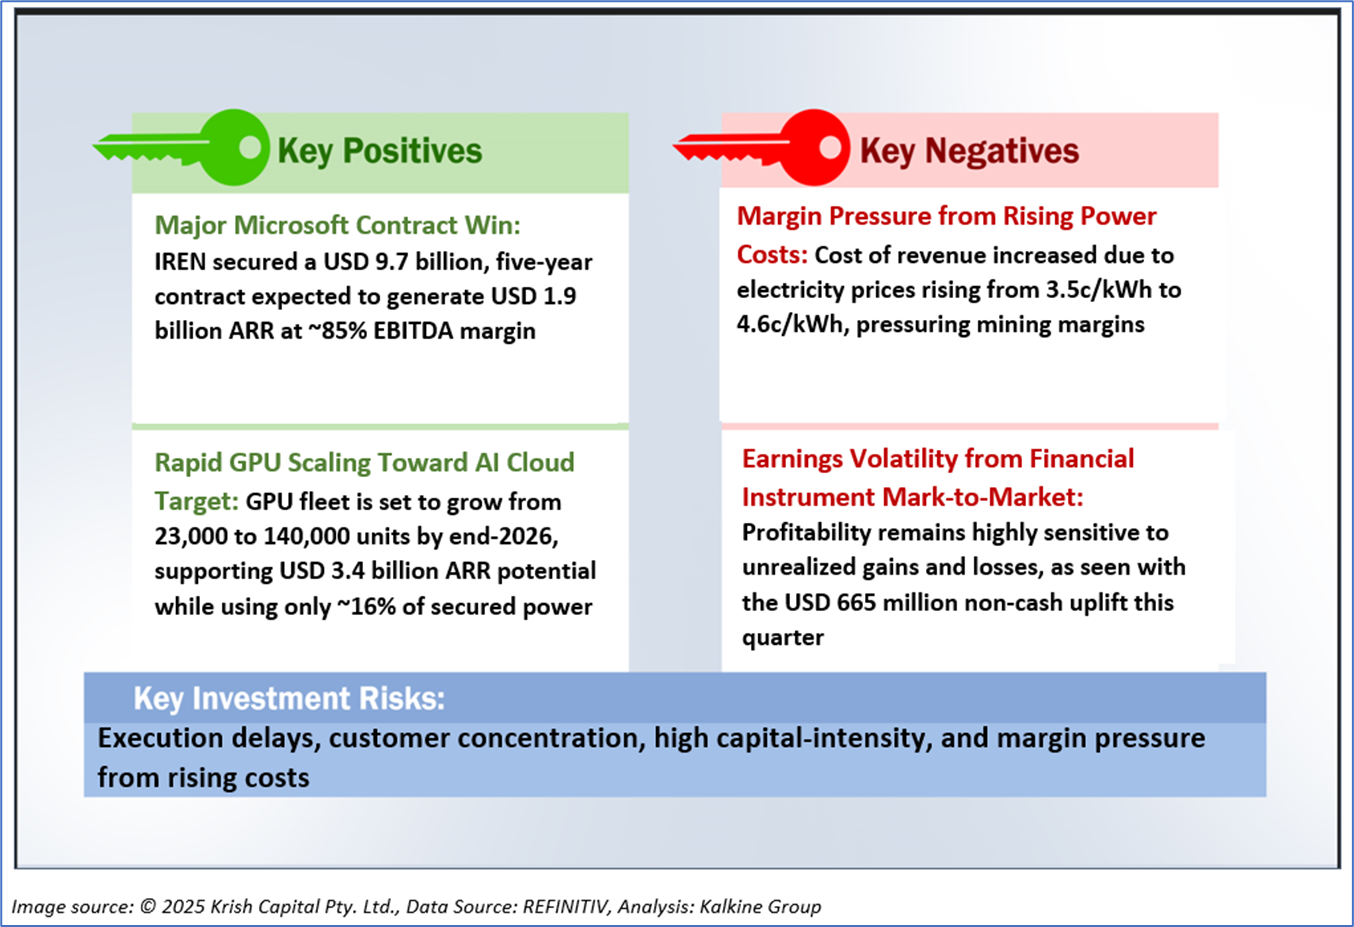
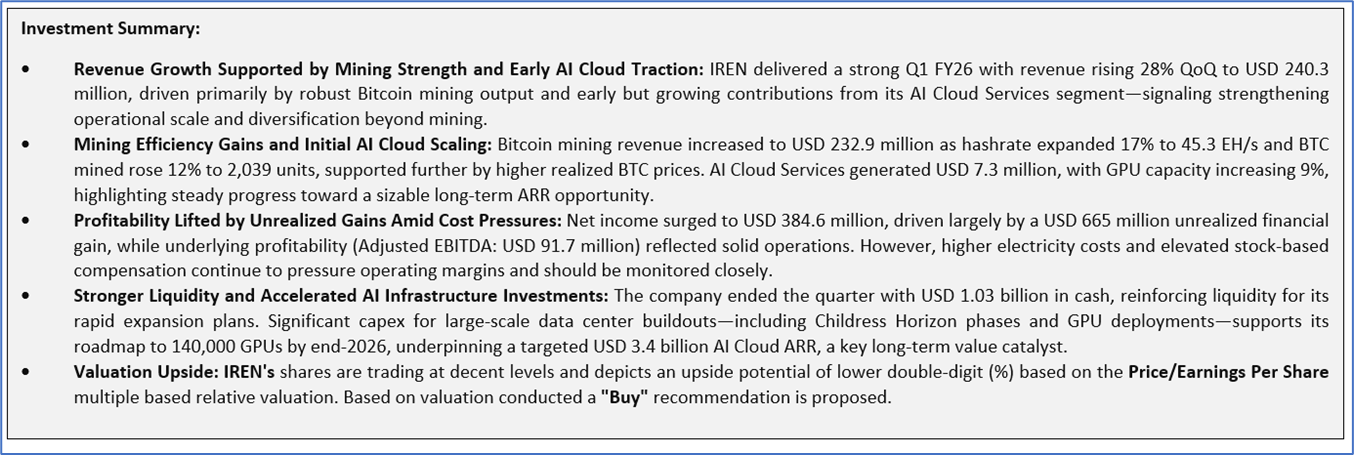
1.2 The Key Positives, Negatives, and Investment summary
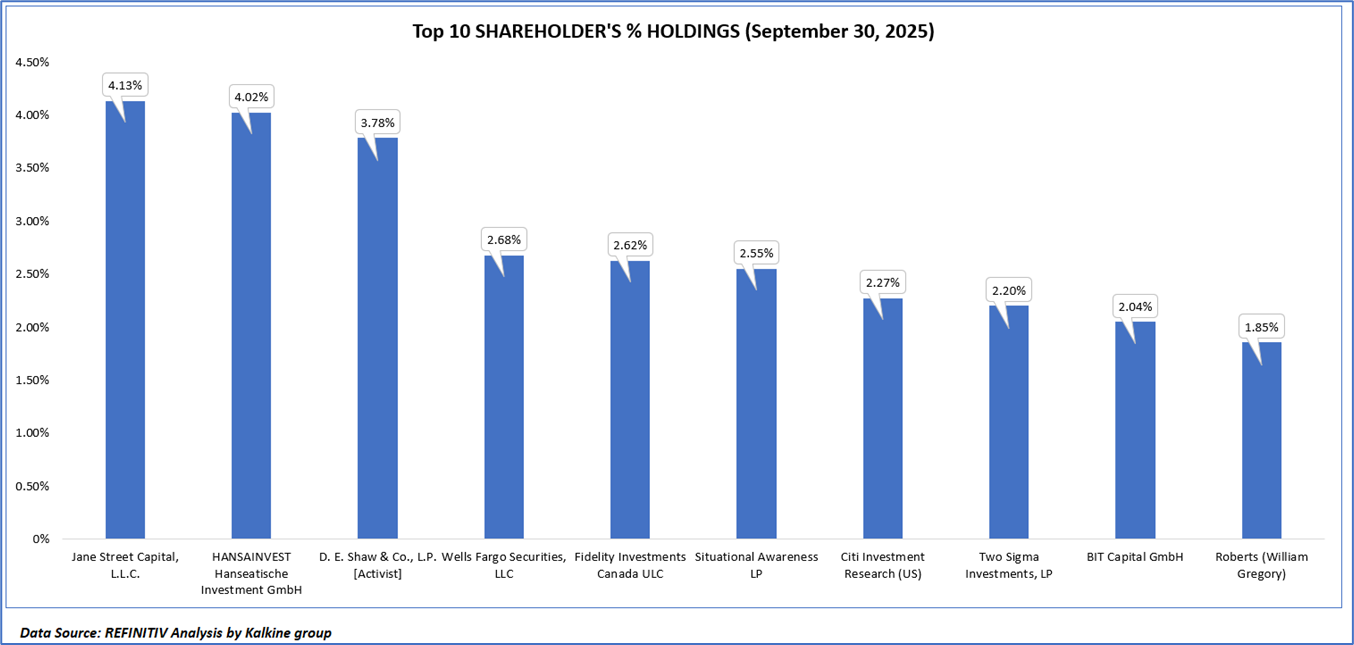
1.3 Top 10 shareholders:
The top 10 shareholders together form ~28.14% of the total shareholding, signifying concentrated shareholding. Jane Street Capital, L.L.C., HANSAINVEST Hanseatische Investment GmbH are the biggest shareholders, holding the maximum stake in the company at 4.13% and 4.02%, respectively.
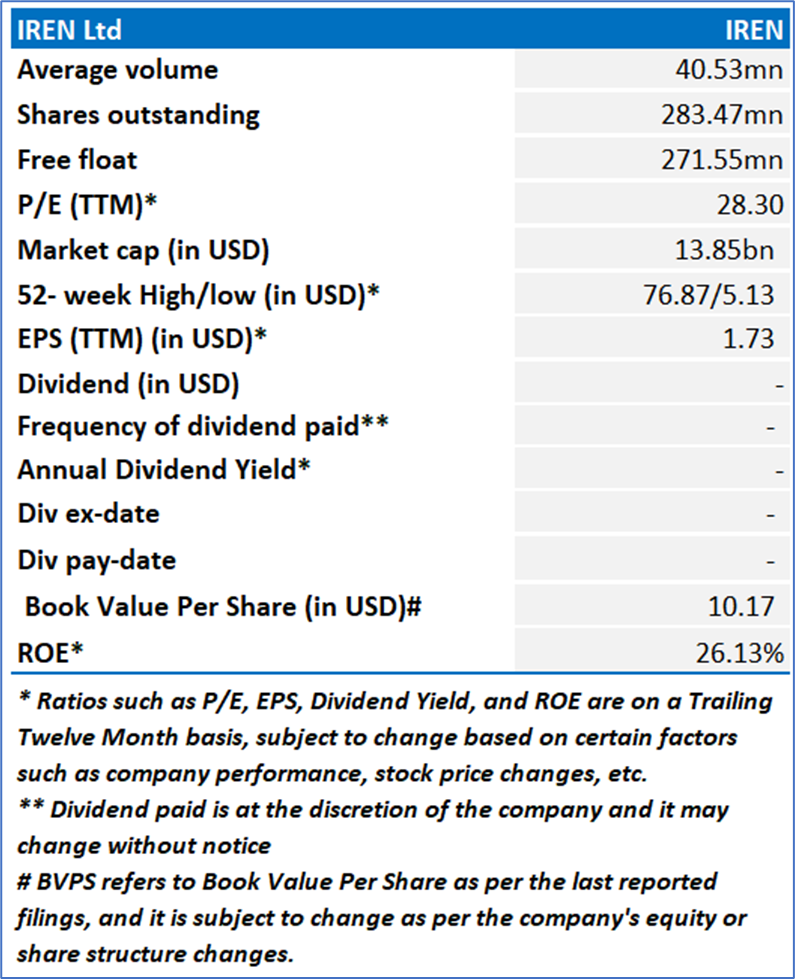
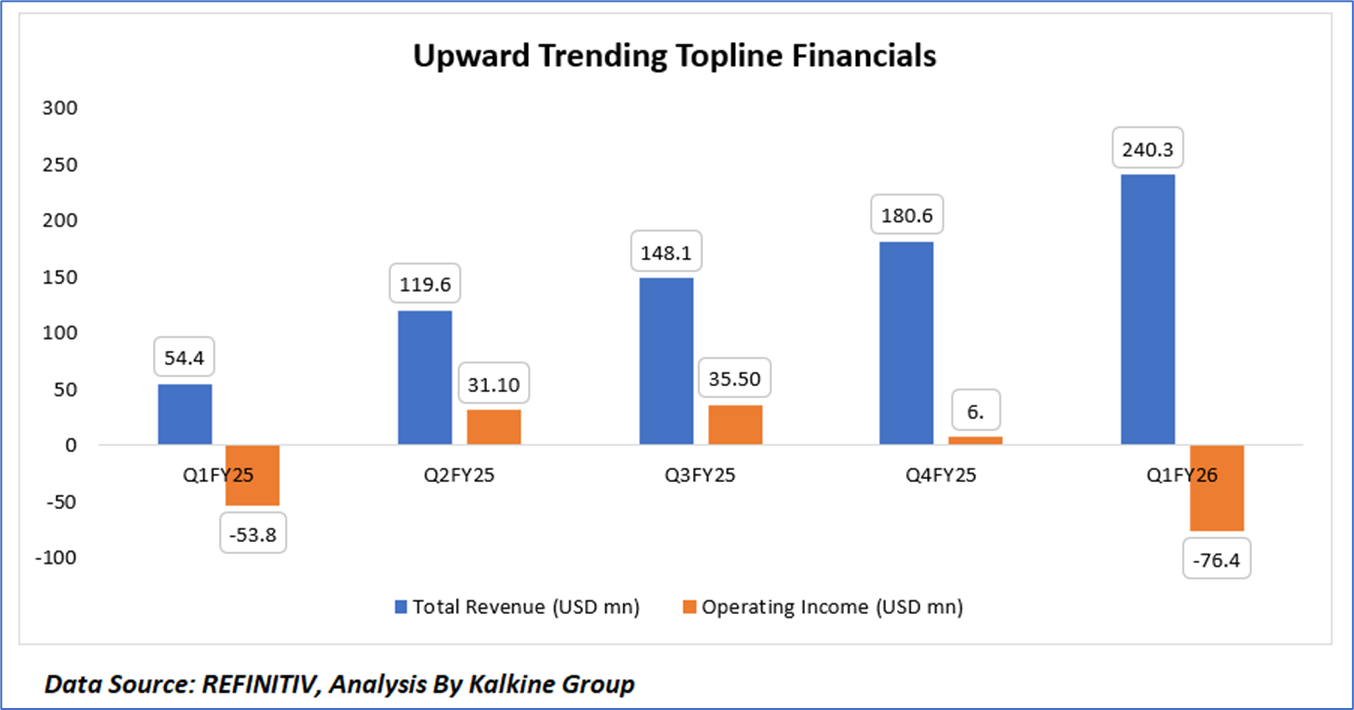
1.4 Key Metrics
IREN’s quarterly performance reflects a strong and accelerating revenue trajectory, with total revenue rising consistently from USD 54.4 million in Q1 FY25 to USD 240.3 million in Q1 FY26, representing more than a fourfold increase driven by rapid scaling in both mining operations and AI Cloud services. However, operating income has remained volatile despite the top-line expansion: after moving into positive territory through Q2–Q3 FY25 and moderating sharply in Q4 FY25, the company returned to a significant operating loss of USD –76.4 million in Q1 FY26. This divergence highlights the impact of rising operating costs, increased depreciation, and substantial non-cash expenses associated with the company’s large-scale growth initiatives. Overall, while revenue momentum is exceptionally strong, the variability in operating income underscores the importance of cost discipline and efficiency gains as IREN continues transitioning toward a high-capex, AI-driven business model.
Section 2: Business Updates and Corporate Business Highlights
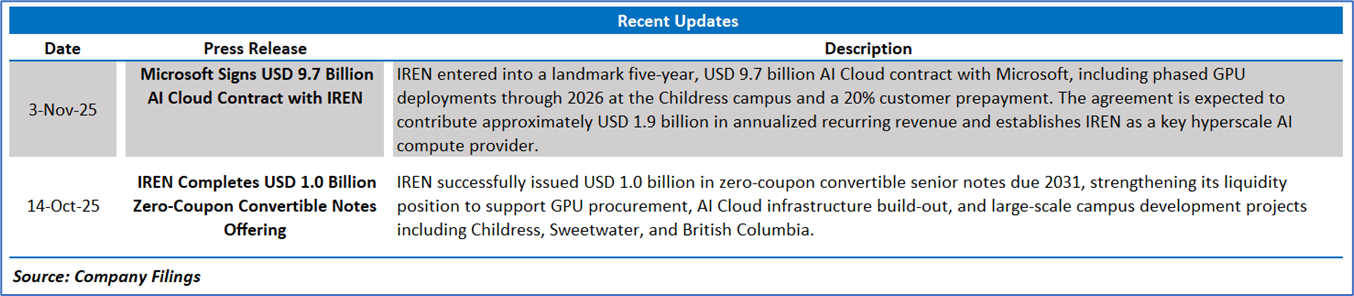
2.1 Recent Updates:
The below picture gives an overview of the recent updates:
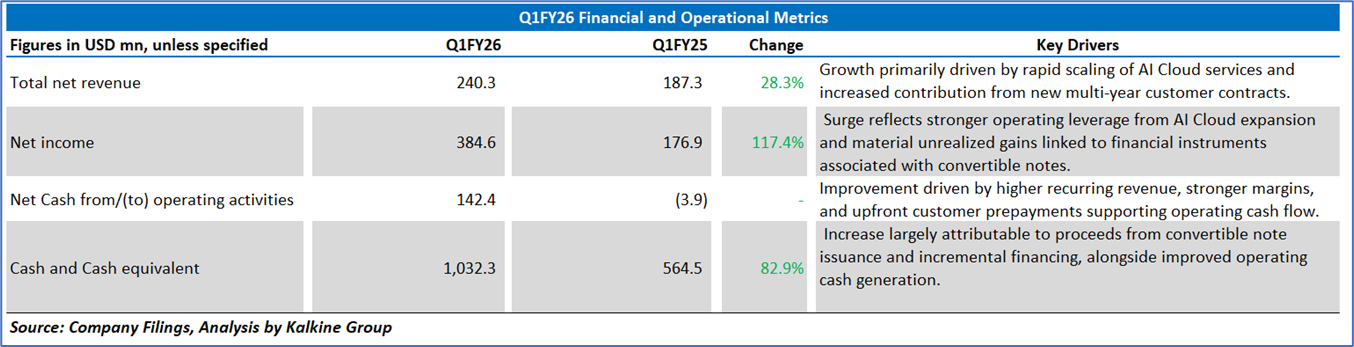
2.2 Insights of Q1FY26:
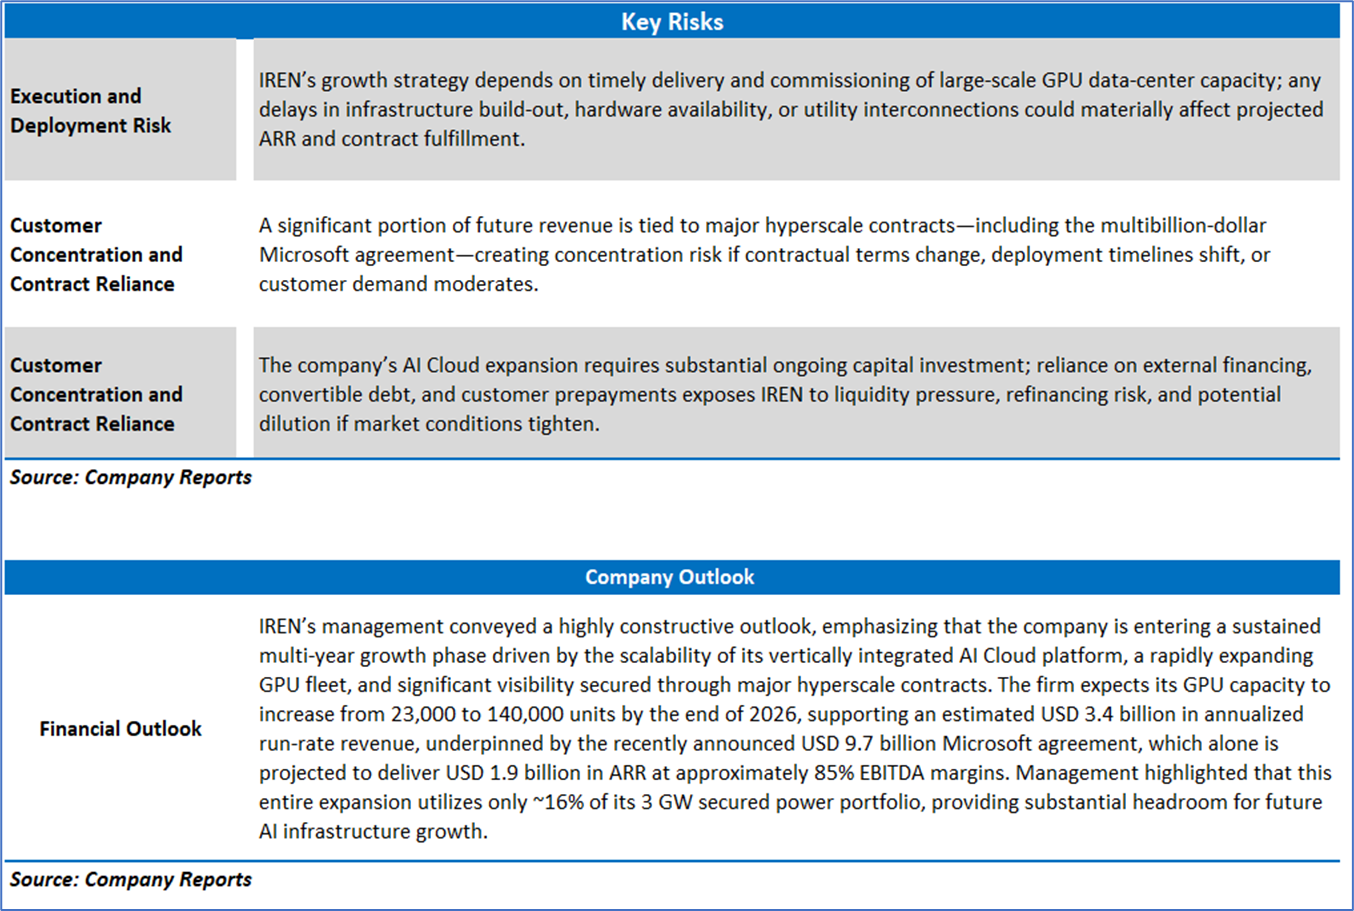
Section 3: Key Risks & Outlook
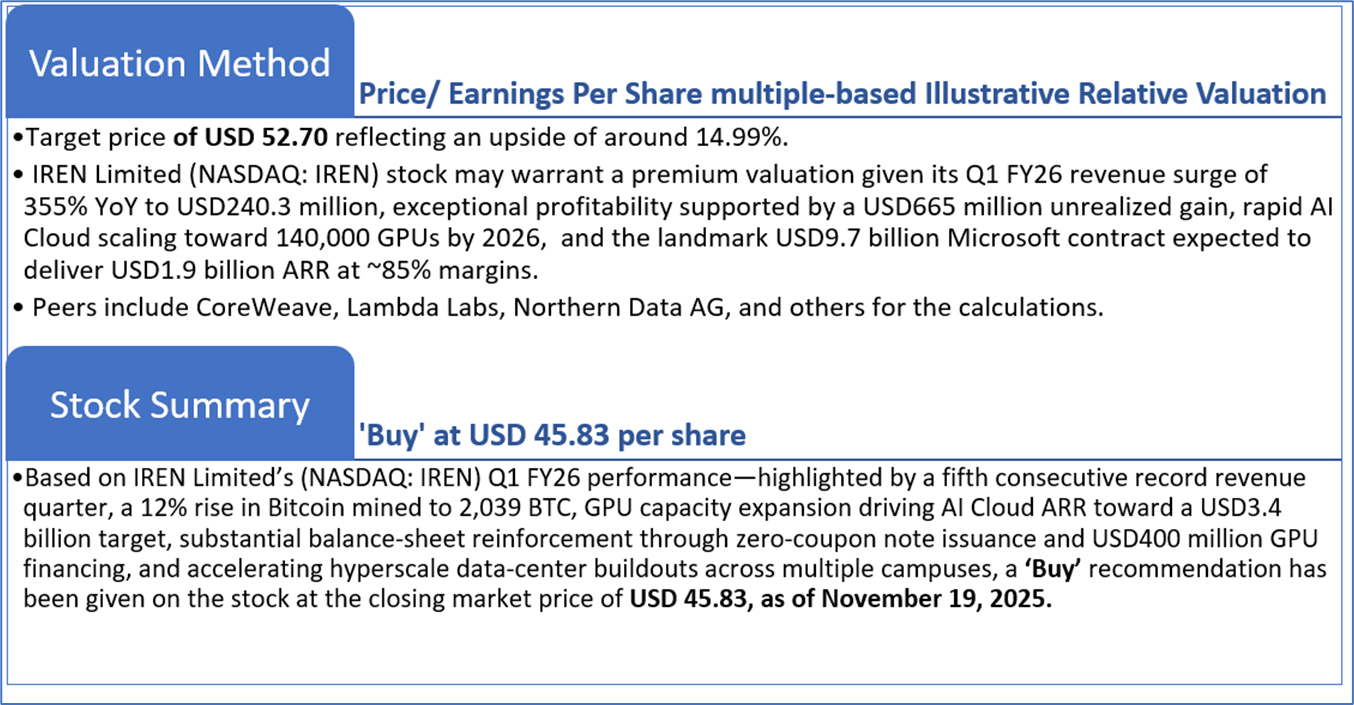
Section 4: Stock Recommendation Summary:
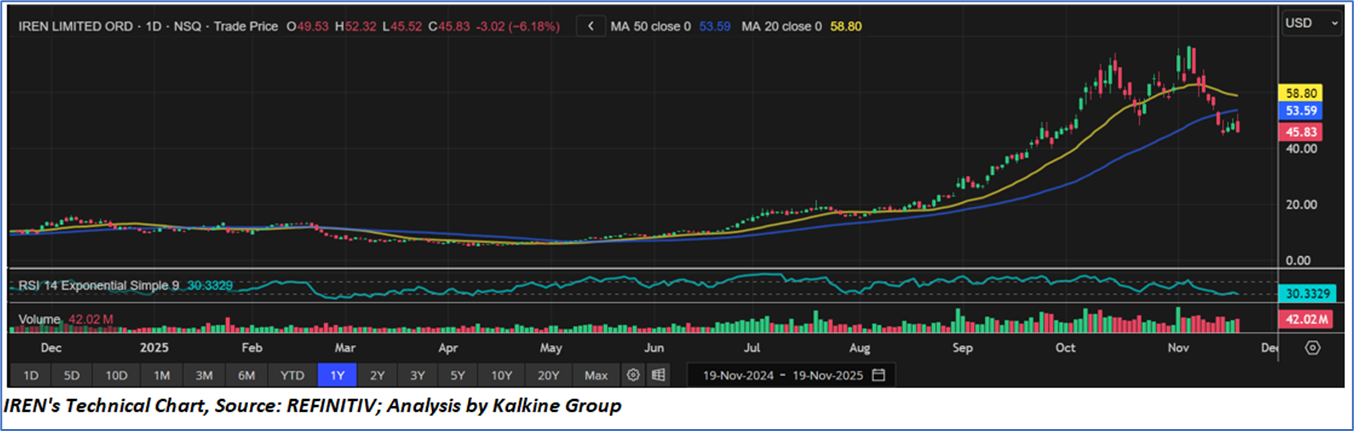
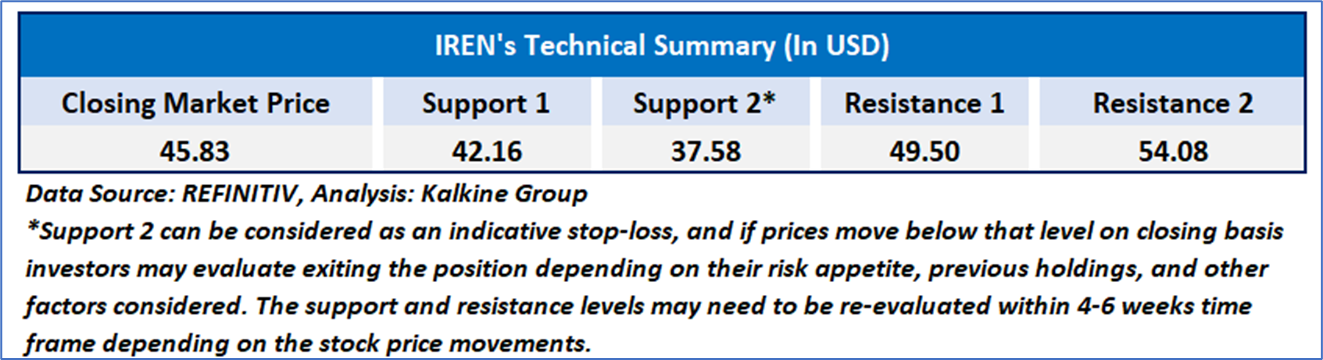
4.1 Price Performance and Technical Summary:
Stock Performance:
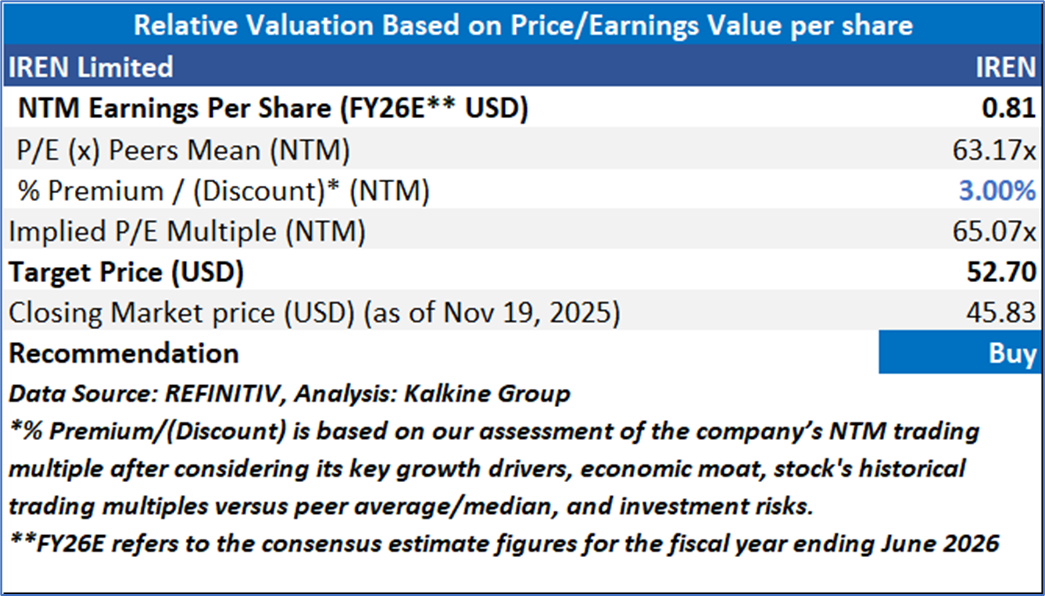
4.2 Fundamental Valuation
Valuation Methodology: Price/Earnings Per Share Multiple Based Relative Valuation
Markets are trading in a highly volatile zone currently due to certain macroeconomic issues and geopolitical tensions prevailing. Therefore, it is prudent to follow a cautious approach while investing.
Note 1: Past performance is not a reliable indicator of future performance.
Note 2: The reference date for all price data, currency, technical indicators, support, and resistance levels is November 19, 2025. The reference data in this report has been partly sourced from REFINITIV.
Note 3: Investment decisions should be made depending on an individual's appetite for upside potential, risks, holding duration, and any previous holdings. An 'Exit' from the stock can be considered if the Target Price mentioned as per the Valuation and or the technical levels provided has been achieved and is subject to the factors discussed above.
Note 4: The report publishing date is as per the Pacific Time Zone.
Technical Indicators Defined: -
Support: A level at which the stock prices tend to find support if they are falling, and a downtrend may take a pause backed by demand or buying interest. Support 1 refers to the nearby support level for the stock and if the price breaches the level, then Support 2 may act as the crucial support level for the stock.
Resistance: A level at which the stock prices tend to find resistance when they are rising, and an uptrend may take a pause due to profit booking or selling interest. Resistance 1 refers to the nearby resistance level for the stock and if the price surpasses the level, then Resistance 2 may act as the crucial resistance level for the stock.
Stop-loss: It is a level to protect against further losses in case of unfavorable movement in the stock prices.
Kalkine Equities LLC, with Delaware File Number 4697384, Foreign Qualification Registration in California File Number 202109211078, and Texas File Number 805521396, is authorized to provide general advice only. The information on https://kalkine.com/ does not take into account any of your investment objectives, financial situation or needs. You should consider the appropriateness of advice taking into account your own objectives, financial situation and needs and seek independent financial advice before making any financial decisions. The link to our Terms and Conditions and Privacy Policy has been provided for your reference. On the date of publishing the reports (mentioned on the website), employees and/or associates of Kalkine do not hold positions in any of the stocks covered on the website. These stocks can change any time and readers of the reports should not consider these stocks as advice or recommendations later.
Past performance is not a reliable indicator of future performance.
 Please wait processing your request...