
Section 1: Company Overview and Fundamentals
1.1 Company Overview:
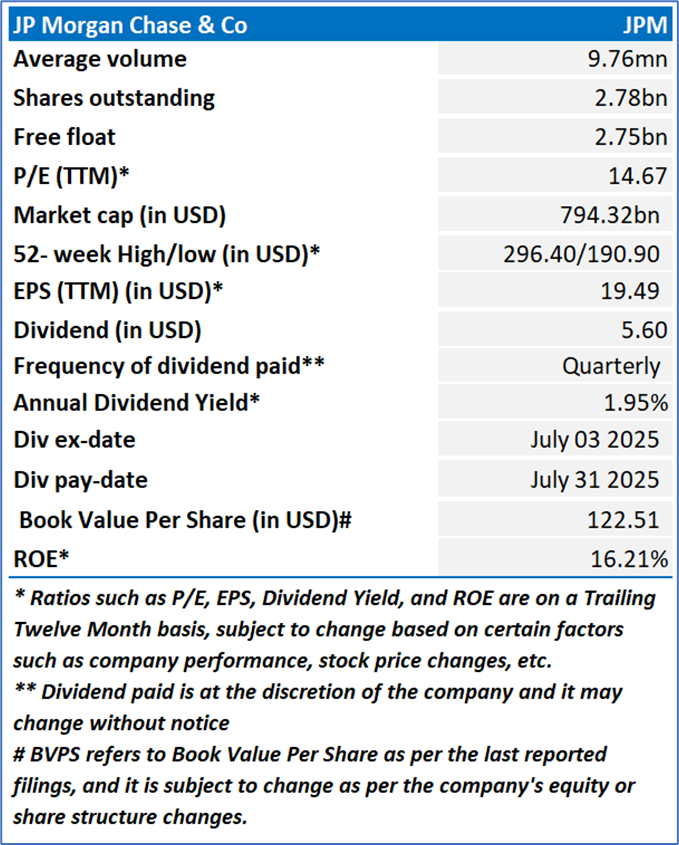
JPMorgan Chase & Co. (NYSE: JPM) is a financial holding company. The Company is engaged in investment banking, financial services for consumers and small businesses, commercial banking, financial transaction processing and asset management. The Company operates through three segments: Consumer & Community Banking (CCB), Commercial & Investment Bank (CIB), and Asset & Wealth Management (AWM).
Kalkine’s Diversified Opportunities Report covers the Company Overview, Key positives & negatives, Investment summary, Key investment metrics, Top 10 shareholding, Business updates and insights into company recent financial results, Key Risks & Outlook, Price performance and technical summary, Target Price, and Recommendation on the stock.
Stock Performance:
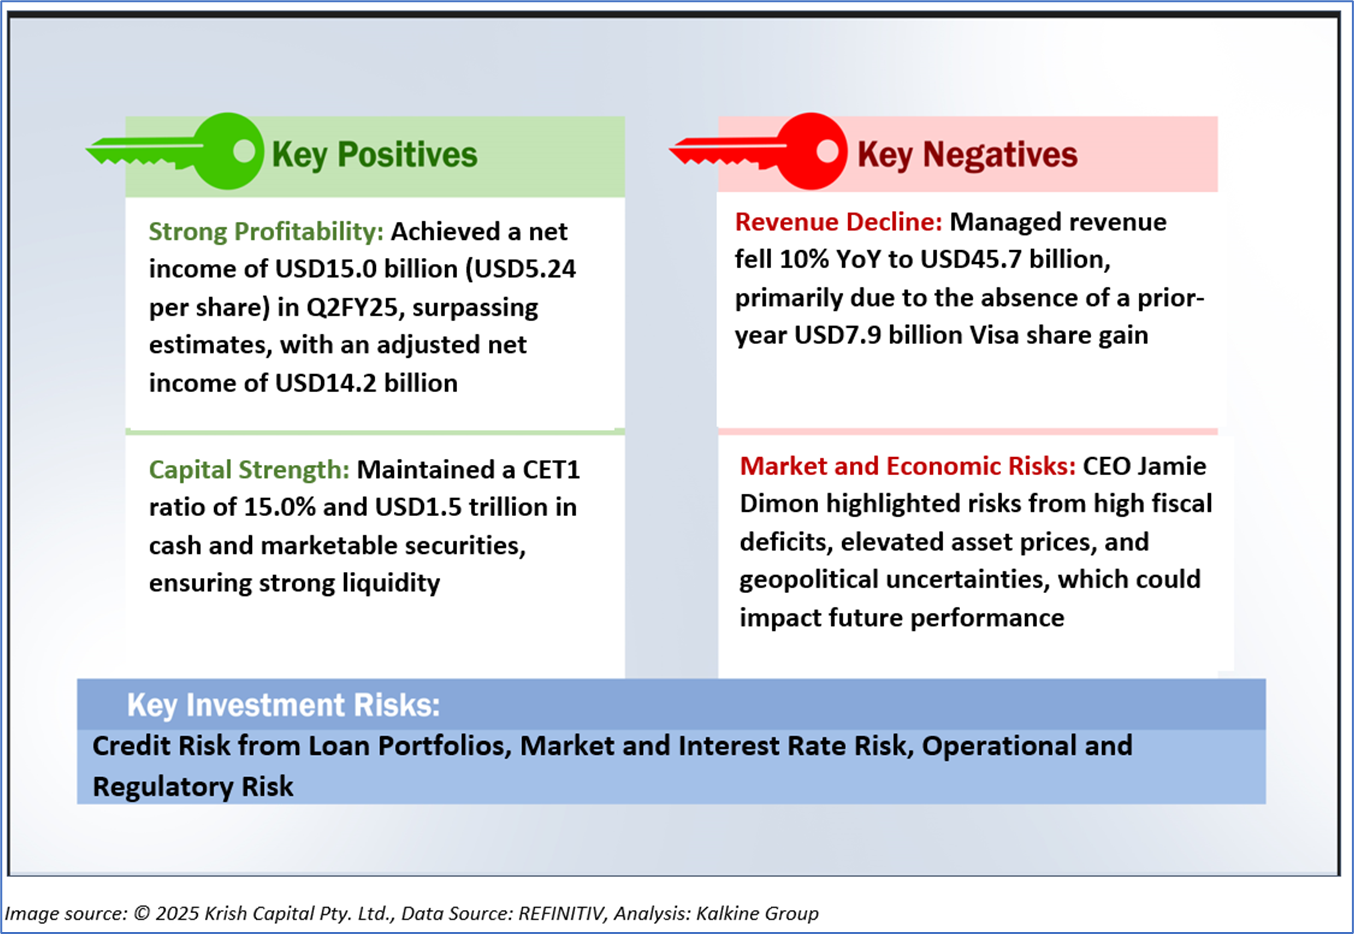
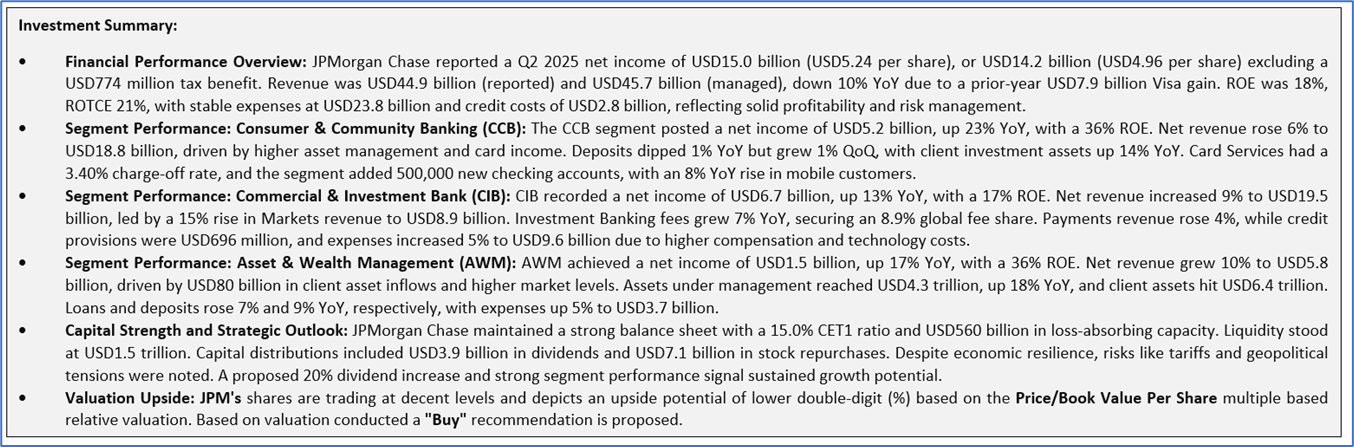
1.2 The Key Positives, Negatives, and Investment summary
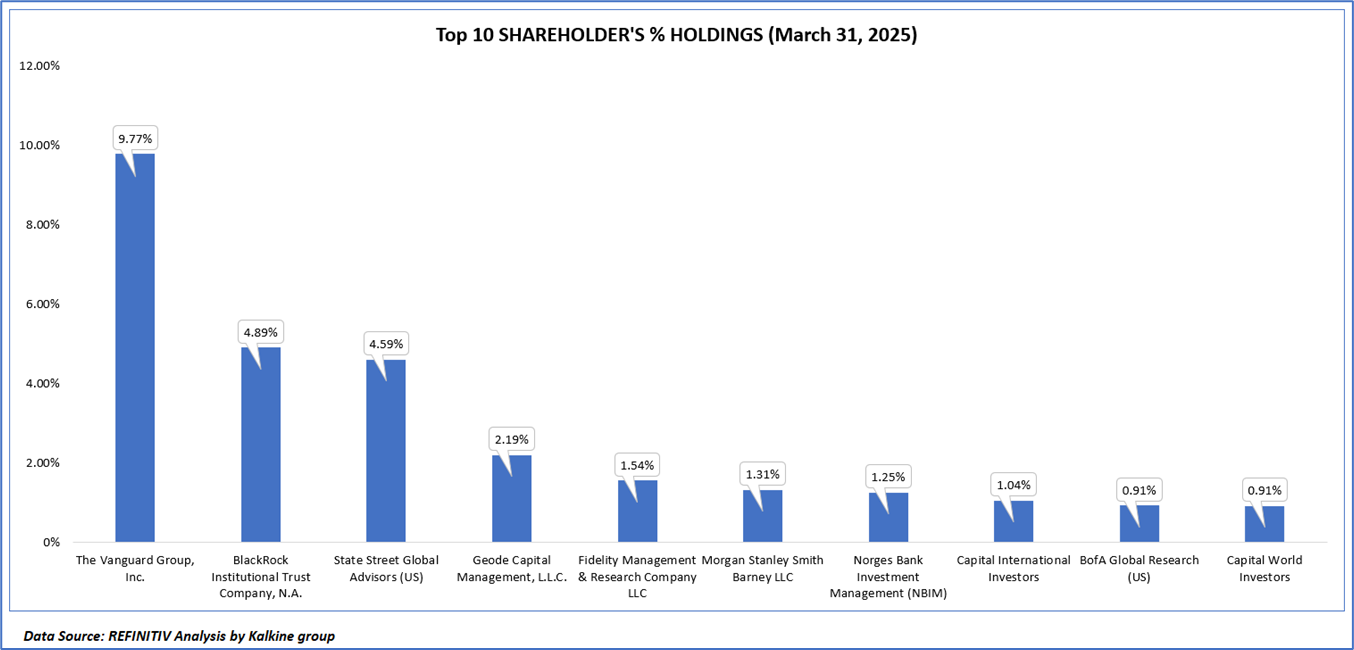
1.3 Top 10 shareholders:
The top 10 shareholders together form ~28.39% of the total shareholding, signifying concentrated shareholding. The Vanguard Group, Inc., and BlackRock Institutional Trust Company, N.A., are the biggest shareholders, holding the maximum stake in the company at 9.77% and 4.89%, respectively.
1.4 Key Metrics
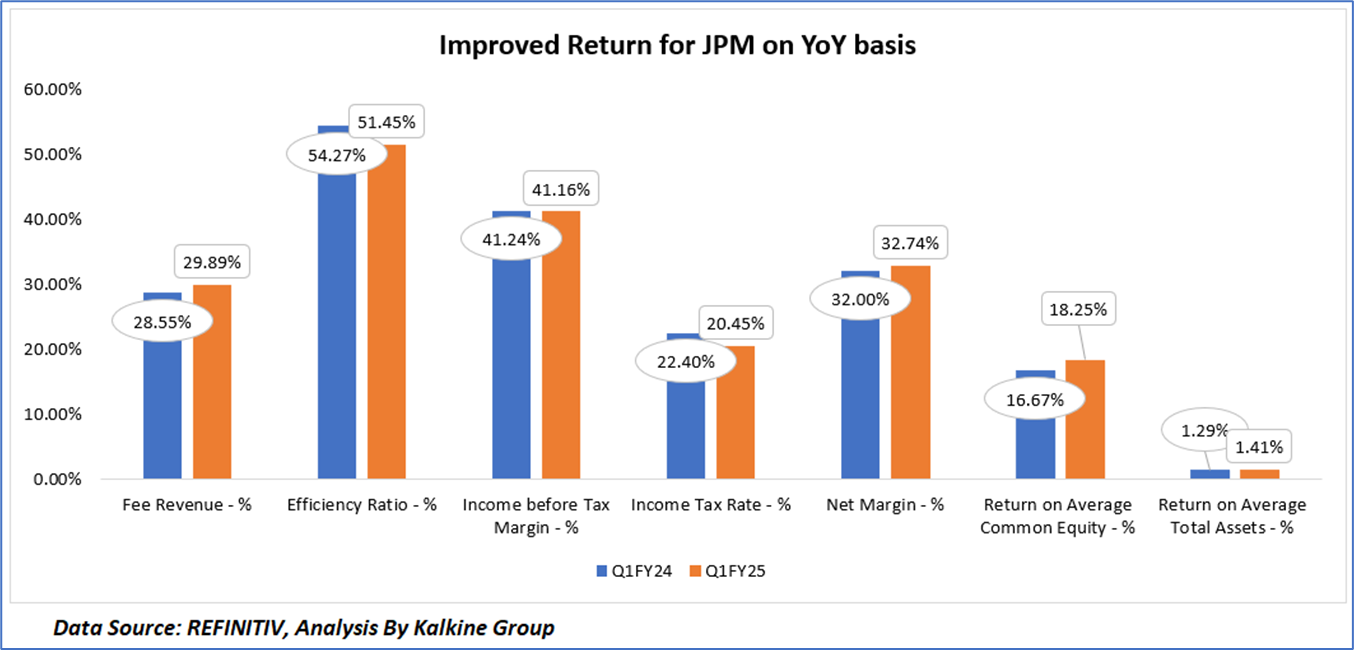
JPMorgan Chase & Co. demonstrated improved financial performance in Q1 FY25 compared to Q1 FY24, reflecting operational efficiency and profitability gains. Fee revenue as a percentage of total revenue increased from 28.55% to 29.89%, indicating a stronger contribution from noninterest income sources such as asset management and investment banking fees. The efficiency ratio improved significantly from 54.27% to 51.45%, showcasing better cost management and operational leverage, likely driven by controlled expense growth relative to revenue. The income before tax margin remained stable at 41.16% (slightly down from 41.24%), reflecting consistent pre-tax profitability. A lower income tax rate of 20.45% (down from 22.40%) bolstered after-tax earnings, contributing to a higher net margin of 32.74% compared to 32.00% in Q1 FY24. The return on average common equity rose from 16.67% to 18.25%, and the return on average total assets increased from 1.29% to 1.41%, underscoring enhanced capital efficiency and asset utilization. These metrics collectively highlight JPMorgan Chase’s ability to optimize revenue streams, manage costs effectively, and deliver stronger returns to shareholders in Q1 FY25, positioning the firm favorably for sustained financial health.
Section 2: Business Updates and Corporate Business Highlights
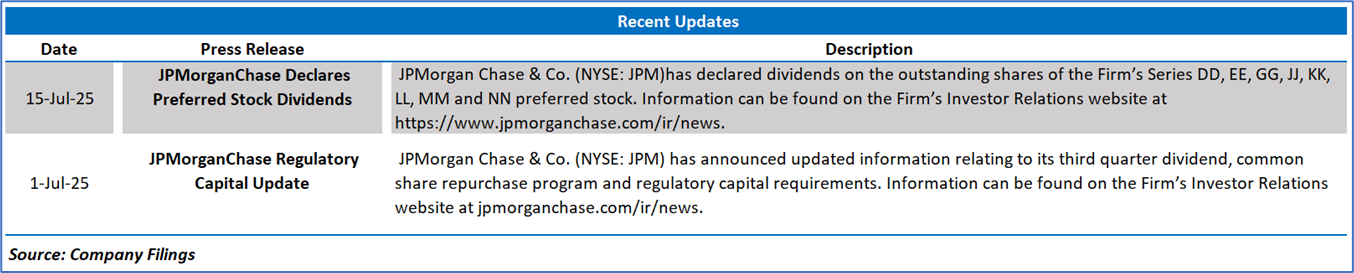
2.1 Recent Updates:
The below picture gives an overview of the recent updates:
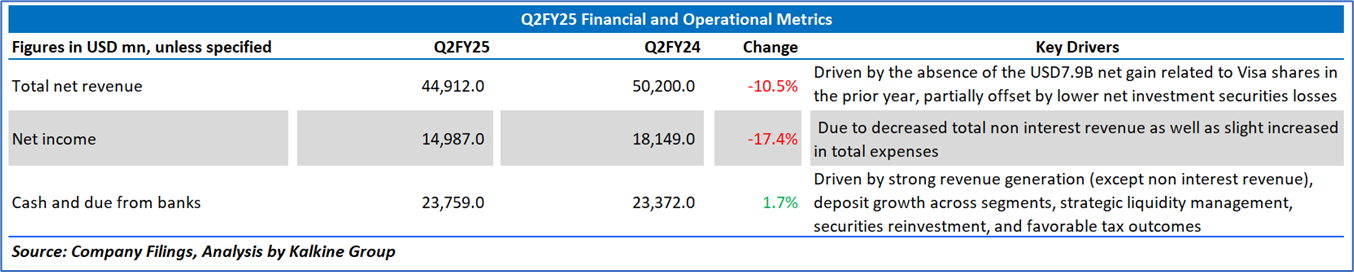
2.2 Insights of Q2FY25:
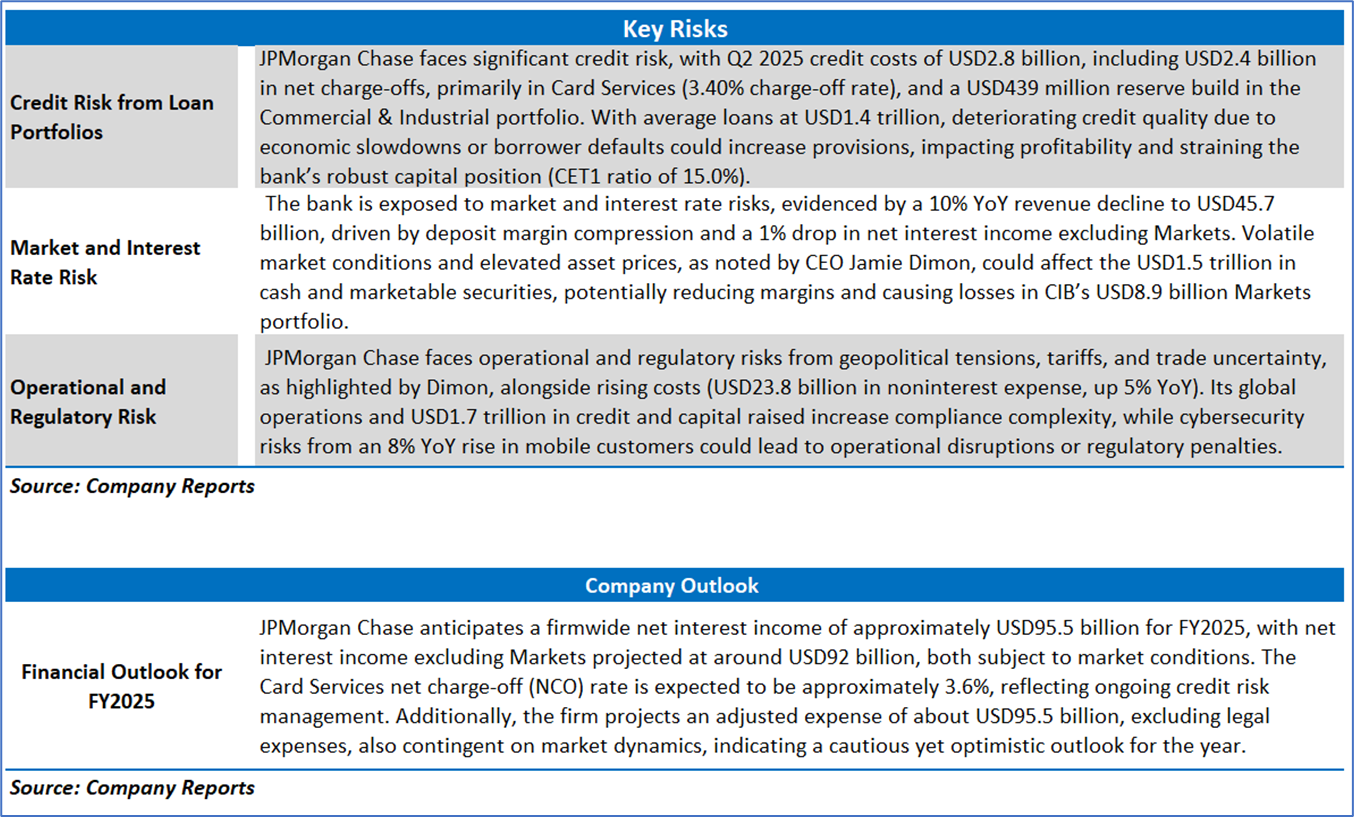
Section 3: Key Risks & Outlook
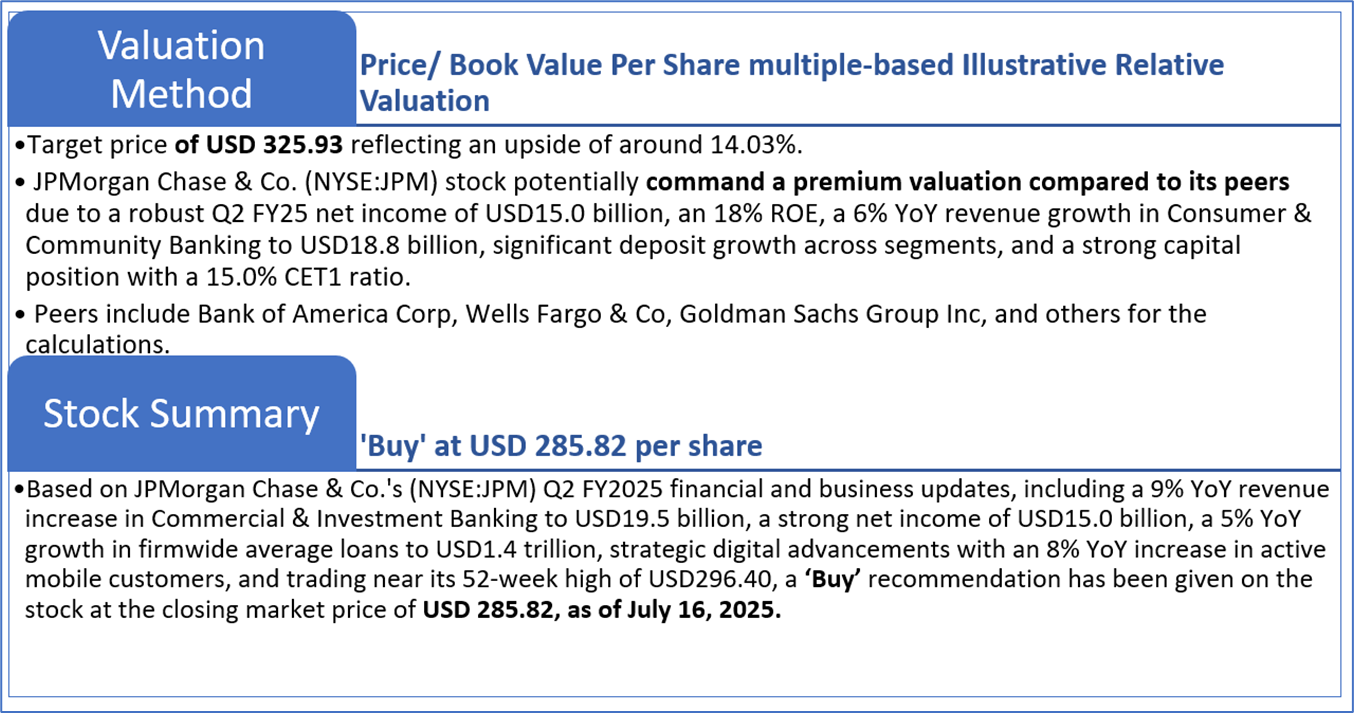
Section 4: Stock Recommendation Summary:
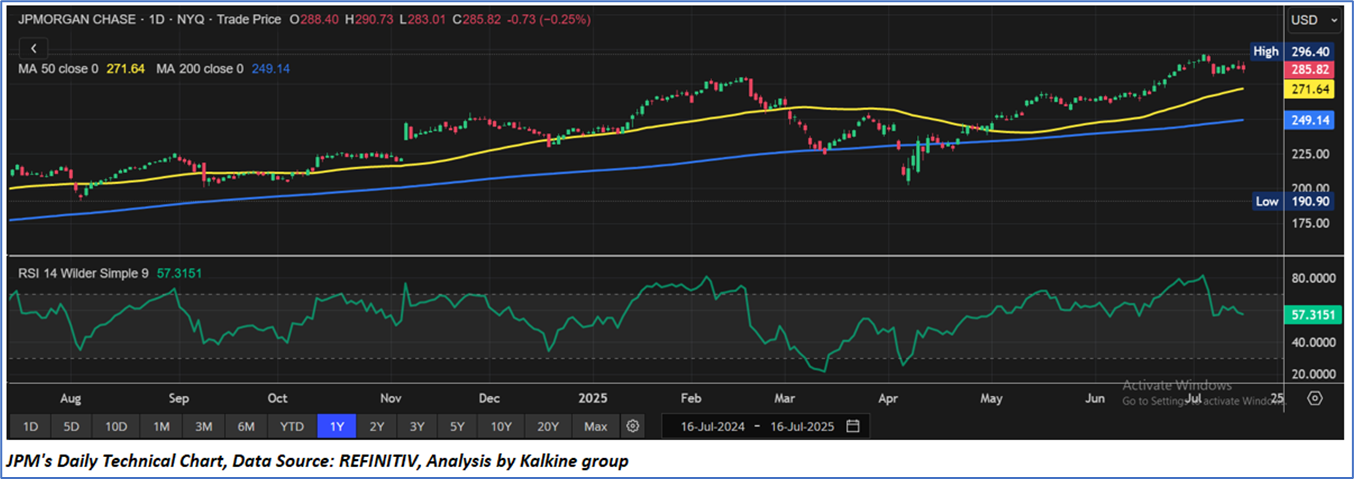
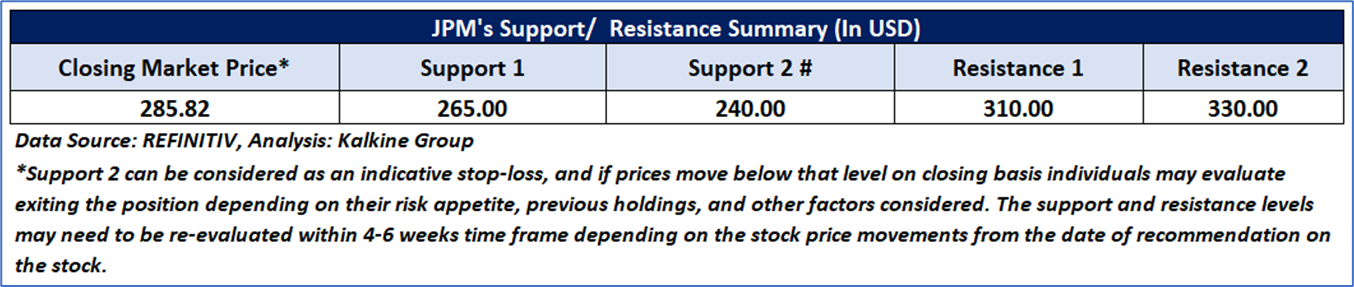
4.1 Price Performance and Technical Summary:
Stock Performance:
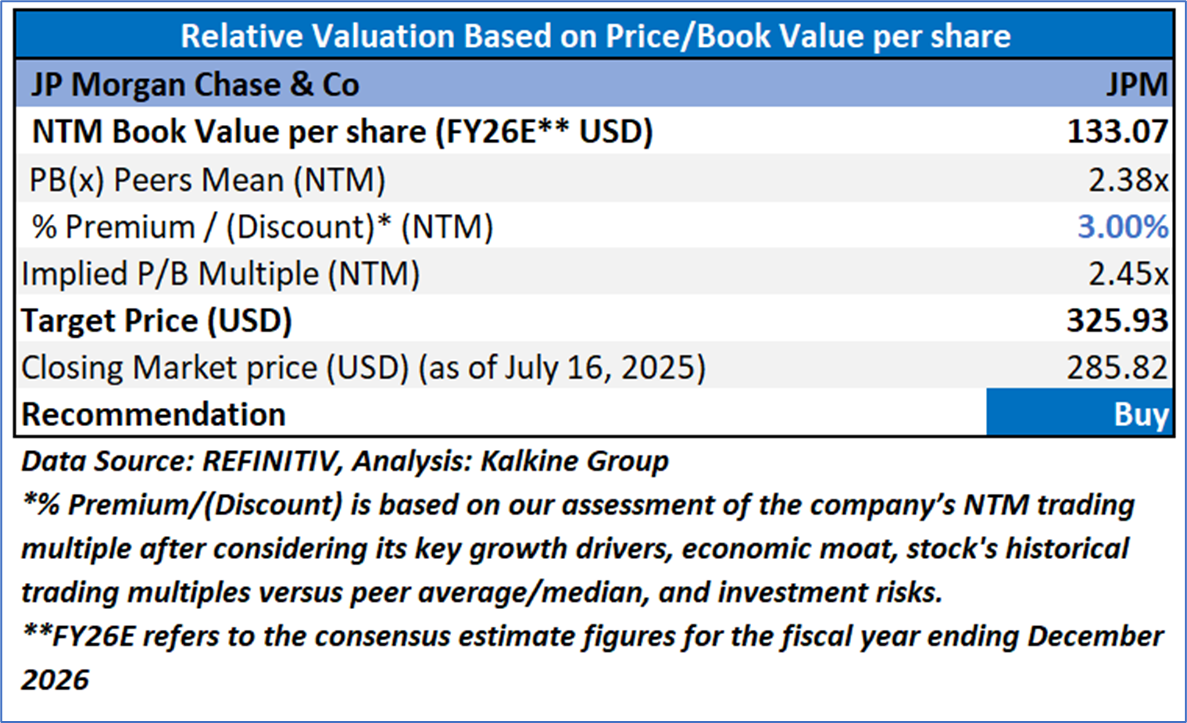
4.2 Fundamental Valuation
Valuation Methodology: Price/Book Value Per Share Multiple Based Relative Valuation
Markets are trading in a highly volatile zone currently due to certain macroeconomic issues and geopolitical tensions prevailing. Therefore, it is prudent to follow a cautious approach while investing.
Note 1: Past performance is not a reliable indicator of future performance.
Note 2: The reference date for all price data, currency, technical indicators, support, and resistance levels is July 16, 2025. The reference data in this report has been partly sourced from REFINITIV.
Note 3: Investment decisions should be made depending on an individual's appetite for upside potential, risks, holding duration, and any previous holdings. An 'Exit' from the stock can be considered if the Target Price mentioned as per the Valuation and or the technical levels provided has been achieved and is subject to the factors discussed above.
Note 4: The report publishing date is as per the Pacific Time Zone.
Technical Indicators Defined: -
Support: A level at which the stock prices tend to find support if they are falling, and a downtrend may take a pause backed by demand or buying interest. Support 1 refers to the nearby support level for the stock and if the price breaches the level, then Support 2 may act as the crucial support level for the stock.
Resistance: A level at which the stock prices tend to find resistance when they are rising, and an uptrend may take a pause due to profit booking or selling interest. Resistance 1 refers to the nearby resistance level for the stock and if the price surpasses the level, then Resistance 2 may act as the crucial resistance level for the stock.
Stop-loss: It is a level to protect against further losses in case of unfavorable movement in the stock prices.
Kalkine Equities LLC, with Delaware File Number 4697384, Foreign Qualification Registration in California File Number 202109211078, and Texas File Number 805521396, is authorized to provide general advice only. The information on https://kalkine.com/ does not take into account any of your investment objectives, financial situation or needs. You should consider the appropriateness of advice taking into account your own objectives, financial situation and needs and seek independent financial advice before making any financial decisions. The link to our Terms and Conditions and Privacy Policy has been provided for your reference. On the date of publishing the reports (mentioned on the website), employees and/or associates of Kalkine do not hold positions in any of the stocks covered on the website. These stocks can change any time and readers of the reports should not consider these stocks as advice or recommendations later.
Past performance is not a reliable indicator of future performance.
 Please wait processing your request...