
Section 1: Company Overview and Fundamentals
1.1 Company Overview:
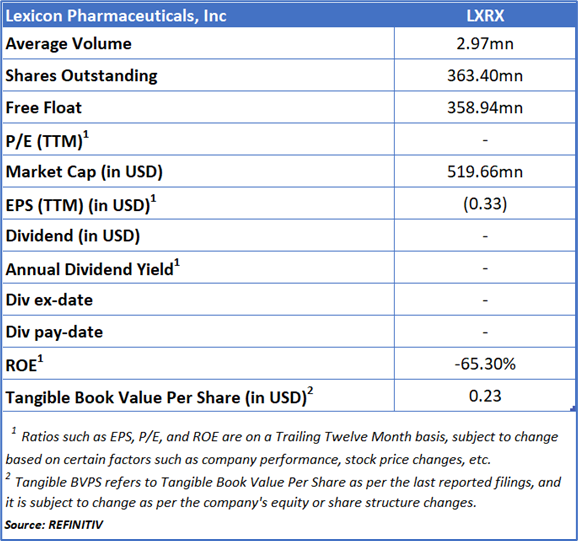
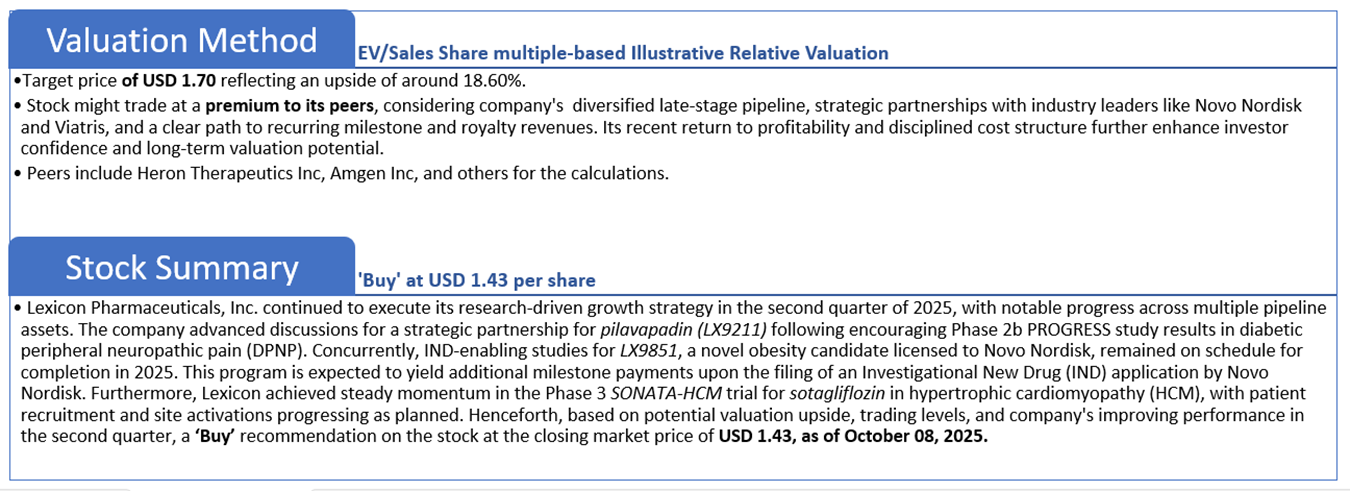
Lexicon Pharmaceuticals, Inc (NASDAQ: LXRX) is a biopharmaceutical company dedicated to advancing the research and development of its key drug candidates—pilavapadin, LX9851, and sotagliflozin—while also focusing on the commercialization of its approved product, INPEFA.
Kalkine’s Diversified Opportunities Report covers the Company Overview, Key positives & negatives, Investment summary, Key investment metrics, Top 10 shareholding, Business updates and insights into company recent financial results, Key Risks & Outlook, Price performance and technical summary, Target Price, and Recommendation on the stock.
Stock Performance:
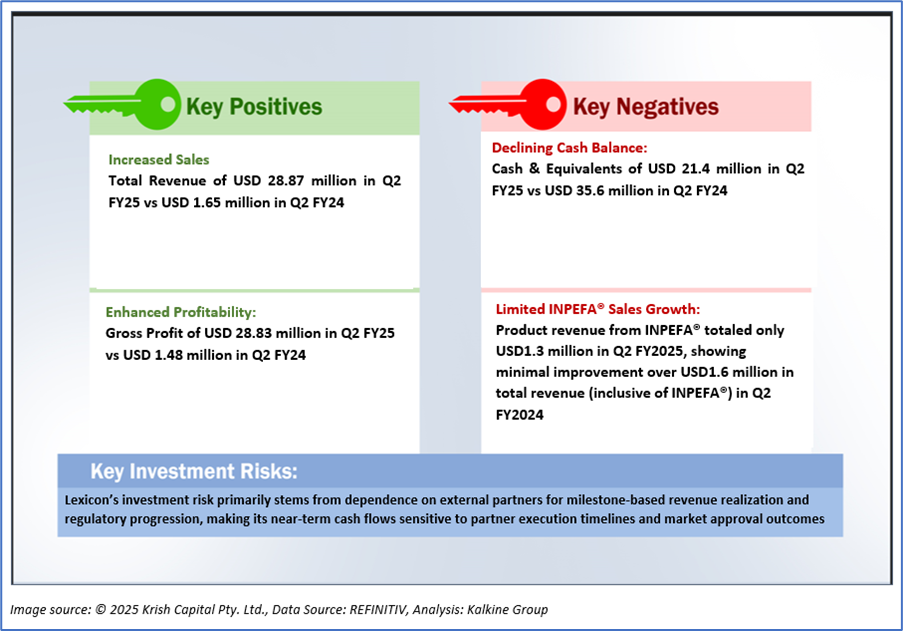
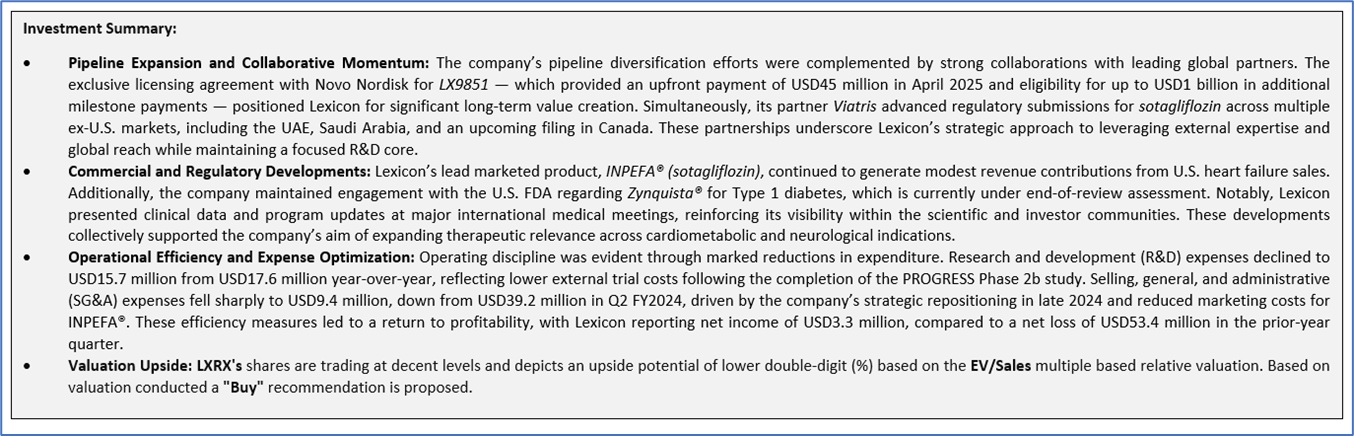
1.2 The Key Positives, Negatives, and Investment summary
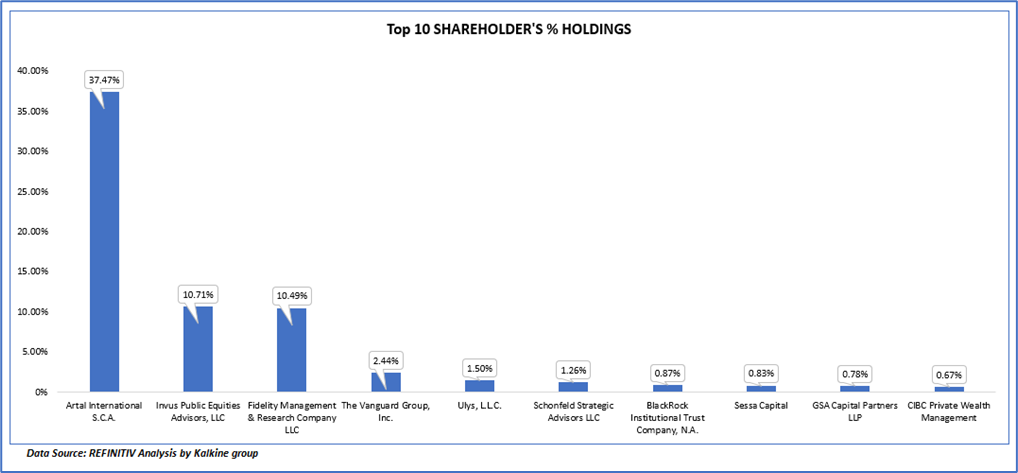
1.3 Top 10 shareholders:
The top 10 shareholders together form ~ 67.03% of the total shareholding, signifying concentrated shareholding. Artal International S.C.A. and Invus Public Equities Advisors, LLC are the biggest shareholders, holding the maximum stake in the company at 37.47% and 10.71%, respectively.
1.4 Key Metrics:
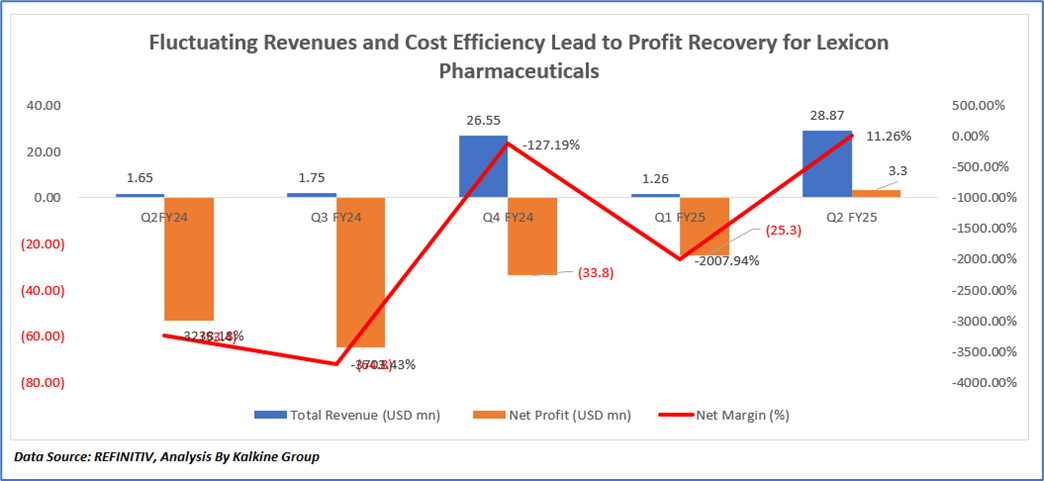
Between Q2 FY2024 and Q2 FY2025, Lexicon Pharmaceuticals experienced substantial fluctuations in financial performance driven largely by licensing revenues and expense management. In Q2 FY2024, the company reported weak revenue of USD 1.65 million, primarily from modest INPEFA® sales, and a net loss of USD 53.4 million with a net margin of -3,238%, reflecting high R&D and SG&A spending tied to ongoing trials and pre-commercialization costs. The trend continued into Q3 FY2024, with revenue marginally increasing to USD 1.75 million and losses widening to USD 67.8 million as product traction remained limited and no new licensing income was recognized. A sharp rebound occurred in Q4 FY2024, when revenue rose to USD 26.55 million following initial licensing revenue recognition from strategic collaborations; however, persistent cost pressures led to another net loss of USD 33.8 million and a margin of -127%. In Q1 FY2025, revenue declined again to USD 1.26 million, resulting in a net loss of USD 25.3 million and a net margin of -2,008%, reflecting the absence of milestone payments and continued R&D spending on pilavapadin and the SONATA-HCM study. A significant turnaround was achieved in Q2 FY2025, when revenue surged to USD 28.87 million, supported by USD 27.5 million in licensing income from Novo Nordisk for LX9851, while SG&A expenses dropped 78% year-over-year to USD 9.4 million. This combination of higher revenue and lower costs enabled Lexicon to report a net income of USD 3.3 million and a positive margin of 11.26%, marking its first profitable quarter after a series of consecutive losses.
Section 2: Business Updates and Corporate Business Highlights
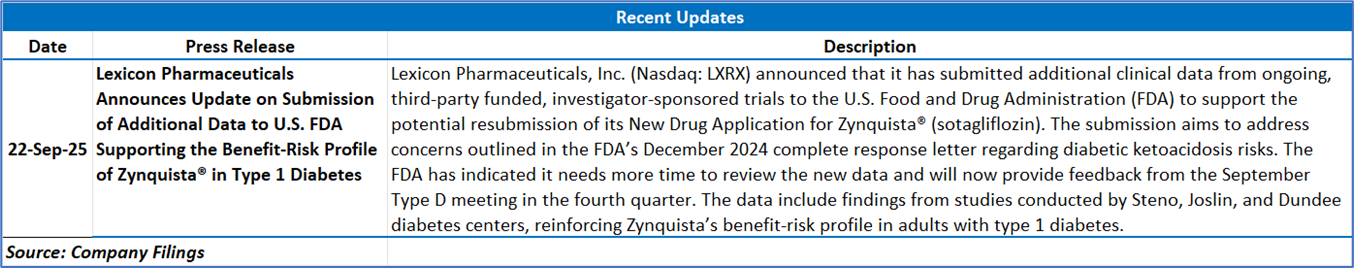
2.1 Recent Business Updates
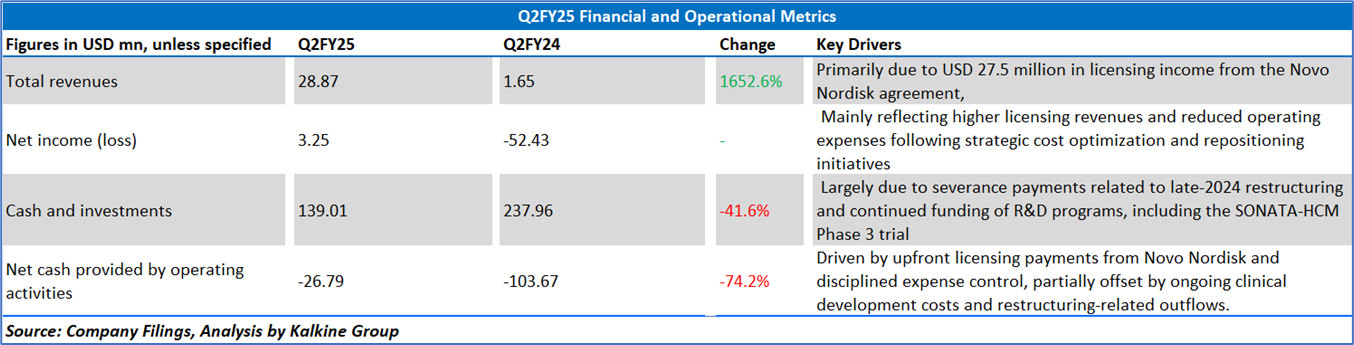
2.2 Insights of Q2FY25:
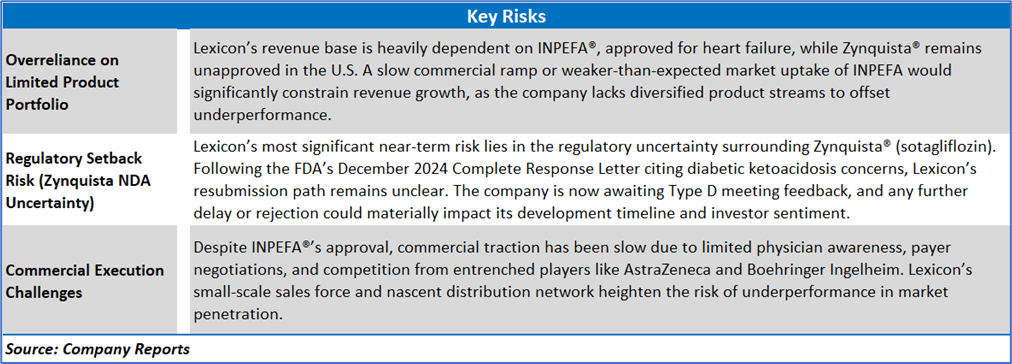
Section 3: Key Risks & Outlook
Section 4: Stock Recommendation Summary:
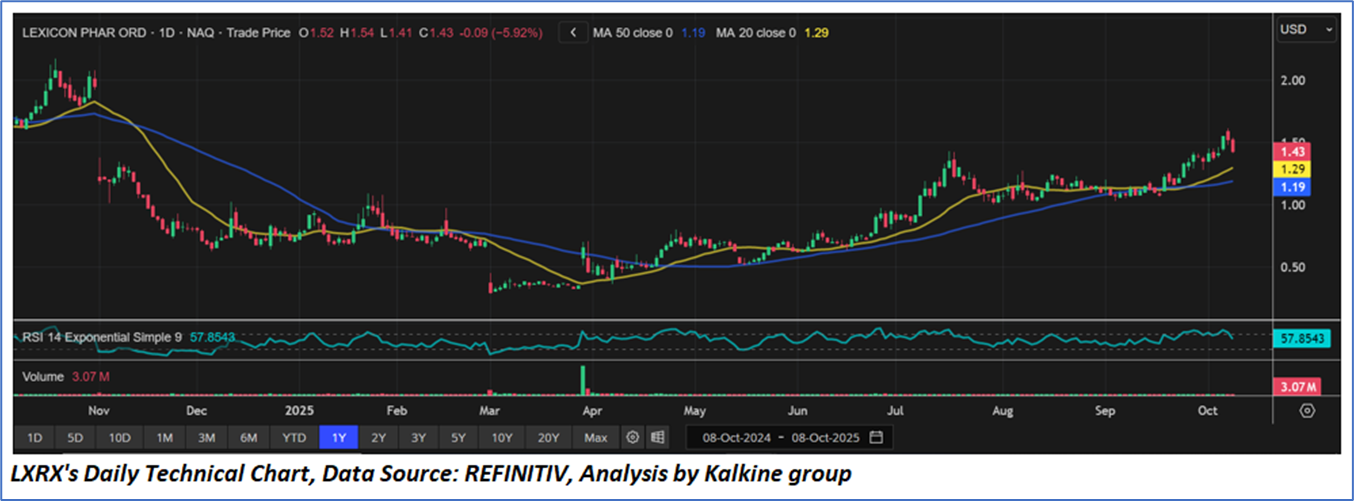
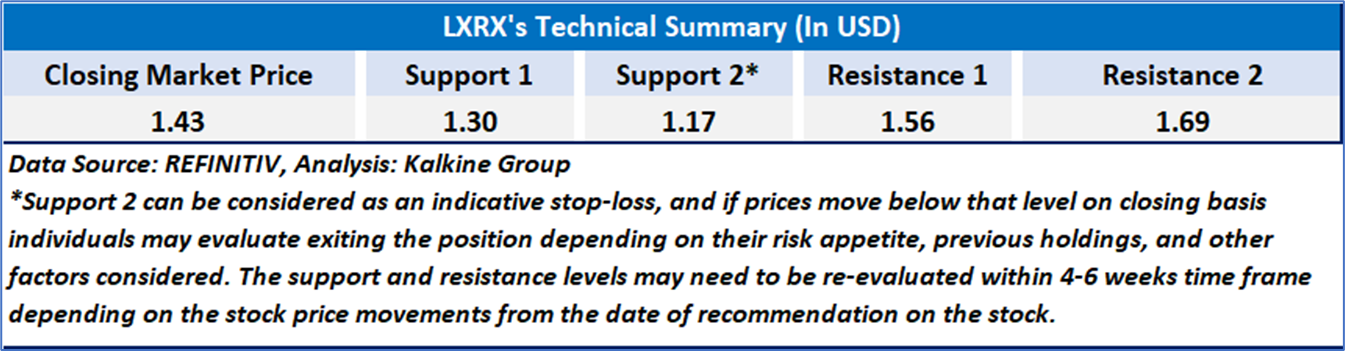
4.1 Price Performance and Technical Summary:
Stock Performance:
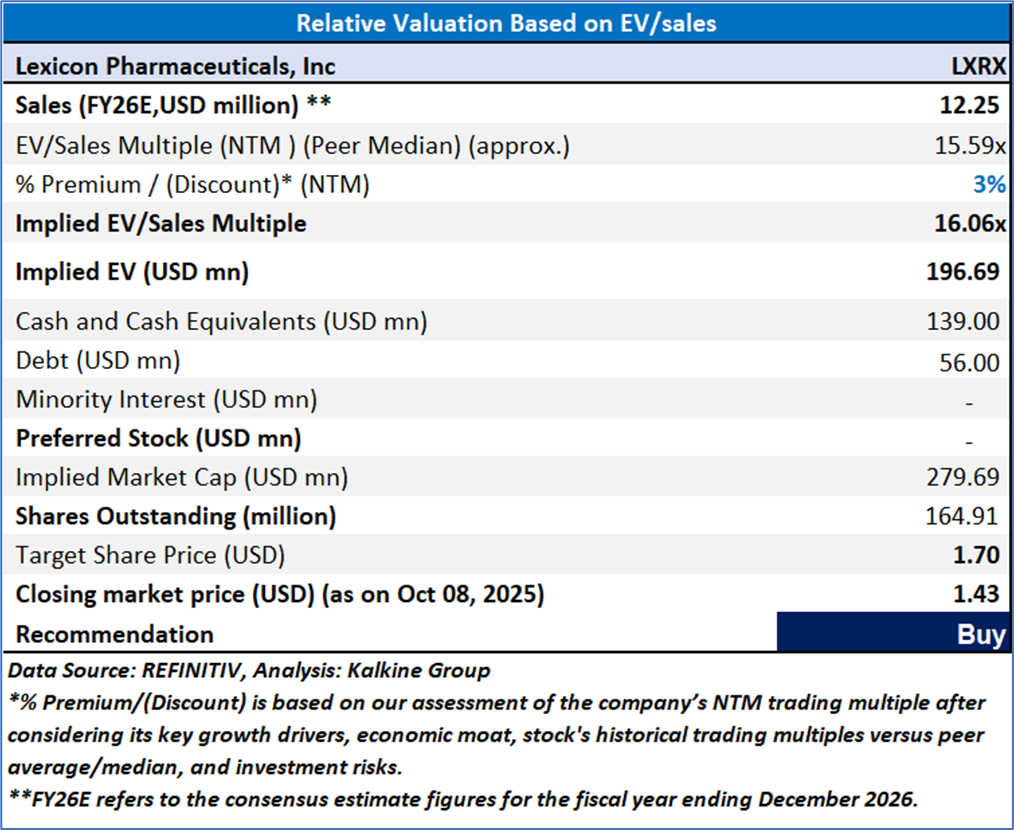
4.2 Fundamental Valuation
Valuation Methodology: EV/Sales Multiple Based Relative Valuation
Markets are trading in a highly volatile zone currently due to certain macroeconomic issues and geopolitical tensions prevailing. Therefore, it is prudent to follow a cautious approach while investing.
Note 1: Past performance is not a reliable indicator of future performance.
Note 2: The reference date for all price data, currency, technical indicators, support, and resistance levels is October 08, 2025. The reference data in this report has been partly sourced from REFINITIV.
Note 3: Investment decisions should be made depending on an individual's appetite for upside potential, risks, holding duration, and any previous holdings. An 'Exit' from the stock can be considered if the Target Price mentioned as per the Valuation and or the technical levels provided has been achieved and is subject to the factors discussed above.
Note 4: The report publishing date is as per the Pacific Time Zone.
Technical Indicators Defined: -
Support: A level at which the stock prices tend to find support if they are falling, and a downtrend may take a pause backed by demand or buying interest. Support 1 refers to the nearby support level for the stock and if the price breaches the level, then Support 2 may act as the crucial support level for the stock.
Resistance: A level at which the stock prices tend to find resistance when they are rising, and an uptrend may take a pause due to profit booking or selling interest. Resistance 1 refers to the nearby resistance level for the stock and if the price surpasses the level, then Resistance 2 may act as the crucial resistance level for the stock.
Stop-loss: It is a level to protect against further losses in case of unfavorable movement in the stock prices.
Kalkine Equities LLC, with Delaware File Number 4697384, Foreign Qualification Registration in California File Number 202109211078, and Texas File Number 805521396, is authorized to provide general advice only. The information on https://kalkine.com/ does not take into account any of your investment objectives, financial situation or needs. You should consider the appropriateness of advice taking into account your own objectives, financial situation and needs and seek independent financial advice before making any financial decisions. The link to our Terms and Conditions and Privacy Policy has been provided for your reference. On the date of publishing the reports (mentioned on the website), employees and/or associates of Kalkine do not hold positions in any of the stocks covered on the website. These stocks can change any time and readers of the reports should not consider these stocks as advice or recommendations later.
Past performance is not a reliable indicator of future performance.
 Please wait processing your request...