
Section 1: Company Overview and Fundamentals
1.1 Company Overview:
Nebius Group NV (NASDAQ: NBIS) is a Netherlands-based technology infrastructure company focused on building and managing assets related to artificial intelligence. The firm aims to establish an AI-centered platform that brings together key components of AI development — including infrastructure, data, and advisory services — on a global scale.
Kalkine’s Diversified Opportunities Report covers the Company Overview, Key positives & negatives, Investment summary, Key investment metrics, Top 10 shareholding, Business updates and insights into company recent financial results, Key Risks & Outlook, Price performance and technical summary, Target Price, and Recommendation on the stock.
Stock Performance:
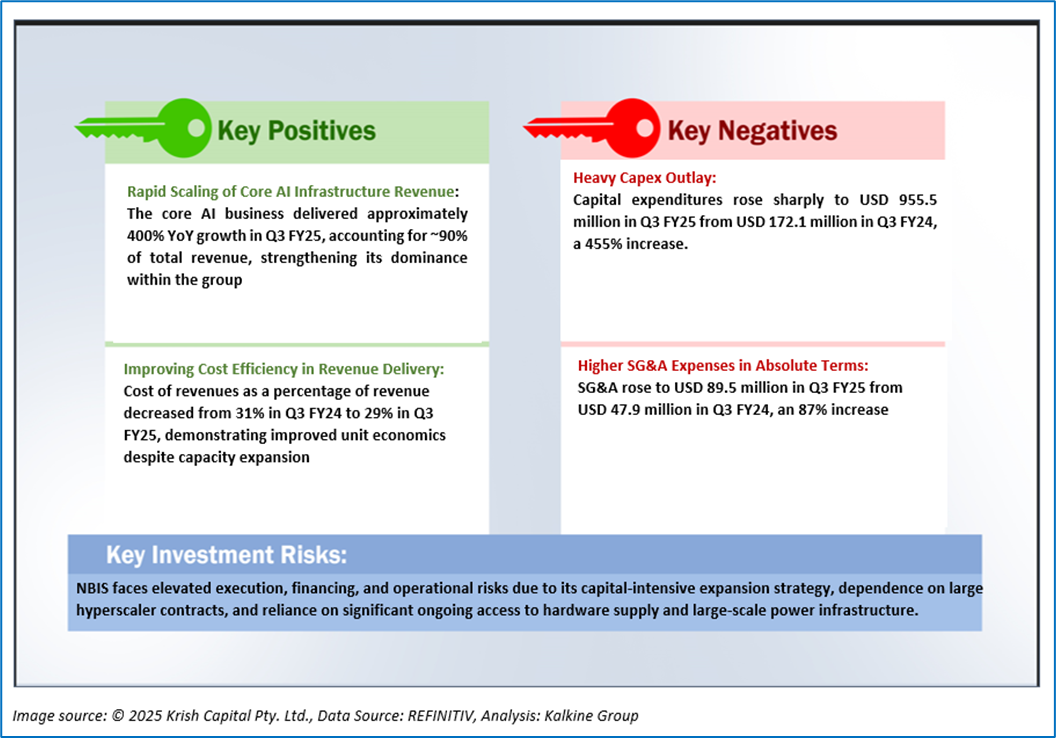
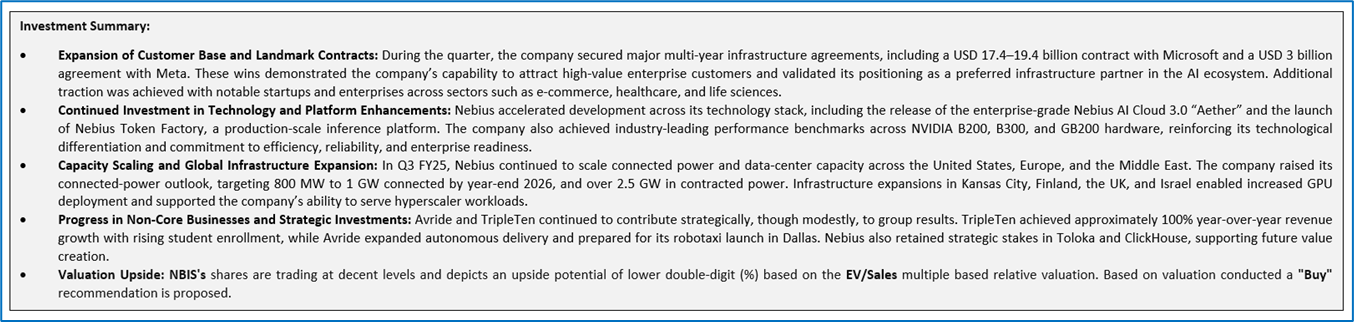
1.2 The Key Positives, Negatives, and Investment summary
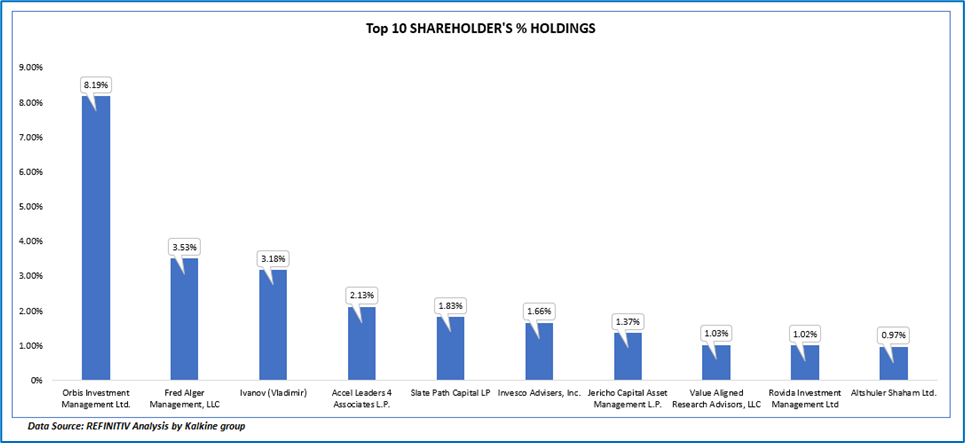
1.3 Top 10 shareholders:
The top 10 shareholders together form ~ 24.92% of the total shareholding, signifying concentrated shareholding. Orbis Investment Management Ltd. and Fred Alger Management, LLC are the biggest shareholders, holding the maximum stake in the company at 8.19% and 3.53%, respectively.
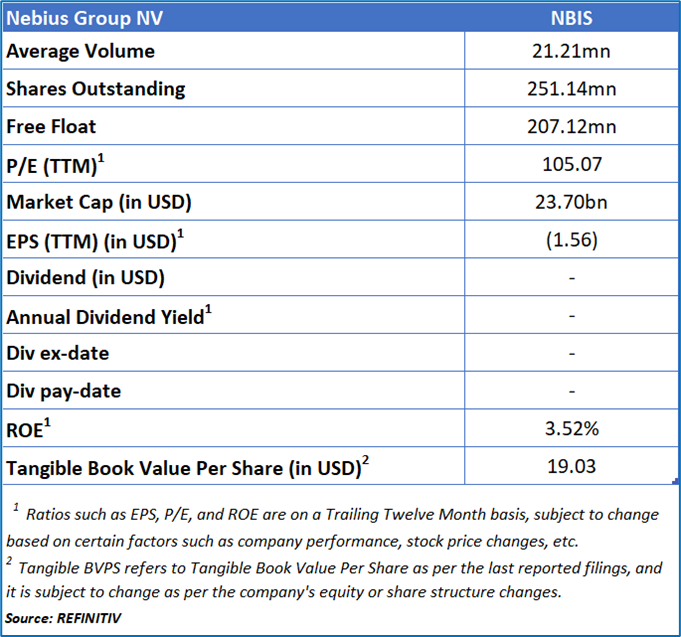
1.4 Key Metrics:
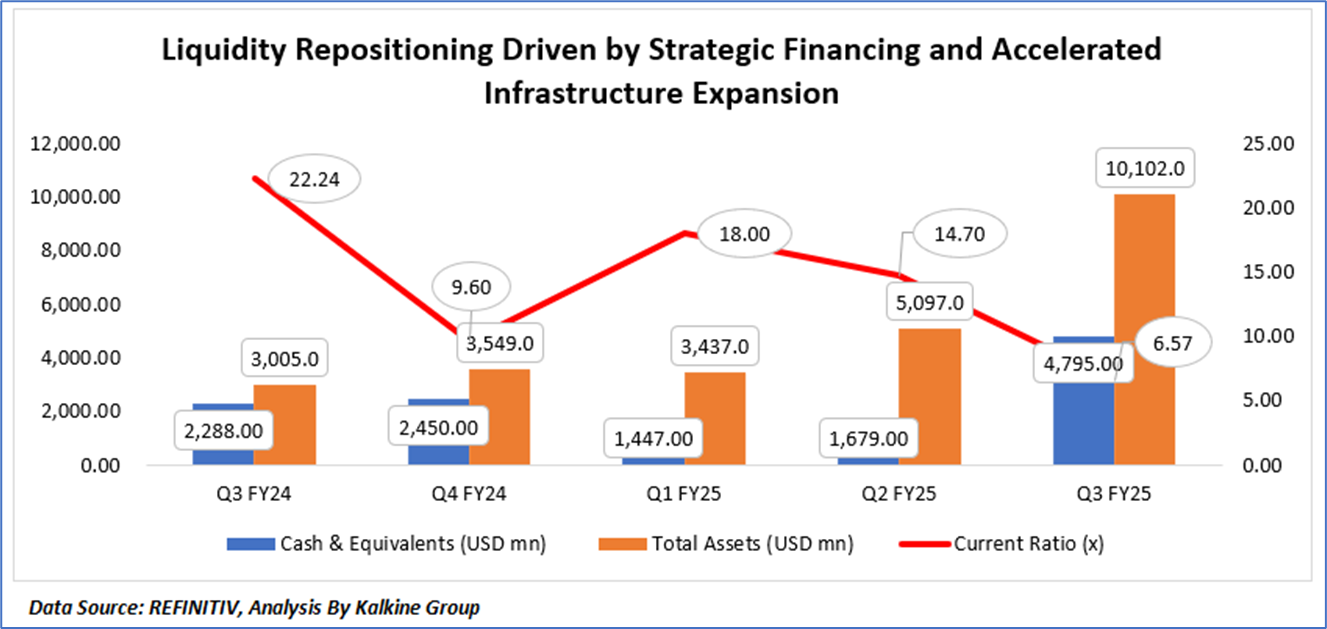
The trend in the chart reflects Nebius’ shift from a divestment-supported liquidity position in FY24 to a capital-intensive, hyper-scaling AI-infrastructure model in FY25, driving pronounced movements in cash, assets, and the current ratio. In FY24, elevated cash levels and an unusually high current ratio were supported by proceeds from discontinued operations and treasury share inflows, as well as limited obligations while the company was still early in its infrastructure buildout. Entering FY25, Nebius accelerated heavy GPU procurement and data-center expansion across the US, Europe and the Middle East, which sharply increased capex, operating expenses and working-capital needs—temporarily suppressing cash balances and lowering the current ratio during Q1–Q2 FY25 despite strong revenue growth. The decisive inflection occurred in Q3 FY25, when the company raised USD 4.3 billion through convertible notes and equity, causing cash to jump from USD 1.68 billion (Q2 FY25) to USD 4.79 billion (Q3 FY25), while at the same time total assets surged to USD 10.1 billion as GPU clusters, data-center capacity, lease assets, and strategic equity stakes were capitalised on the balance sheet. However, this expansion was paired with a steep rise in non-current liabilities—particularly USD 4.09 billion of long-term debt and substantial new lease obligations—resulting in a further decline in the current ratio despite the increase in cash. Higher operating cash outflows, driven by increased receivables, VAT reclaimable balances, elevated payroll and R&D spending, and the scale-up of enterprise-ready products like Aether and the Token Factory, reinforced liquidity pressure within the quarter. Overall, the chart captures Nebius’ rapid transformation: liquidity initially buoyed by divestment proceeds, then compressed by accelerated scaling, and ultimately rebuilt through major financing events—while total assets ballooned due to massive infrastructure investment and the current ratio normalized as the company absorbed substantial long-term obligations required to support multi-billion-dollar hyperscaler contracts and global AI-compute demand.
Section 2: Business Updates and Corporate Business Highlights
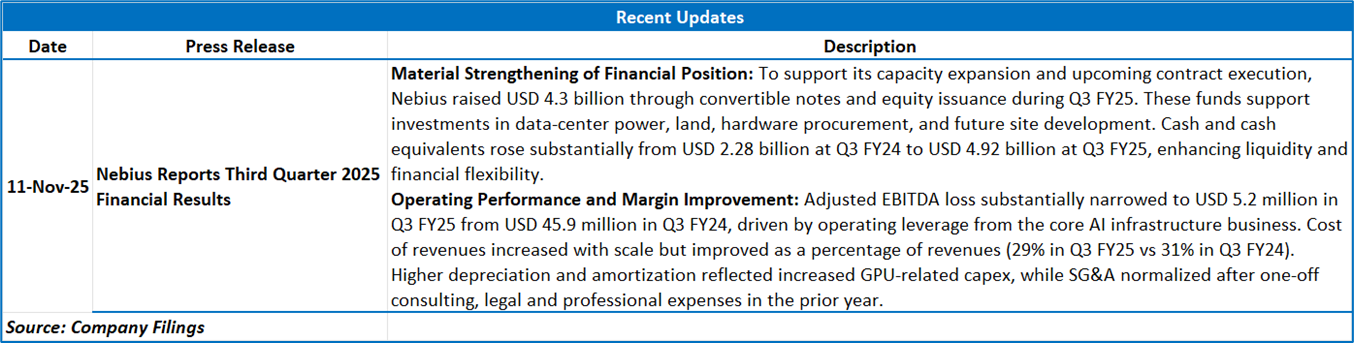
2.1 Recent Business Updates
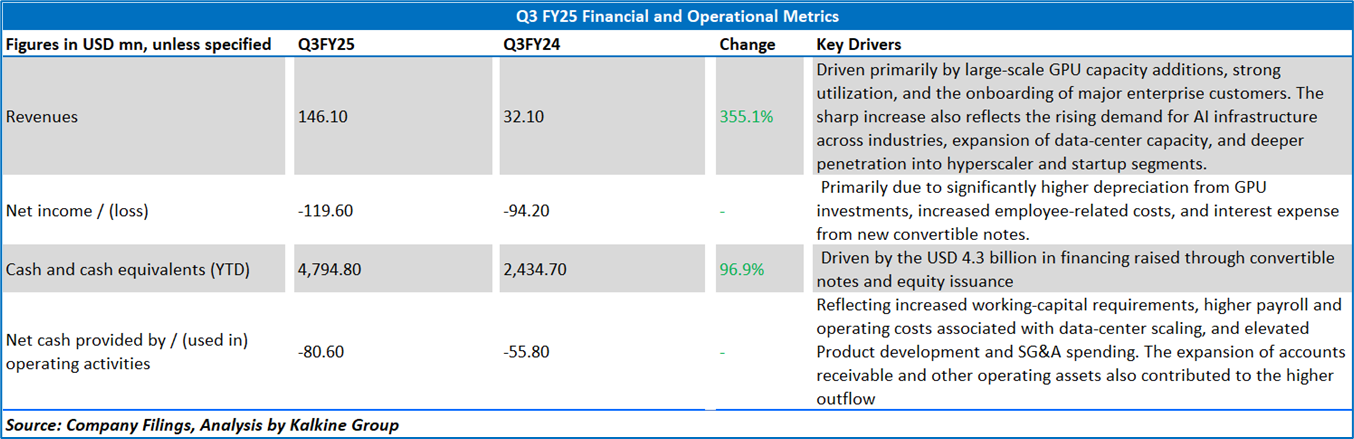
2.2 Insights of Q3FY25:
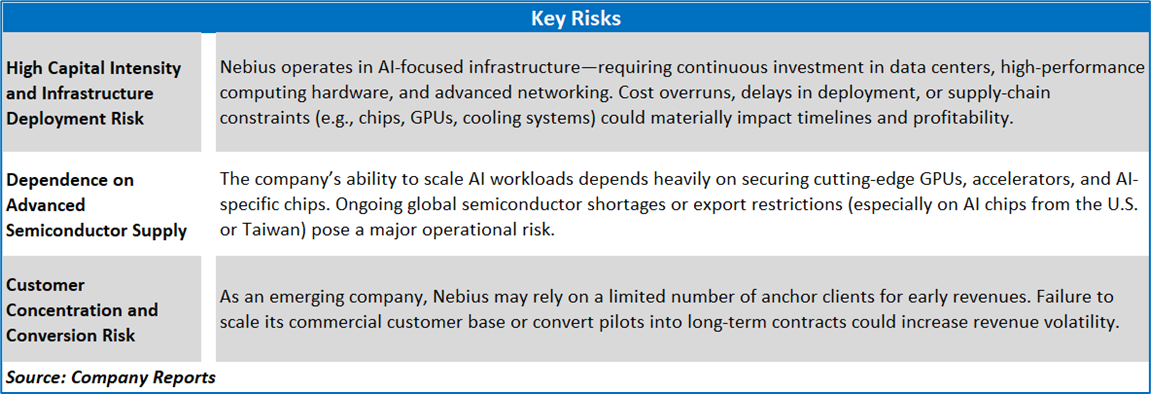
Section 3: Key Risks & Outlook
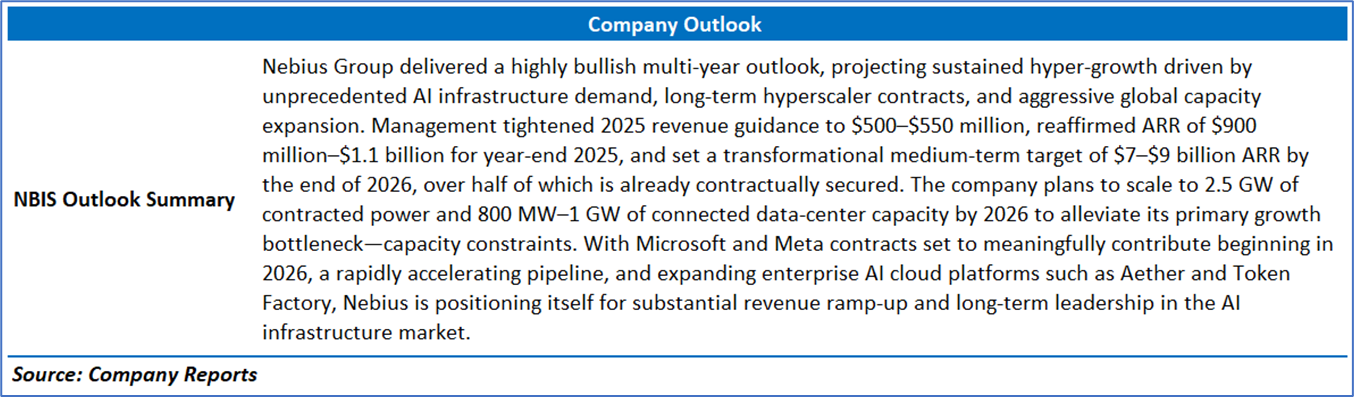
Section 4: Stock Recommendation Summary:
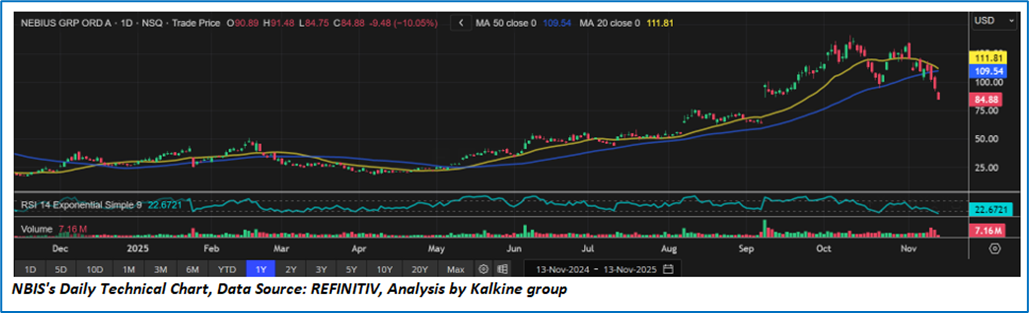
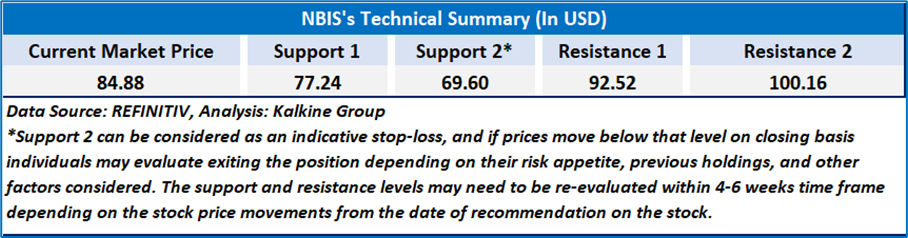
4.1 Price Performance and Technical Summary:
Stock Performance:
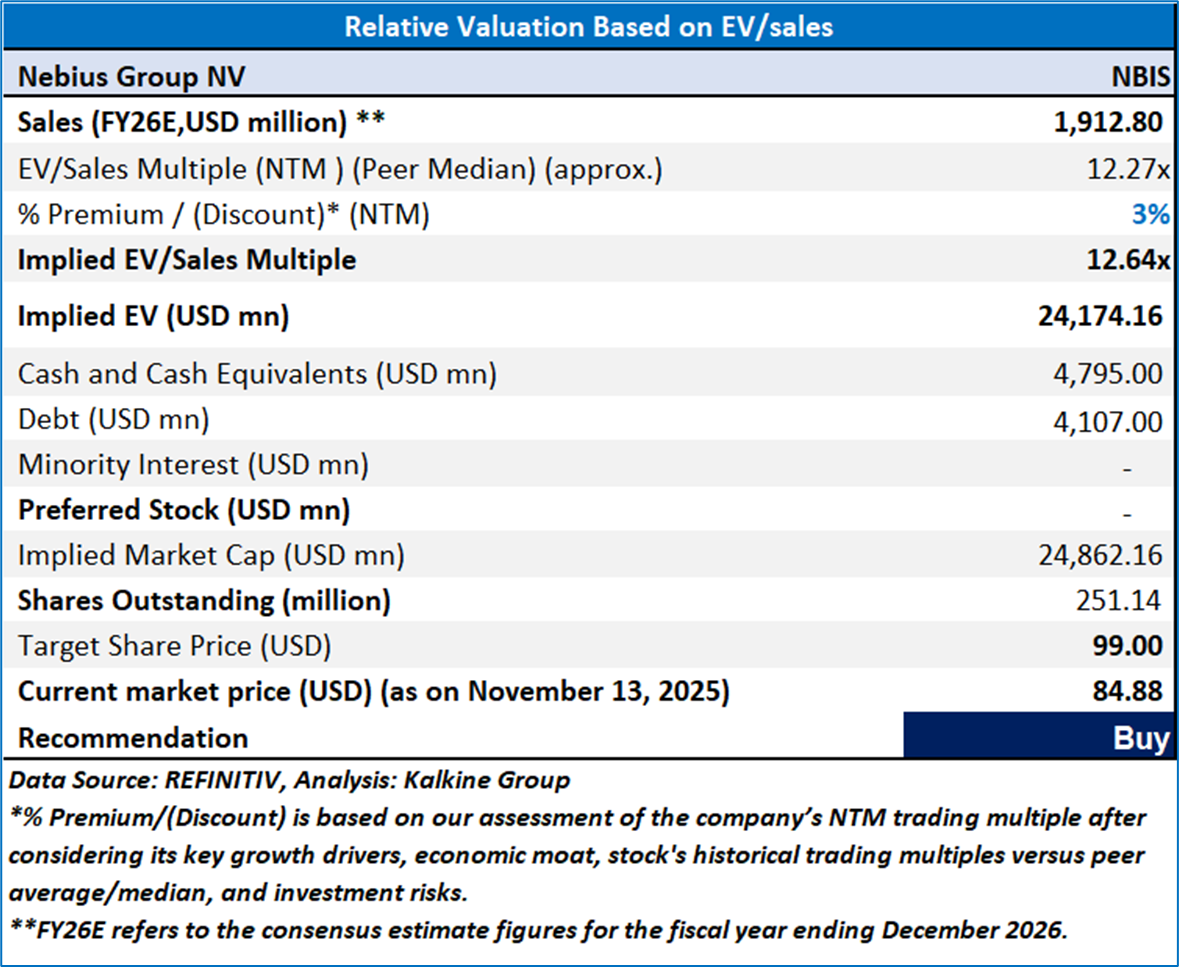
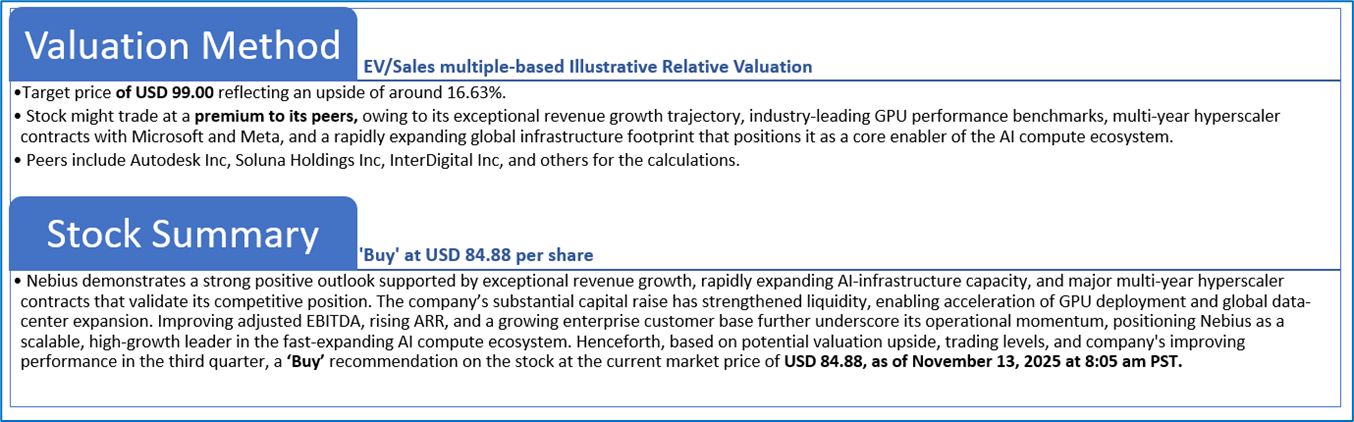
4.2 Fundamental Valuation
Valuation Methodology: EV/Sales Multiple Based Relative Valuation
Markets are trading in a highly volatile zone currently due to certain macroeconomic issues and geopolitical tensions prevailing. Therefore, it is prudent to follow a cautious approach while investing.
Note 1: Past performance is not a reliable indicator of future performance.
Note 2: The reference date for all price data, currency, technical indicators, support, and resistance levels is November 13, 2025. The reference data in this report has been partly sourced from REFINITIV.
Note 3: Investment decisions should be made depending on an individual's appetite for upside potential, risks, holding duration, and any previous holdings. An 'Exit' from the stock can be considered if the Target Price mentioned as per the Valuation and or the technical levels provided has been achieved and is subject to the factors discussed above.
Note 4: The report publishing date is as per the Pacific Time Zone.
Technical Indicators Defined: -
Support: A level at which the stock prices tend to find support if they are falling, and a downtrend may take a pause backed by demand or buying interest. Support 1 refers to the nearby support level for the stock and if the price breaches the level, then Support 2 may act as the crucial support level for the stock.
Resistance: A level at which the stock prices tend to find resistance when they are rising, and an uptrend may take a pause due to profit booking or selling interest. Resistance 1 refers to the nearby resistance level for the stock and if the price surpasses the level, then Resistance 2 may act as the crucial resistance level for the stock.
Stop-loss: It is a level to protect against further losses in case of unfavorable movement in the stock prices.
Kalkine Equities LLC, with Delaware File Number 4697384, Foreign Qualification Registration in California File Number 202109211078, and Texas File Number 805521396, is authorized to provide general advice only. The information on https://kalkine.com/ does not take into account any of your investment objectives, financial situation or needs. You should consider the appropriateness of advice taking into account your own objectives, financial situation and needs and seek independent financial advice before making any financial decisions. The link to our Terms and Conditions and Privacy Policy has been provided for your reference. On the date of publishing the reports (mentioned on the website), employees and/or associates of Kalkine do not hold positions in any of the stocks covered on the website. These stocks can change any time and readers of the reports should not consider these stocks as advice or recommendations later.
Past performance is not a reliable indicator of future performance.
 Please wait processing your request...