Explore 3 Stock Ideas & Industry Insights Download Free Report

Apr 23, 2026

  • NU:NYSE
  • Investment Type
    Large-cap
  • Risk Level
  • Action
  • Rec. Price (US$)

Section 1: Company Overview and Fundamentals

Company Overview:

Nu Holdings Ltd (NYSE: NU) is a Brazil-based holding company, which engages in the provision of digital banking services. The Company offers its customers products throughout the five financial seasons: spending, saving, investing, borrowing, and protecting. Its spending solutions are designed to help customers pay for goods and services in their everyday lives with a customized credit line or instantly through a mobile phone, while collecting loyalty points and rewards on applicable transactions.

Kalkine’s Diversified Opportunities Report covers the Company Overview, Key positives & negatives, Investment summary, Key investment metrics, Top 10 shareholding, Business updates and insights into company recent financial results, Key Risks & Outlook, Price performance and technical summary, Target Price, and Recommendation on the stock.
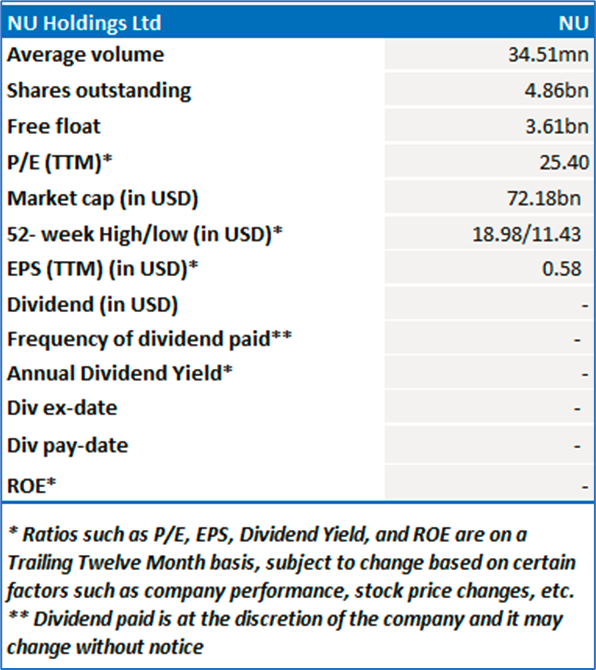
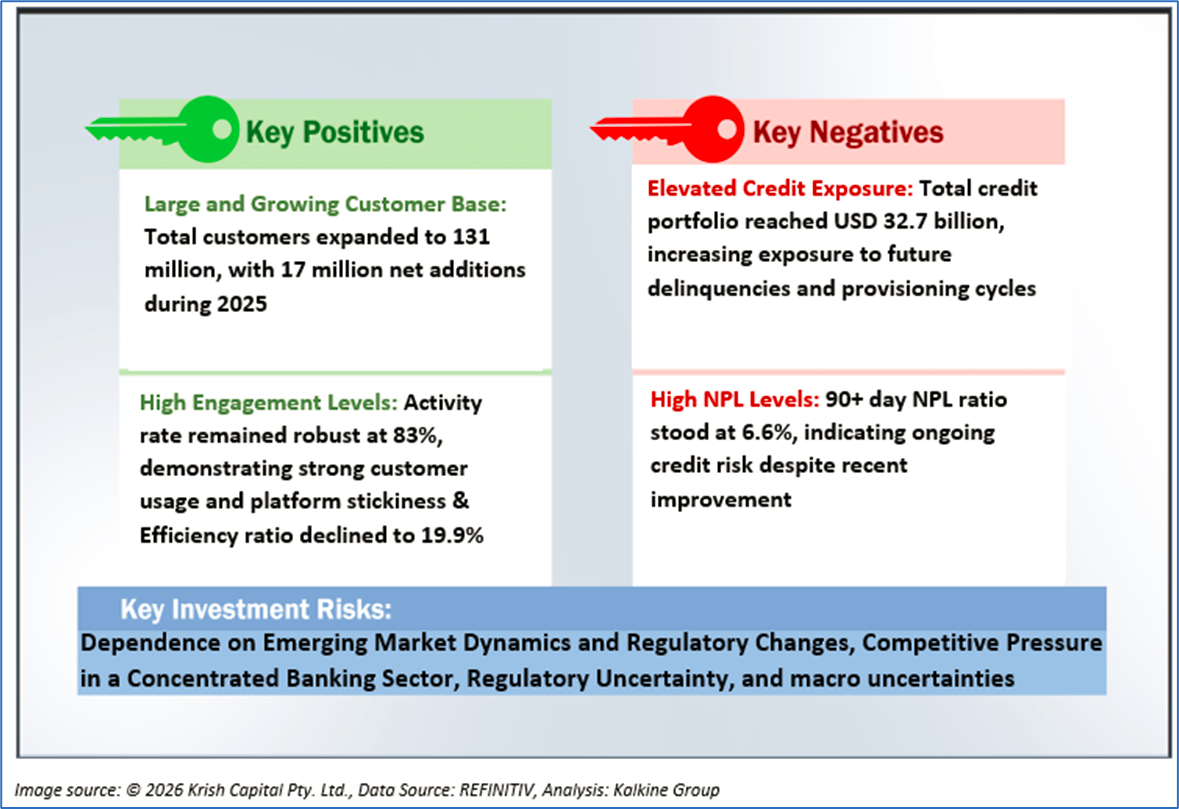
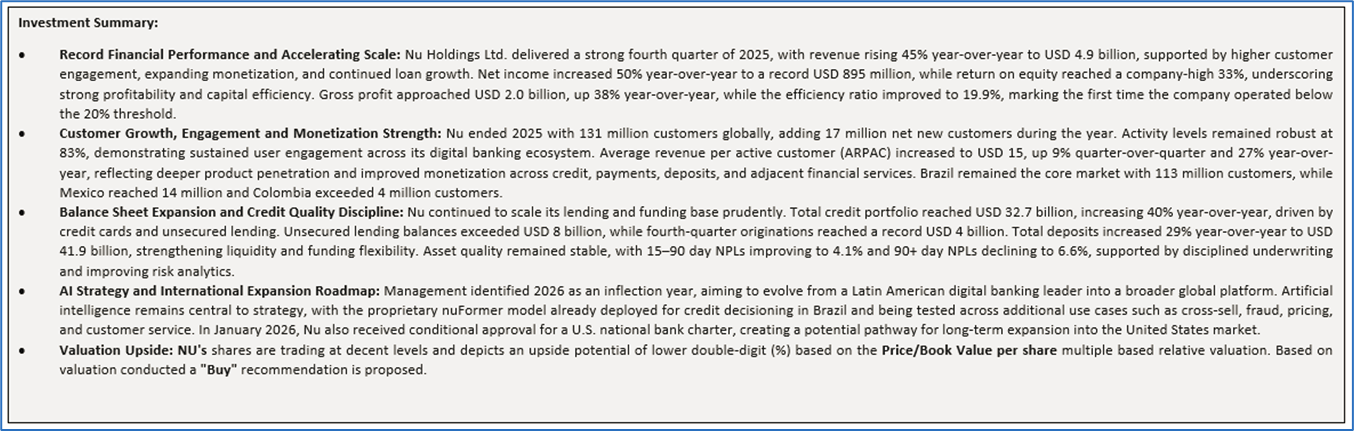
1.2 The Key Positives, Negatives, and Investment summary
  

1.3 Top 10 shareholders:

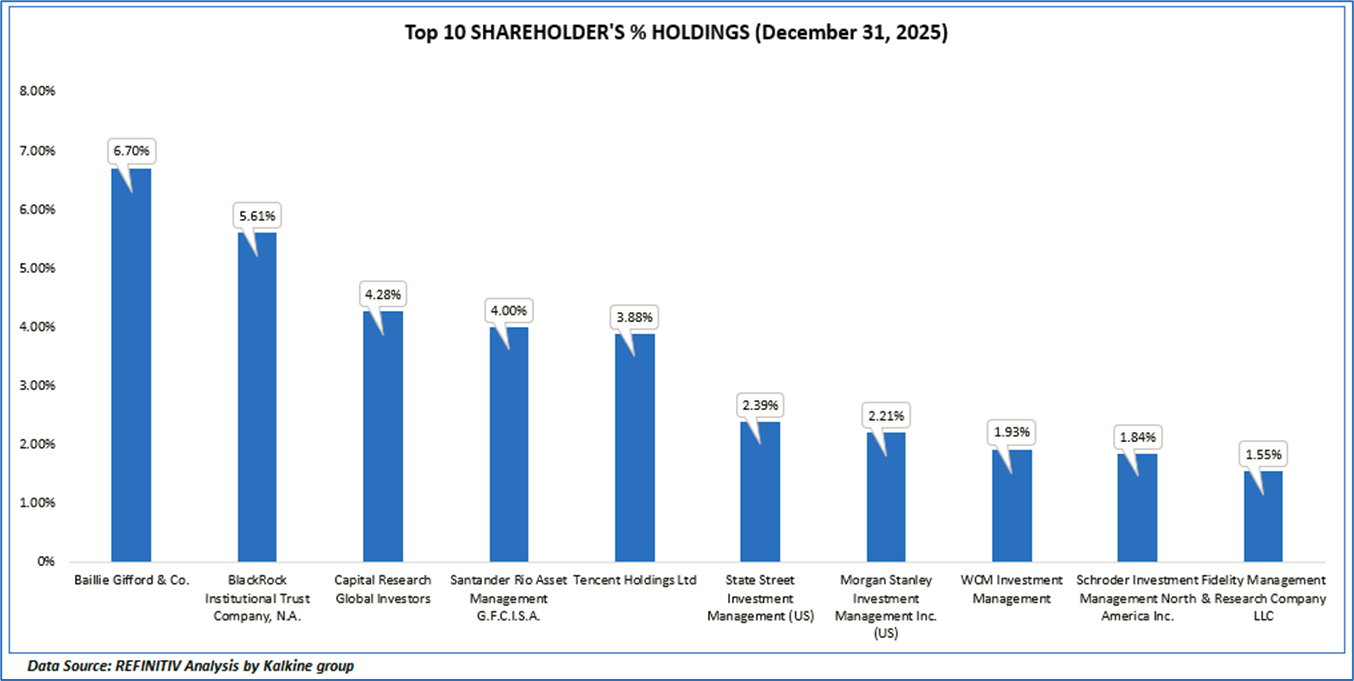
The top 10 shareholders together form ~34.38% of the total shareholding, signifying concentrated shareholding. Baillie Gifford & Co., and BlackRock Institutional Trust Company, N.A., are the biggest shareholders, holding the maximum stake in the company at 6.70% and 5.61%, respectively.
1.4 Key Metrics:
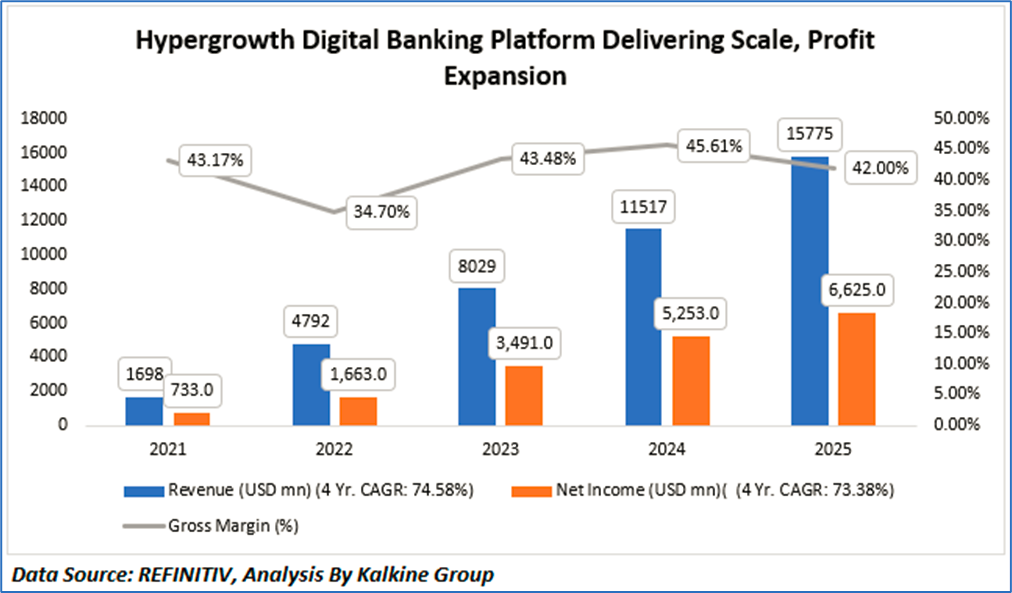
  • Revenue Growth Trajectory: Nu Holdings has delivered exceptional multi-year top-line expansion, with revenue increasing from USD 1,698 million in 2021 to USD 15,775 million in 2025, representing a strong 4-year CAGR of 74.58%. Revenue expanded more than ninefold over the period, highlighting the success of its digital banking model, rapid customer acquisition, deeper engagement, and increasing monetization across Latin America. Annual revenue progression remained consistently robust, rising to USD 4,792 million in 2022, USD 8,029 million in 2023, USD 11,517 million in 2024, and USD 15,775 million in 2025, demonstrating sustained scale benefits and strong execution across products and geographies.
  • Net Income Expansion and Profitability Scale-Up: Net income growth has closely mirrored revenue momentum, increasing from USD 733 million in 2021 to USD 6,625 million in 2025, implying a substantial 4-year CAGR of 73.38%. Earnings growth of this magnitude reflects expanding operating leverage, improving customer monetization, disciplined credit underwriting, and a scalable low-cost operating model. Net income rose sharply to USD 1,663 million in 2022, USD 3,491 million in 2023, USD 5,253 million in 2024, and USD 6,625 million in 2025, indicating that Nu has been able to convert rapid growth into increasing bottom-line profitability rather than sacrificing earnings for expansion.
  • Gross Margin Performance and Efficiency Trends: Nu’s gross margin profile has remained healthy, though moderately variable over the period. Gross margin stood at 17% in 2021, declined to 34.70% in 2022 during a high-growth investment phase, then recovered strongly to 43.48% in 2023 and 45.61% in 2024, before moderating to 42.00% in 2025. The recovery from 2022 levels suggests improving operational efficiency, better funding economics, and higher-margin monetization streams. While the 2025 moderation may reflect product mix shifts, geographic expansion, or investment in newer growth vectors, margins remain structurally solid for a high-growth fintech platform.
  • Scalability of the Digital Banking Model: The financial trajectory indicates that Nu’s business model benefits significantly from scale economics. Revenue and earnings have expanded at similar rates, suggesting management has maintained cost discipline while continuing to invest in growth initiatives. The combination of rapid top-line growth, strong net income conversion, and resilient gross margins implies that Nu’s customer acquisition engine, cross-selling capabilities, and digital-first infrastructure continue to create meaningful competitive advantages versus traditional banking peers

Section 2: Business Updates and Corporate Business Highlights

2.1 Recent Updates:

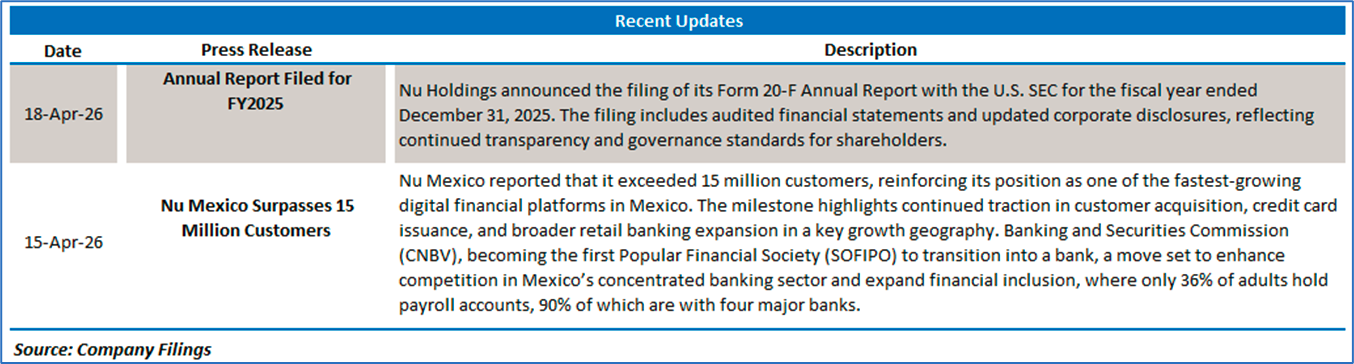
The below picture gives an overview of the recent updates:
 2.2 Insights of FY25:
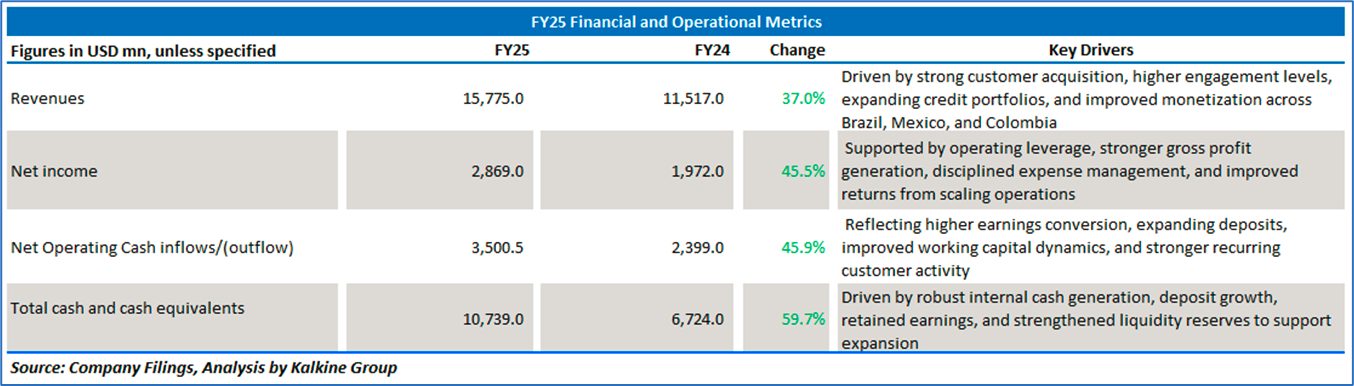
Section 3: Key Risks & Outlook
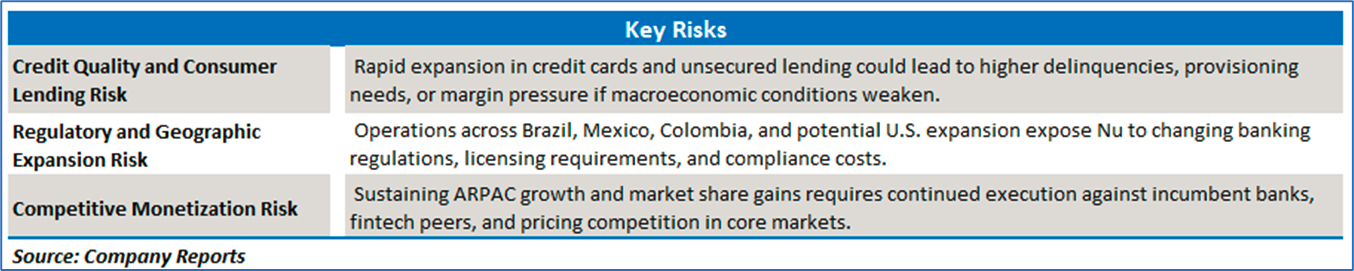
  

Section 4: Stock Recommendation Summary:

4.1 Price Performance and Technical Summary:

Stock Performance:
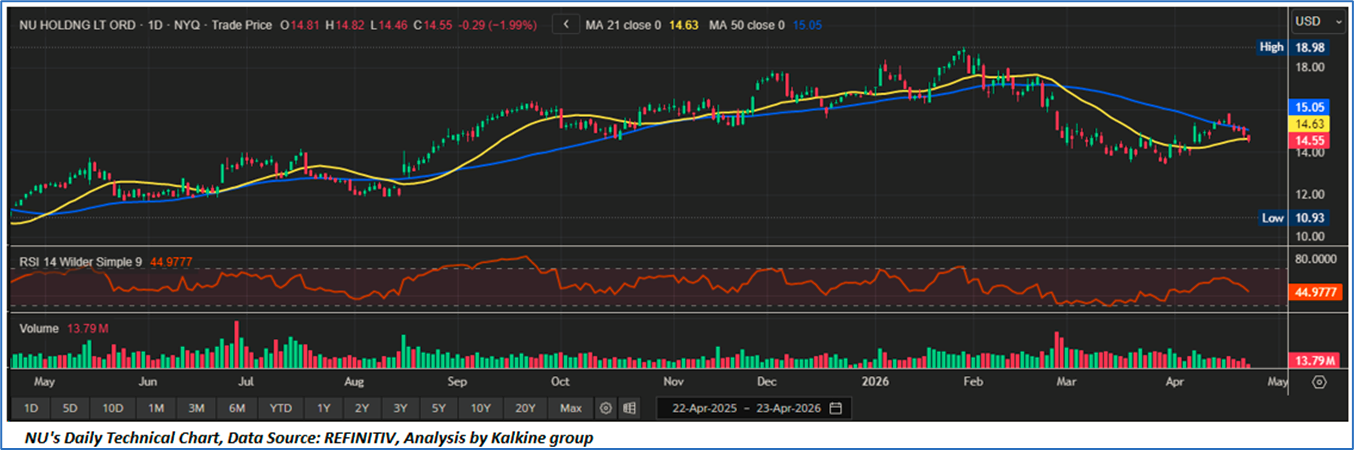
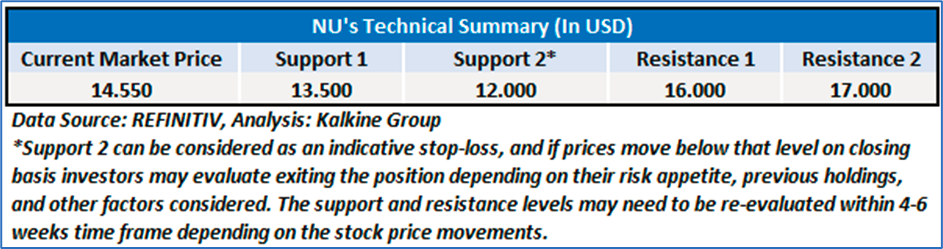
  • Trend Structure and Intermediate Consolidation: NU remains within a broader medium-term uptrend, though price action has recently transitioned into a consolidation phase after failing to sustain the February peak near USD 18.98. The stock is currently trading at USD 14.55, marginally below the 21-day moving average at USD 14.63 and below the 50-day moving average at USD 15.05, indicating near-term momentum has softened. However, the longer-term structure of higher lows from the 2024 base remains largely intact, suggesting the recent retracement is corrective rather than definitively trend-breaking. The inability to reclaim the 50-day average yet signals that buyers have not fully reasserted control, leaving the stock in a neutral-to-cautious technical posture.
  • Momentum, Participation and Internal Conditions: Momentum indicators have cooled materially, with the 14-day RSI near 44.98, placing the oscillator below the neutral 50 threshold but still above oversold territory. This implies selling pressure has moderated, yet bullish momentum remains insufficient for a decisive upside breakout. Volume trends appear relatively contained during the latest pullback, suggesting the decline has not been driven by aggressive institutional liquidation. Instead, the current setup resembles digestion of prior gains following the strong rally into early 2026. A sustained RSI recovery back above 50 would be an important confirmation that internal momentum is turning constructive again.
  • Key Levels, Tactical Setup and Forward Bias: From a tactical perspective, immediate support is located near the USD 14.00–14.20 region, followed by stronger structural demand around USD 13.00. A break below these zones could expose downside risk toward the prior major low near USD 10.93. On the upside, first resistance is the 50-day moving average at USD 15.05, followed by the more significant USD 16.00–16.50 supply band. A decisive reclaim of these levels would improve the probability of a renewed advance toward USD 18.00+. Until then, NU is likely to remain range-bound, with the medium-term bias modestly constructive but awaiting confirmation through stronger momentum and moving-average recovery.   

 4.2 Fundamental Valuation

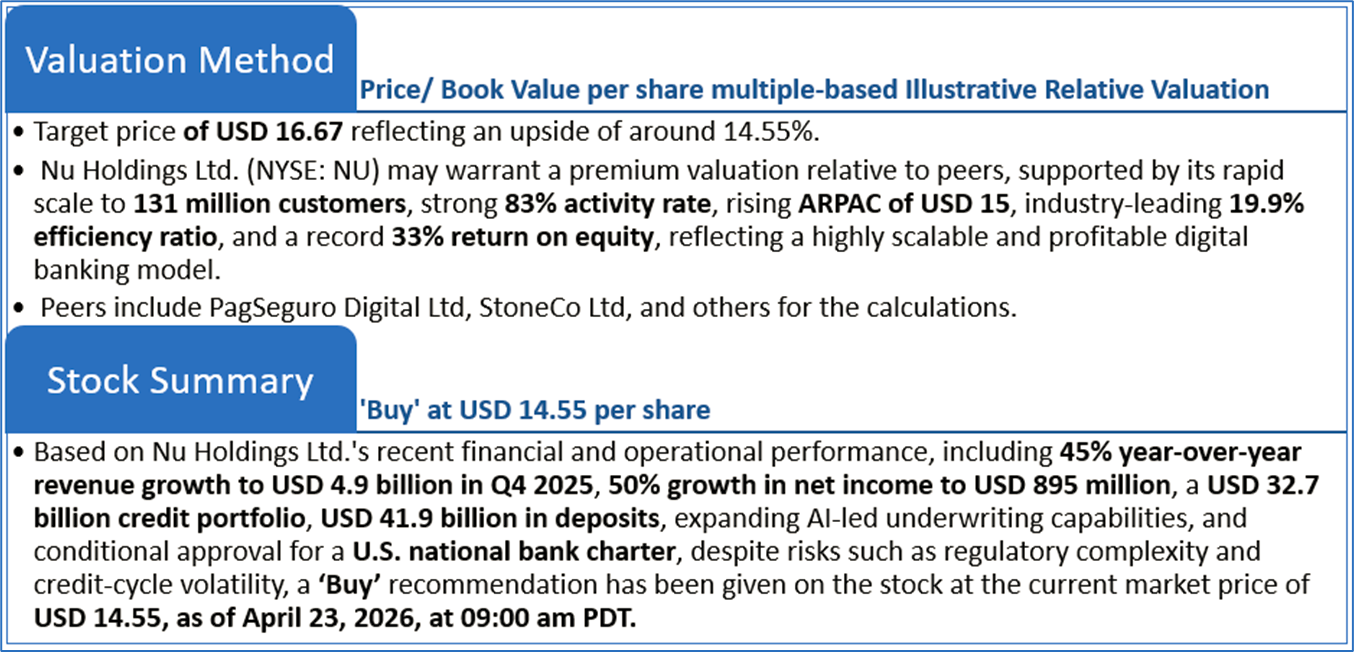
Valuation Methodology: Price/ Book Value per share Multiple Based Relative Valuation
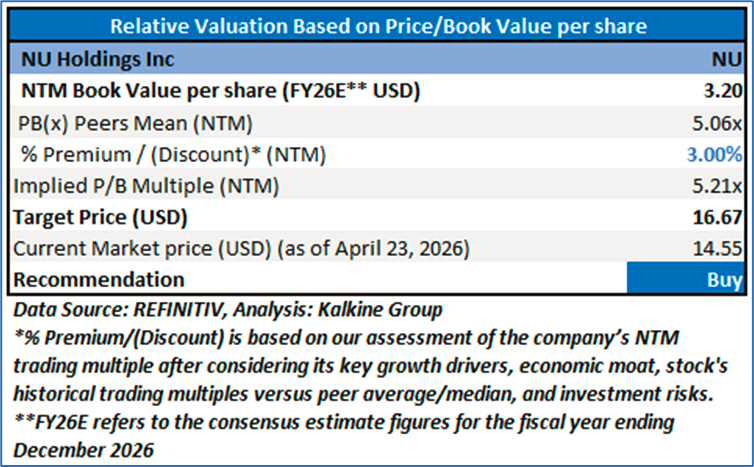
   

Markets are trading in a highly volatile zone currently due to certain macroeconomic issues and geopolitical tensions prevailing. Therefore, it is prudent to follow a cautious approach while investing.

Note 1: Past performance is not a reliable indicator of future performance.

Note 2: The reference date for all price data, currency, technical indicators, support, and resistance levels is April 23, 2026. The reference data in this report has been partly sourced from REFINITIV.

Note 3: Investment decisions should be made depending on an individual's appetite for upside potential, risks, holding duration, and any previous holdings. An 'Exit' from the stock can be considered if the Target Price mentioned as per the Valuation and or the technical levels provided has been achieved and is subject to the factors discussed above.

Note 4: The report publishing date is as per the Pacific Time Zone.

Technical Indicators Defined: -

Support: A level at which the stock prices tend to find support if they are falling, and a downtrend may take a pause backed by demand or buying interest. Support 1 refers to the nearby support level for the stock and if the price breaches the level, then Support 2 may act as the crucial support level for the stock.

 Resistance: A level at which the stock prices tend to find resistance when they are rising, and an uptrend may take a pause due to profit booking or selling interest. Resistance 1 refers to the nearby resistance level for the stock and if the price surpasses the level, then Resistance 2 may act as the crucial resistance level for the stock.

 Stop-loss: It is a level to protect against further losses in case of unfavorable movement in the stock prices.


Disclaimer-

Kalkine Equities LLC, with Delaware File Number 4697384, Foreign Qualification Registration in California File Number 202109211078, and Texas File Number 805521396, is authorized to provide general advice only. The information on https://kalkine.com/ does not take into account any of your investment objectives, financial situation or needs. You should consider the appropriateness of advice taking into account your own objectives, financial situation and needs and seek independent financial advice before making any financial decisions. The link to our Terms and Conditions  and Privacy Policy has been provided for your reference. On the date of publishing the reports (mentioned on the website), employees and/or associates of Kalkine do not hold positions in any of the stocks covered on the website. These stocks can change any time and readers of the reports should not consider these stocks as advice or recommendations later.

Past performance is not a reliable indicator of future performance.

Support

Hi! How can we help you today?

Loading…