
Kalkine’s Global Travel & Leisure Report offers a comprehensive view of the key companies and evolving trends across the travel value chain covering countries including US, Canada, Australia, UK, and New Zealand. This includes airlines, hospitality chains, digital travel platforms, as well as the rapidly growing leisure, entertainment, and gaming segments that are redefining the way people engage with travel experiences.

Global Hotel and Resorts Market: A Dynamic Growth Trajectory:

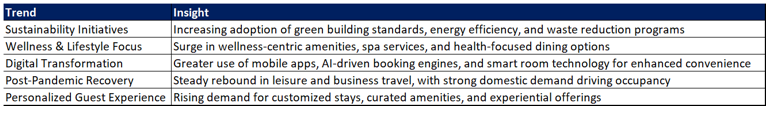

Between 2020 and 2024, the global hotel industry demonstrated a remarkable trajectory of recovery and growth:
Kalkine’s Global Travel & Leisure Report covers the Investment Highlights, Key Financial Metrics, Risks, Technical Analysis along with the Valuation, Target Price, and Recommendation on Park Hotels & Resorts Inc (NYSE: PK).
Section 1: Company Overview and Fundamentals Insights
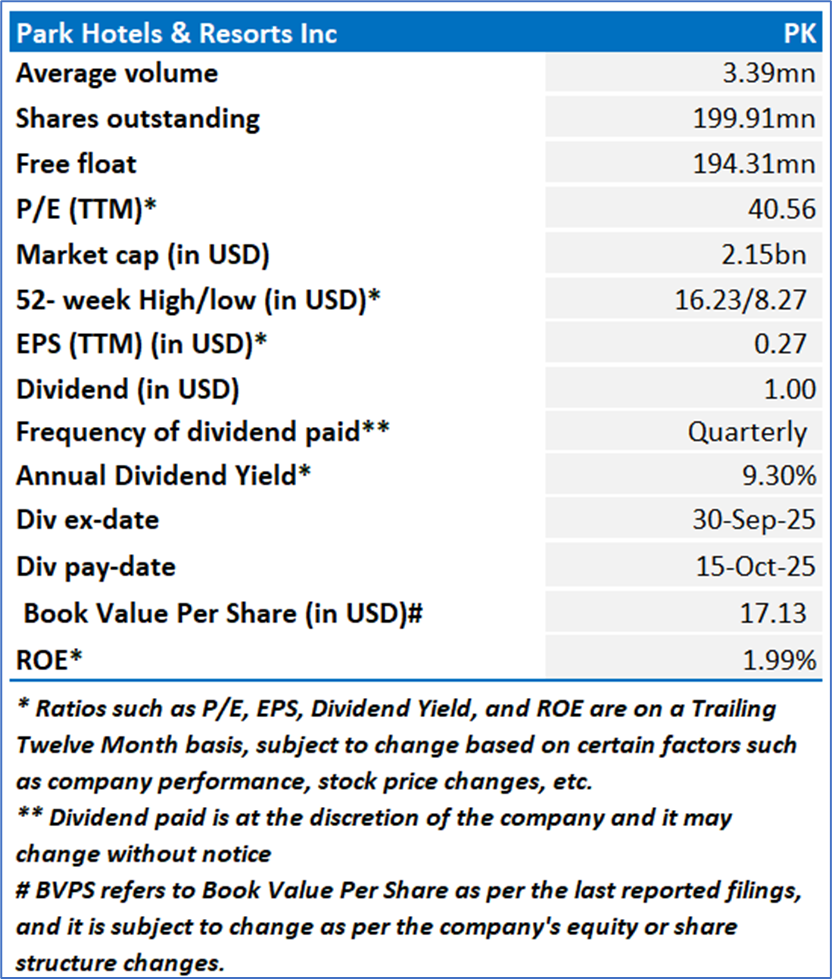
Company Overview: Park Hotels & Resorts Inc (NYSE: PK) operates as a lodging-focused real estate investment trust (REIT), managing a broad portfolio of hotels and resorts that hold substantial real estate value.
Kalkine’s Global Travel and Leisure Report covers the Investment Highlights, Key Financial Metrics, Risks, and Technical Analysis along with the Valuation, Target Price, and Recommendation on the stock.
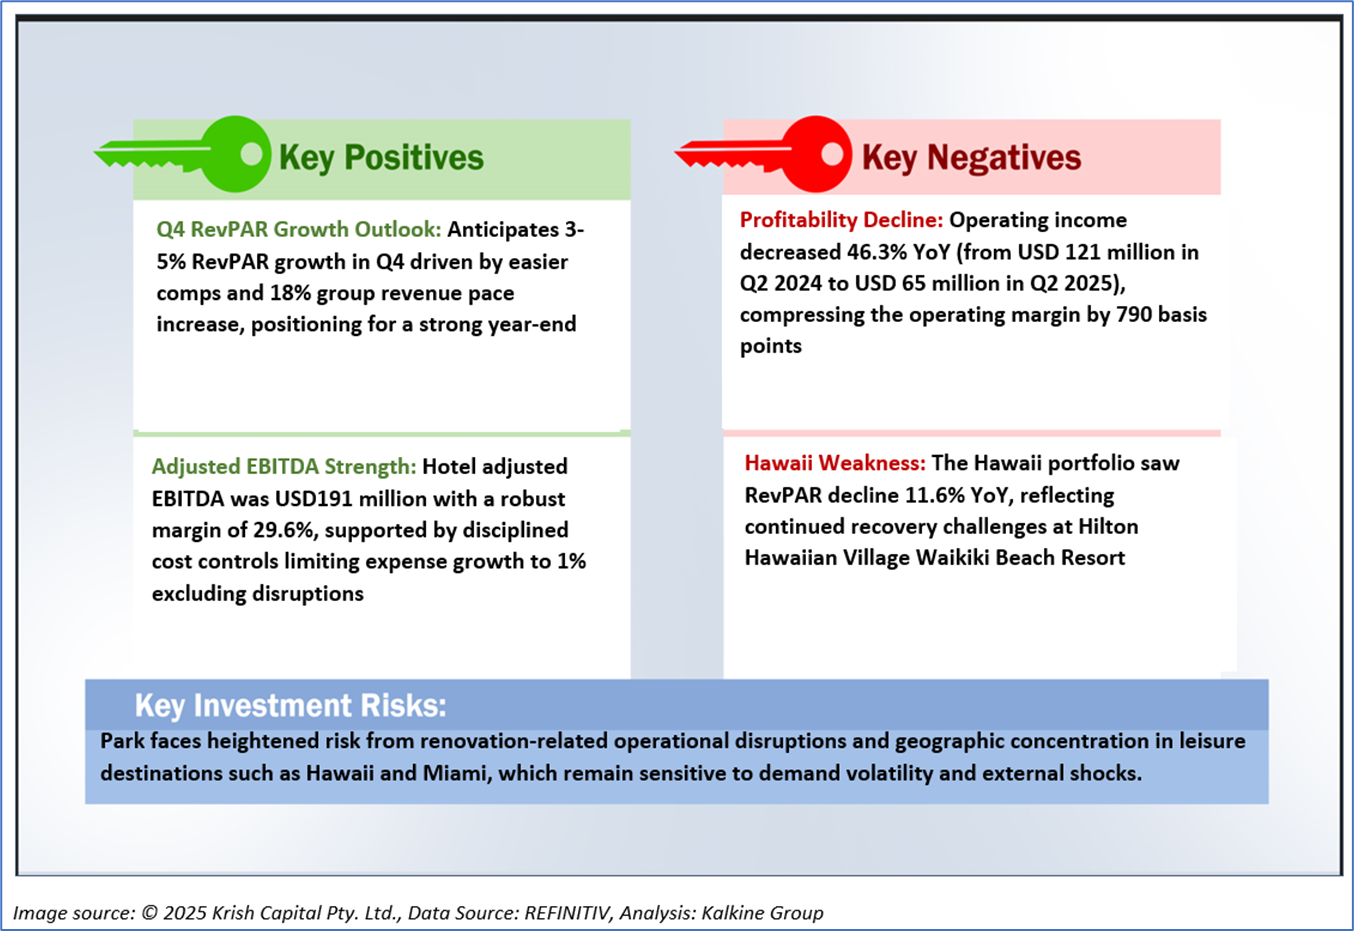
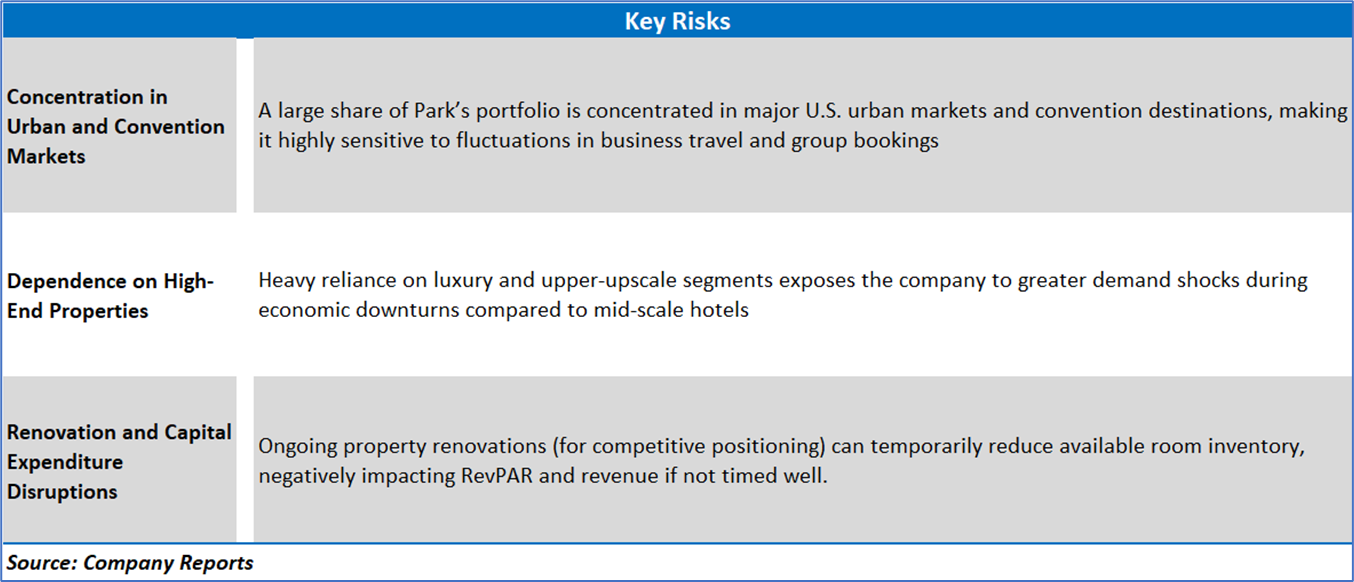
1.2 The Key Positives, Negatives, Investment Highlights, and Risks
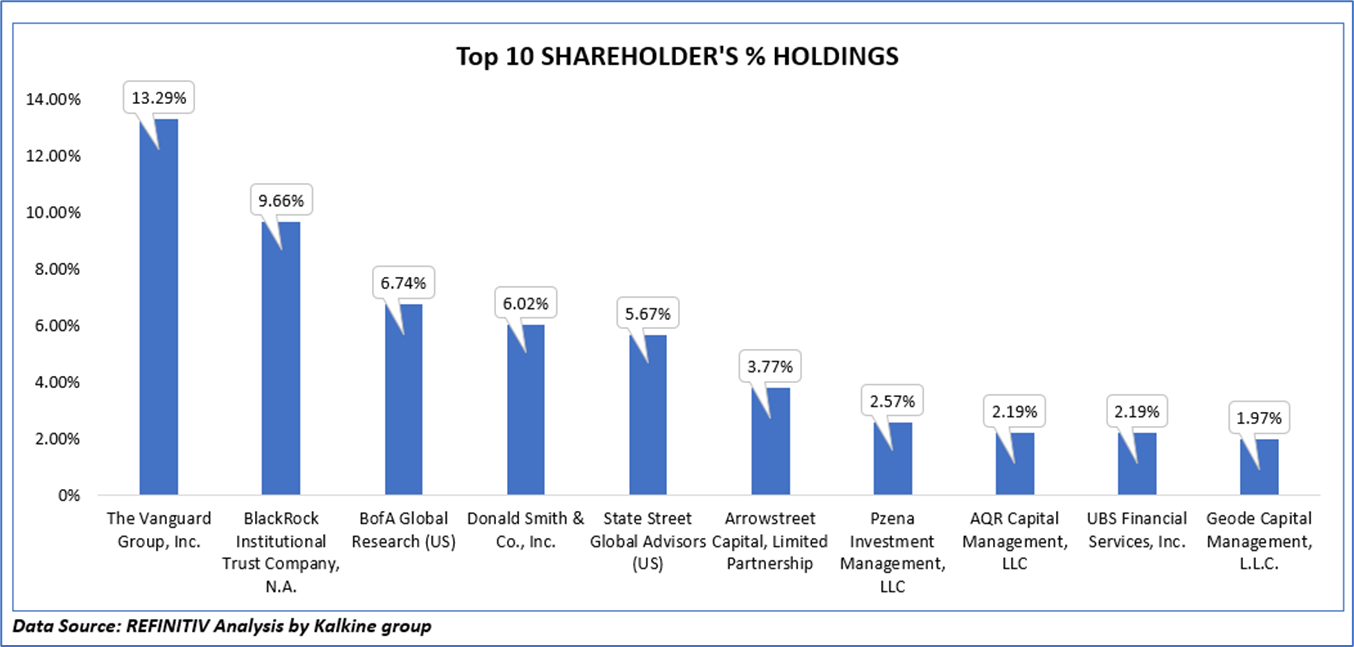
1.3 Top 10 Shareholders:
The top 10 shareholders together form ~54.08% of the total shareholding. The Vanguard Group, Inc. and BlackRock Institutional Trust Company, N.A. hold maximum stakes of 13.29% and 9.66%, respectively.
1.4 Key Metrics:
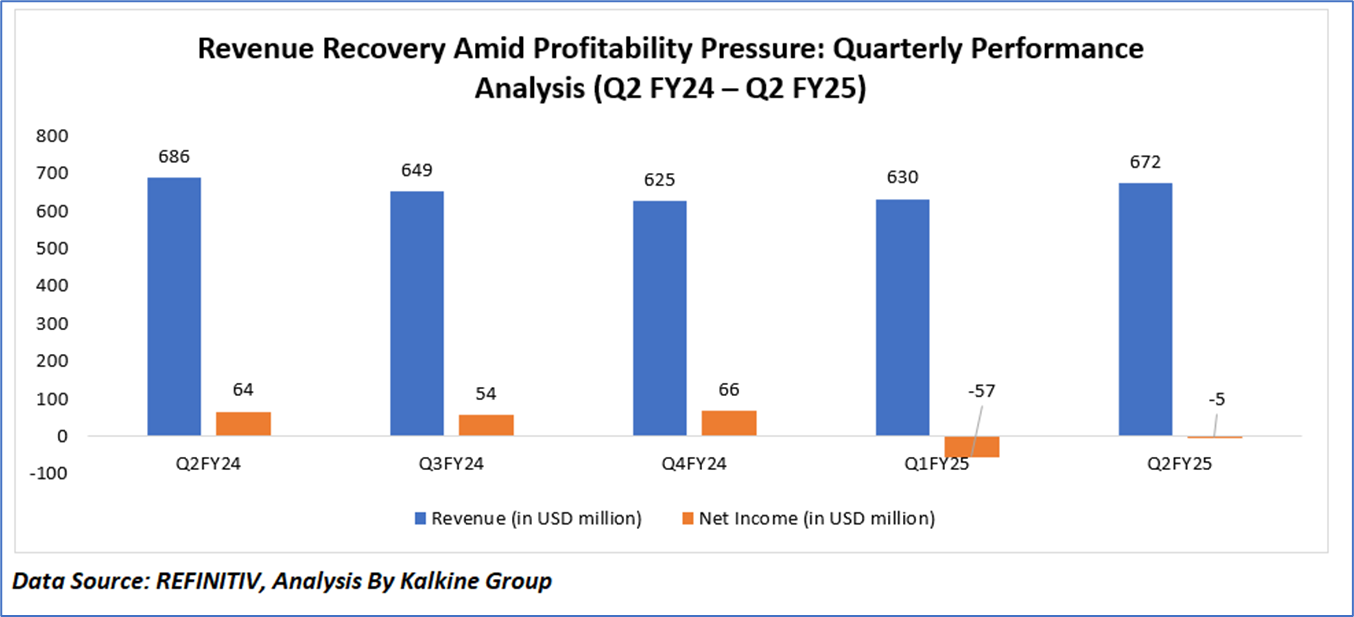
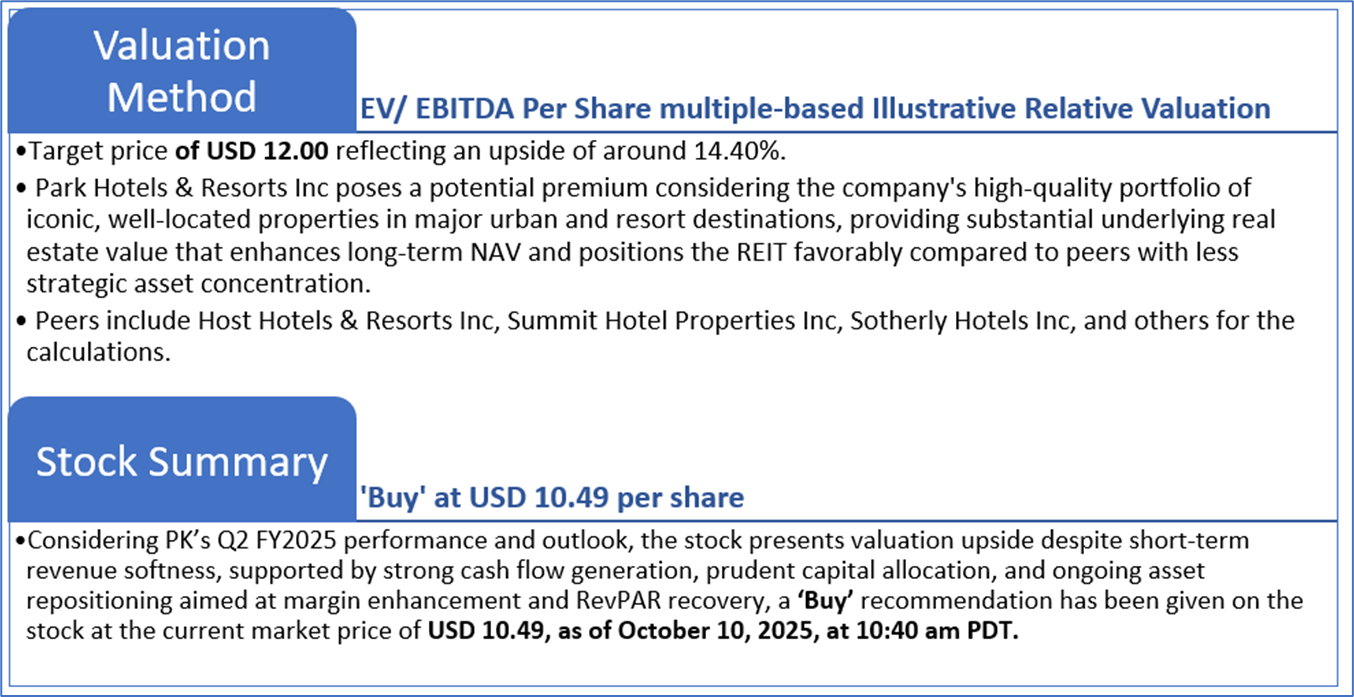
Park Hotels & Resorts experienced a sequential revenue decline from Q2 FY24 (USD 686 million) to Q4 FY24 (USD 625 million), largely due to softer leisure demand, modest ADR pressure, and renovation-related disruptions in key properties. Q1 FY25 remained relatively stable at USD 630 million, while Q2 FY25 showed a strong rebound to USD 672 million, supported by improved group bookings and seasonal demand recovery. Net income, which remained positive through FY24 (USD 54 million–USD 66 million), turned negative in FY25 with a sharp drop to negative USD 57 million in Q1, primarily driven by higher operating costs, interest expenses, and the timing of asset sales. However, Q2 FY25 witnessed a significant improvement, narrowing the loss to negative USD 5 million, reflecting operational efficiencies and RevPAR recovery. Looking ahead, sustained demand in business travel and continued cost discipline could help restore profitability, while the company’s high-quality real estate portfolio positions it well to capture upside as macroeconomic conditions stabilize.
Section 2: Business Updates, Financial and Operational Highlights
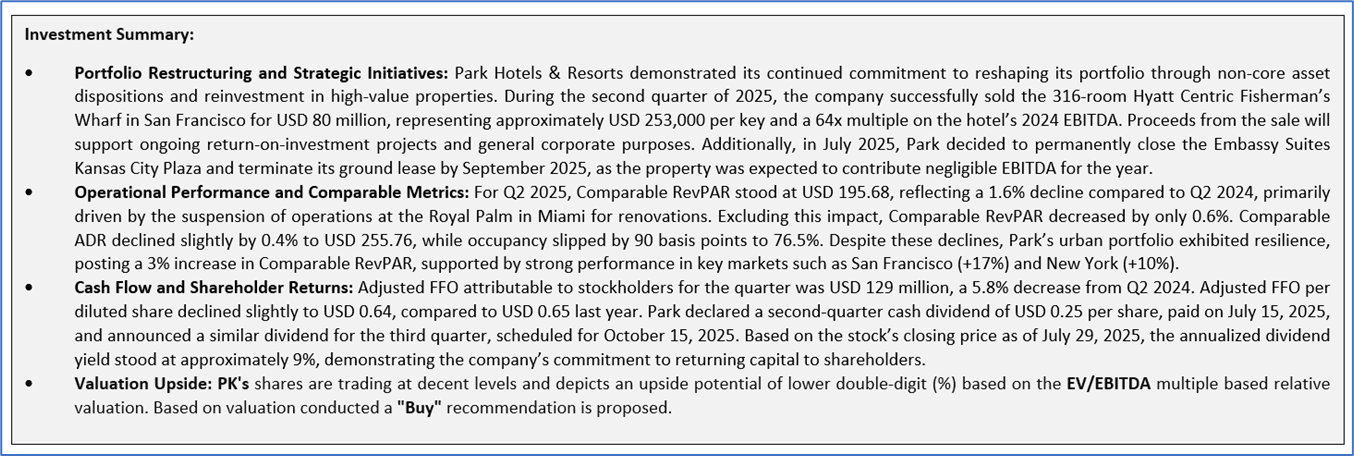
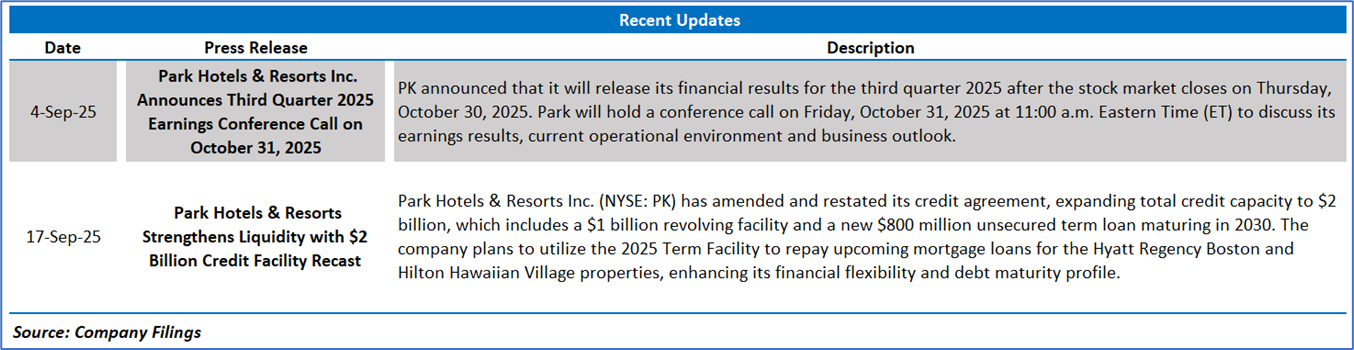
2.1 Recent Business Updates:
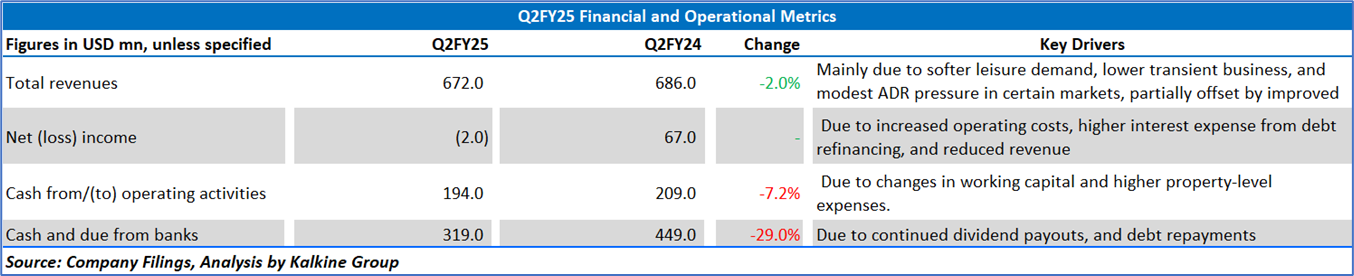
2.2 Q2FY25 Results Highlights (for the 03 months ended June 30, 2025): Below are some key financial highlights:
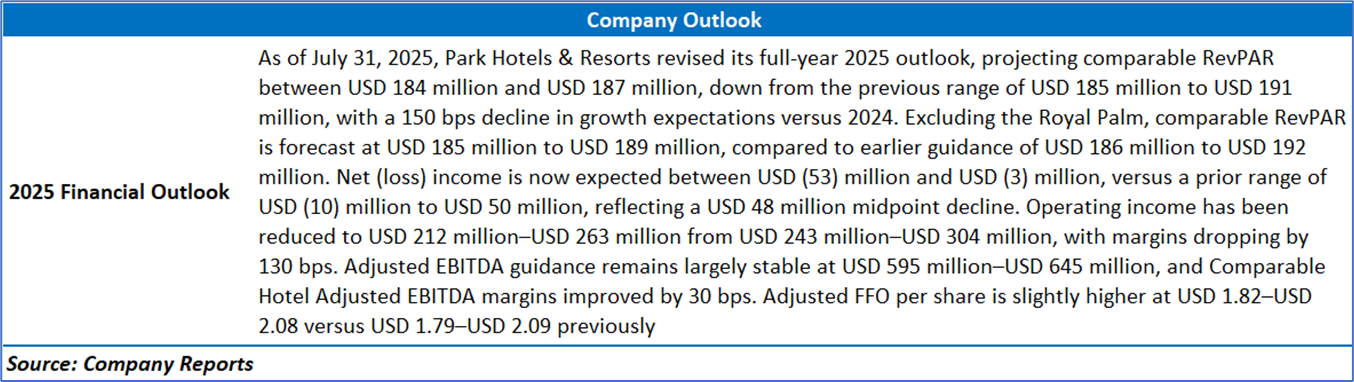
Section 3: Key Risks and Outlook:
Section 4: Stock Recommendation Summary
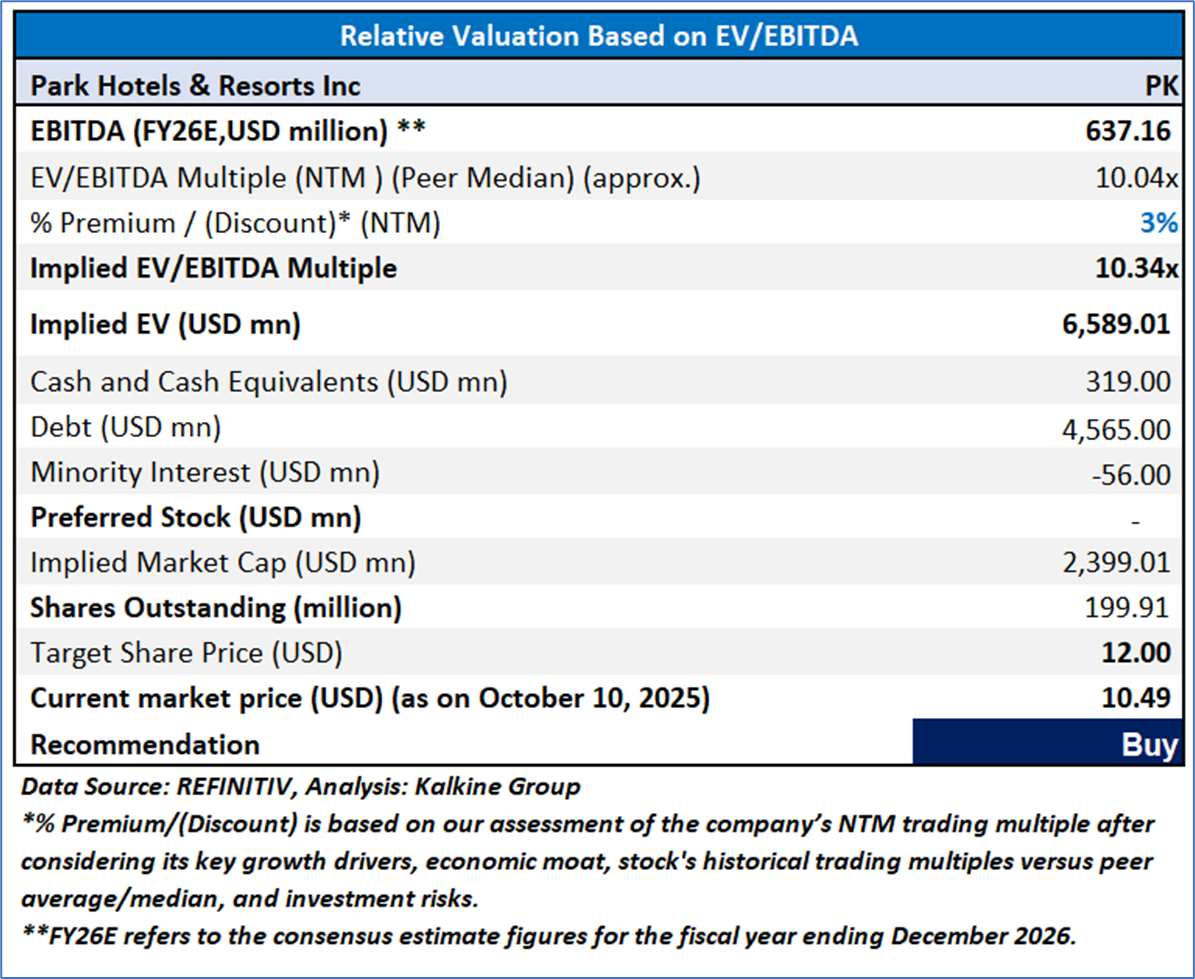
4.2 Fundamental Valuation
Valuation Methodology: EV/EBITDA Multiple Based Relative Valuation (Illustrative)
Markets are trading in a highly volatile zone currently due to certain macro-economic issues and geopolitical tensions prevailing. Therefore, it is prudent to follow a cautious approach while investing.
Note 1: Past performance is neither an indicator nor a guarantee of future performance.
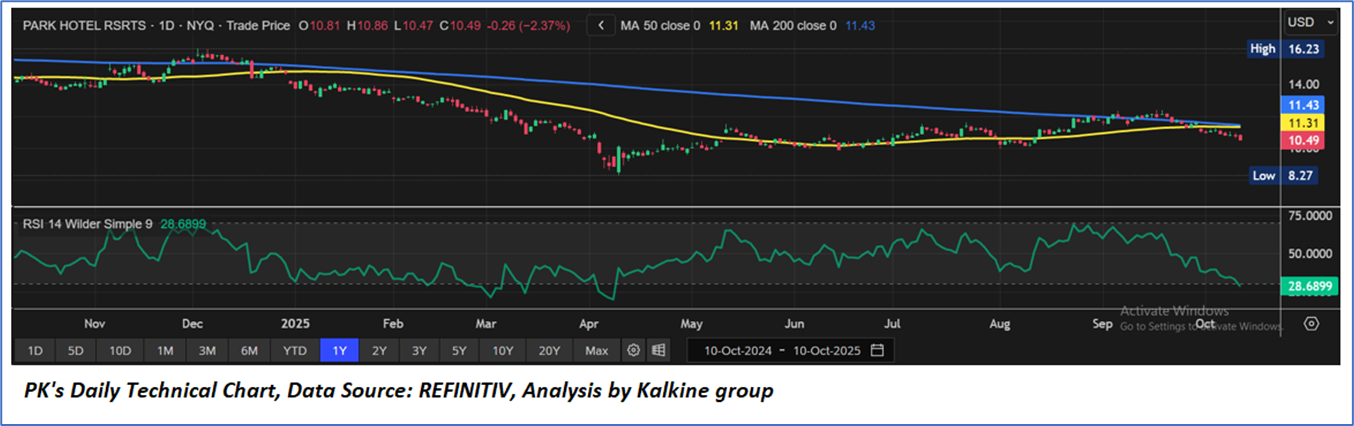
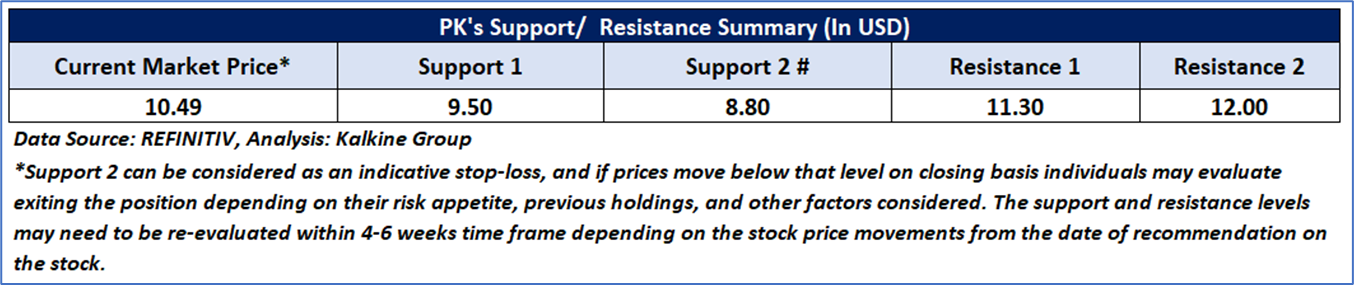
Note 2: The reference date for all price data, currency, technical indicators, support, and resistance levels is 10 October 2025. The reference data in this report has been partly sourced from REFINITIV.
Note 3: Investment decisions should be made depending on an individual's appetite for upside potential, risks, holding duration, and any previous holdings. An 'Exit' from the stock can be considered if the Target Price mentioned as per the Valuation and or the technical levels provided has been achieved and is subject to the factors discussed above.
Note 4: Dividend Yield may vary as per the stock price movement.
Note 5: Kalkine reports are prepared based on the stock prices captured either from REFINITIV or Trading View. Typically, REFINITIV or Trading View may reflect stock prices with a delay which could be a lag of 25-30 minutes. There can be no assurance that future results or events will be consistent with the information provided in the report. The information is subject to change without any prior notice.
Technical Indicators Defined: -
Support: A level at which the stock prices tend to find support if they are falling, and a downtrend may take a pause backed by demand or buying interest. Support 1 refers to the nearby support level for the stock and if the price breaches the level, then Support 2 may act as the crucial support level for the stock.
Resistance: A level at which the stock prices tend to find resistance when they are rising, and an uptrend may take a pause due to profit booking or selling interest. Resistance 1 refers to the nearby resistance level for the stock and if the price surpasses the level, then Resistance 2 may act as the crucial resistance level for the stock.
Stop-loss: It is a level to protect further losses in case of unfavourable movement in the stock prices.
Kalkine Equities LLC, with Delaware File Number 4697384, Foreign Qualification Registration in California File Number 202109211078, and Texas File Number 805521396, is authorized to provide general advice only. The information on https://kalkine.com/ does not take into account any of your investment objectives, financial situation or needs. You should consider the appropriateness of advice taking into account your own objectives, financial situation and needs and seek independent financial advice before making any financial decisions. The link to our Terms and Conditions and Privacy Policy has been provided for your reference. On the date of publishing the reports (mentioned on the website), employees and/or associates of Kalkine do not hold positions in any of the stocks covered on the website. These stocks can change any time and readers of the reports should not consider these stocks as advice or recommendations later.
Past performance is not a reliable indicator of future performance.
 Please wait processing your request...