
Kalkine’s Global Travel & Leisure Report offers a comprehensive view of the key companies and evolving trends across the travel value chain covering countries including US, Canada, Australia, UK, and New Zealand. This includes airlines, hospitality chains, digital travel platforms, as well as the rapidly growing leisure, entertainment, and gaming segments that are redefining the way people engage with travel experiences.


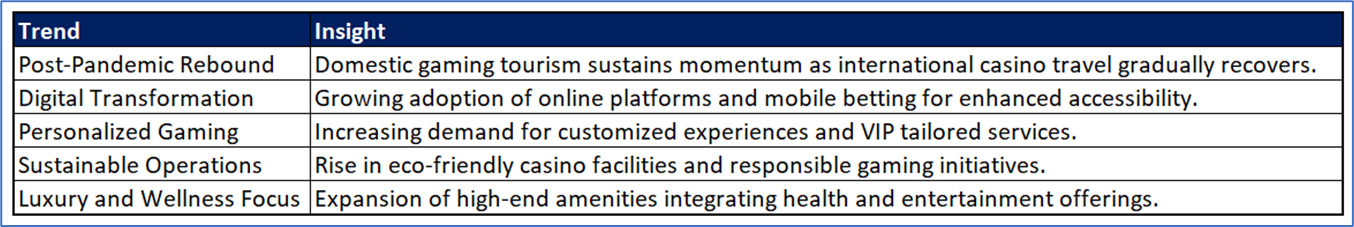

Impact of the Pandemic and Initial Disruptions:
Recovery Driven by Reopening and Consumer Demand:
Strategic Shifts and Digital Acceleration:
Record Growth and Industry Resilience by 2024:
Kalkine’s Global Travel & Leisure Report covers the Investment Highlights, Key Financial Metrics, Risks, Technical Analysis along with the Valuation, Target Price, and Recommendation on PENN Entertainment Inc (NASDAQ: PENN).
Section 1: Company Overview and Fundamentals Insights
Company Overview: PENN Entertainment, Inc. (NASDAQ: PENN) is a provider of integrated entertainment, sports content, and casino gaming experiences. The Company operates in 28 jurisdictions throughout North America, with a broadly diversified portfolio of casinos, racetracks, and online sports betting and iCasino offerings under brands including Hollywood Casino, L’Auberge, ESPN BET, and theScore BET Sportsbook and Casino. Its segments include Northeast, South, West, Midwest, and Interactive.
Kalkine’s Global Travel and Leisure Report cover the Investment Highlights, Key Financial Metrics, Risks, and Technical Analysis along with the Valuation, Target Price, and Recommendation on the stock.
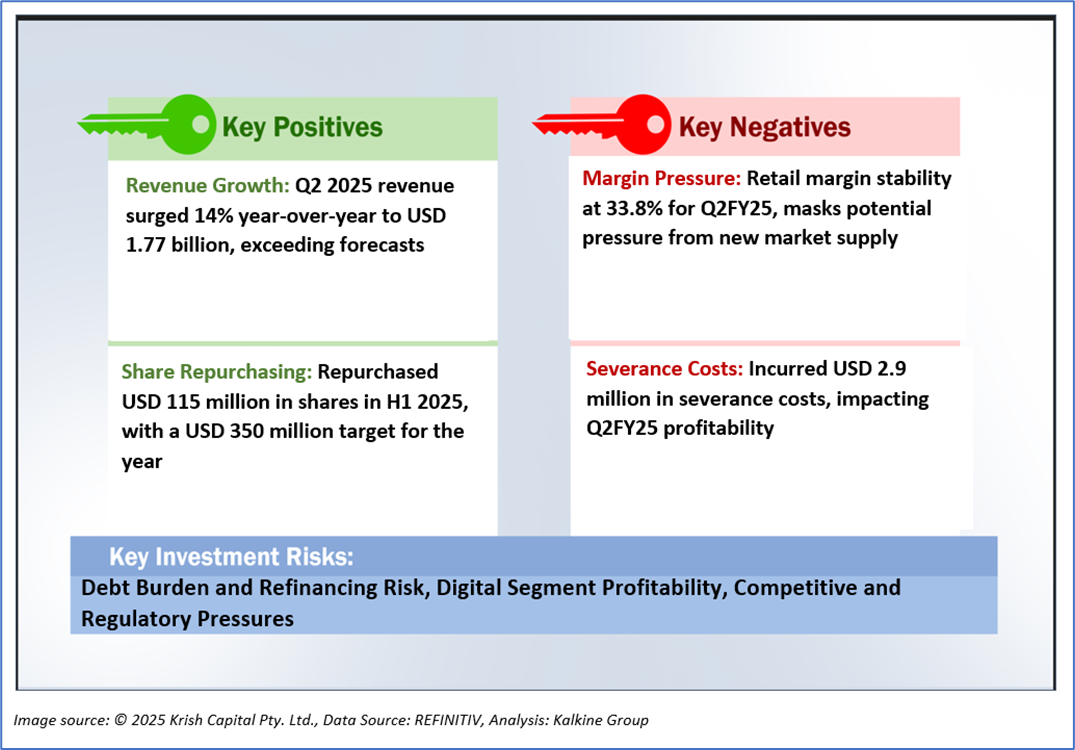
1.2 The Key Positives, Negatives, Investment Highlights, and Risks
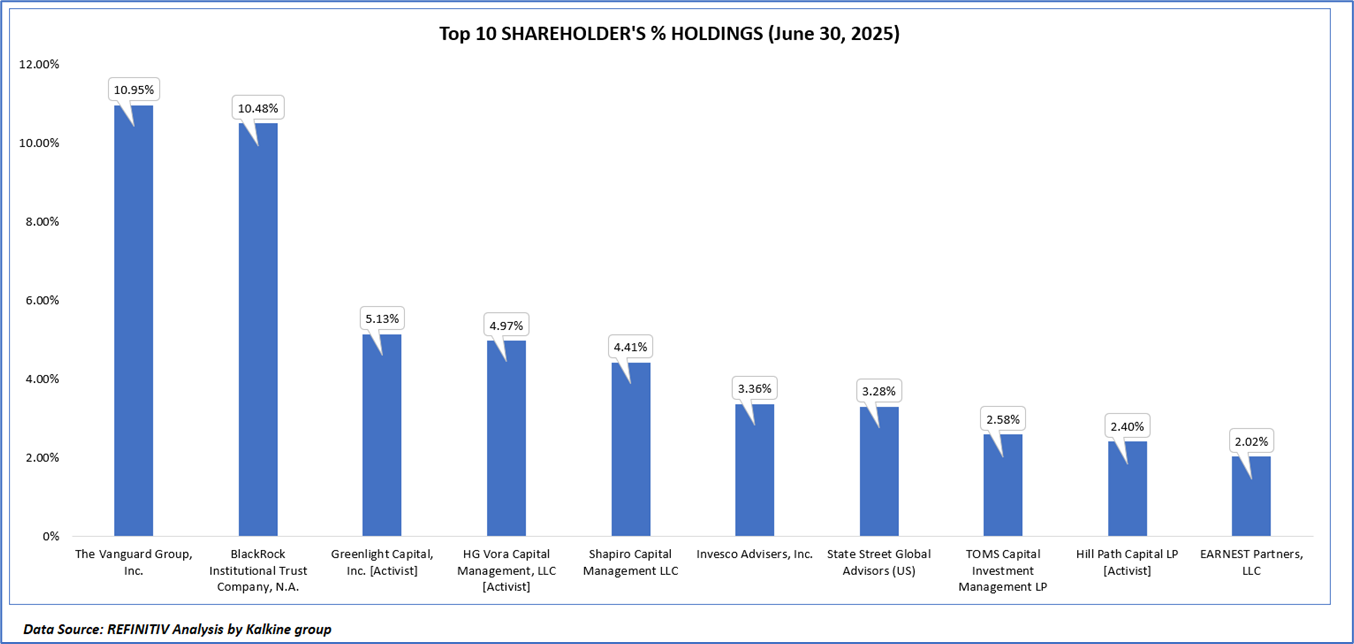
1.3 Top 10 Shareholders:
The top 10 shareholders together form ~49.57% of the total shareholding. The Vanguard Group, Inc., and BlackRock Institutional Trust Company, N.A. hold maximum stakes of 10.95% and 10.48%, respectively.
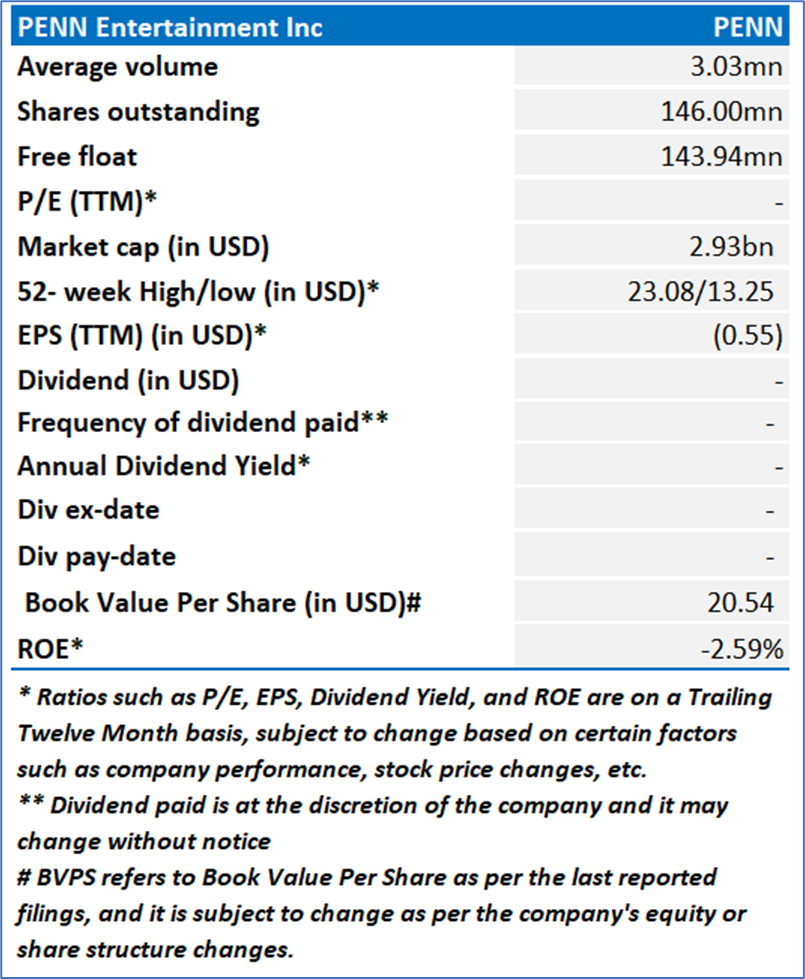
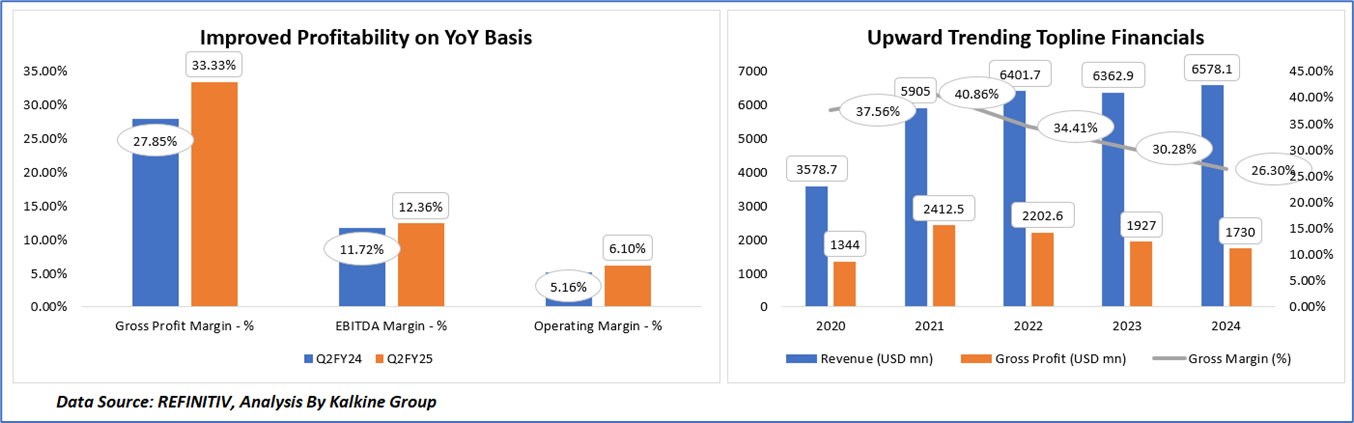
1.4 Key Metrics:
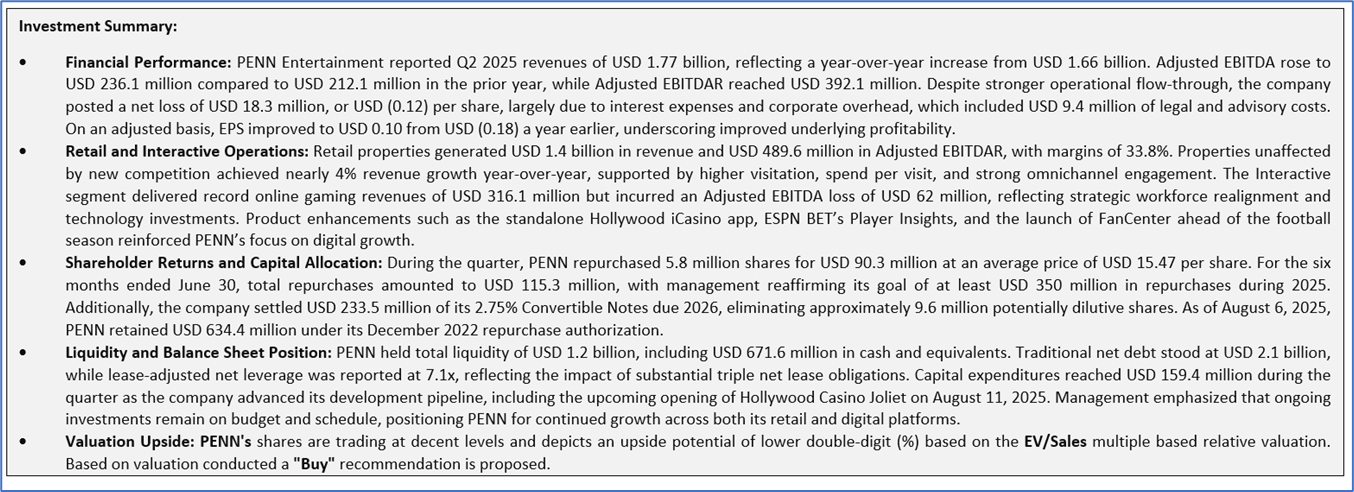
PENN Entertainment, Inc. (NASDAQ: PENN) exhibited a notable enhancement in its financial metrics for the second quarter of fiscal 2025 compared to the same period in 2024, with gross profit margin improving from 27.85% to 33.33%, reflecting a strategic shift toward higher-margin retail operations and a 14% year-over-year revenue increase to USD 1.77 billion. Profitability metrics demonstrated resilience, with EBITDA margin rising from 11.72% to 12.36% and operating margin advancing from 5.16% to 6.10%, driven by a record adjusted EBITDAR of USD 490 million and a near 34% margin, despite challenges such as a USD 2.9 million severance cost, while historical revenue trends from USD 3,578.7 million in 2020 to USD 6,578.1 million in 2024 highlight a 83.8% growth over five years, though gross margin declined from 37.56% to 26.30% due to market volatility and investment phases. This analysis indicates that PENN’s recent focus on operational efficiency and interactive segment growth, coupled with a recovery from the pandemic-induced low of 2020, positions it for sustained improvement, though investors should monitor the impact of fluctuating gross margins and rising operational costs to ensure long-term profitability as the company expands its portfolio.
Section 2: Business Updates, Financial and Operational Highlights
2.1 Recent Business Updates:

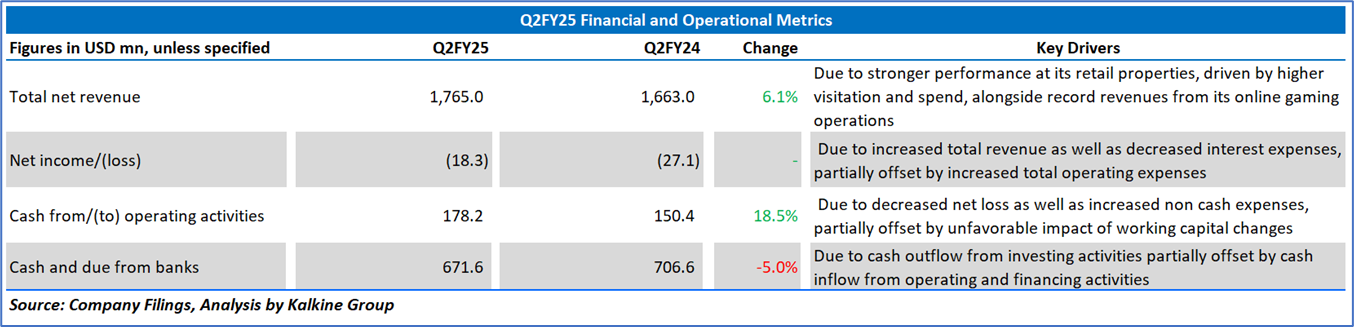
2.2 Q2FY25 Results Highlights (for the 03 months ended 30 June 2025): Below are some key financial highlights:
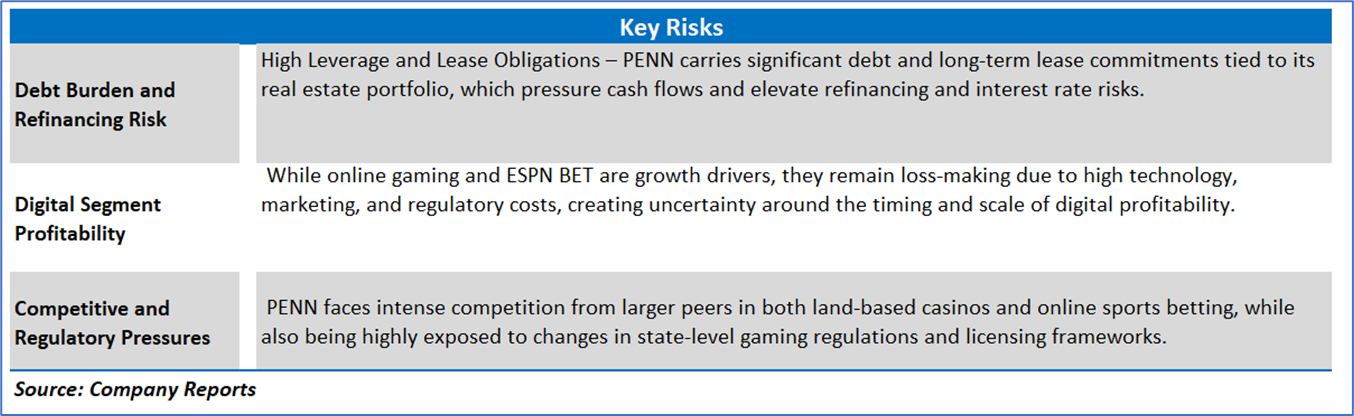
Section 3: Key Risks and Outlook:
Section 4: Stock Recommendation Summary
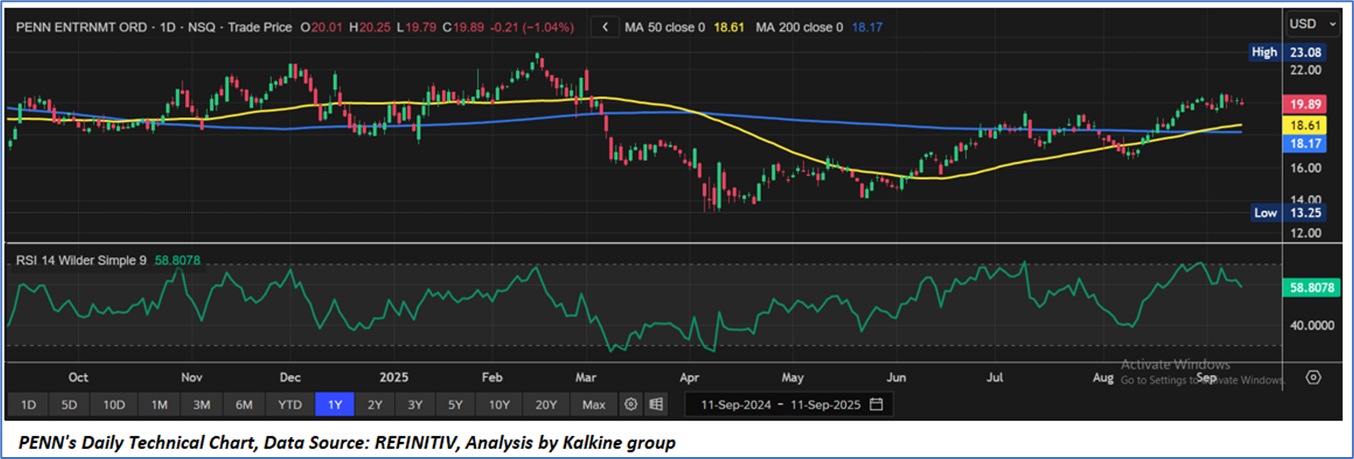
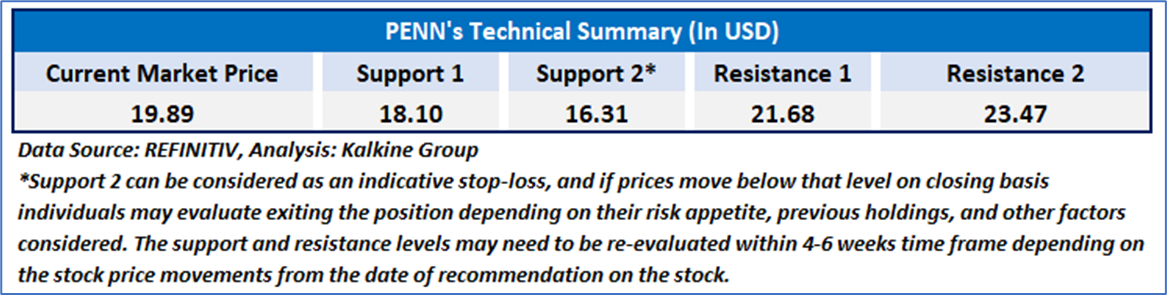
4.1 Price Performance and Technical Summary
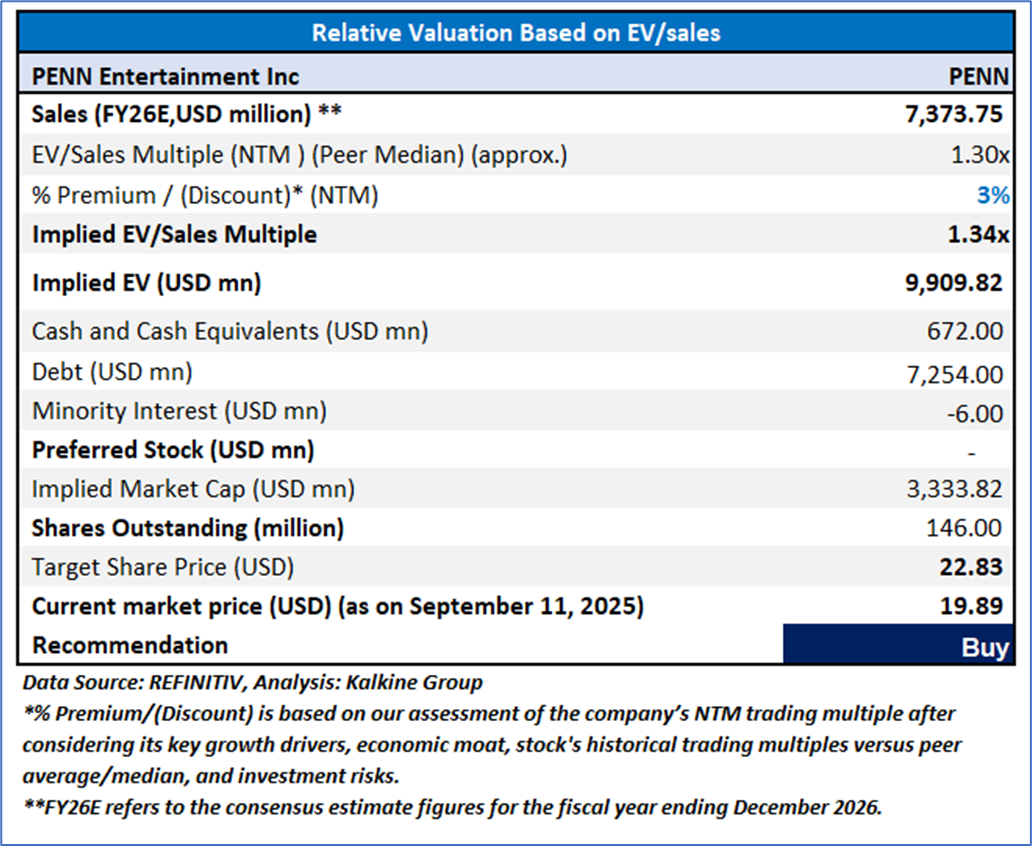
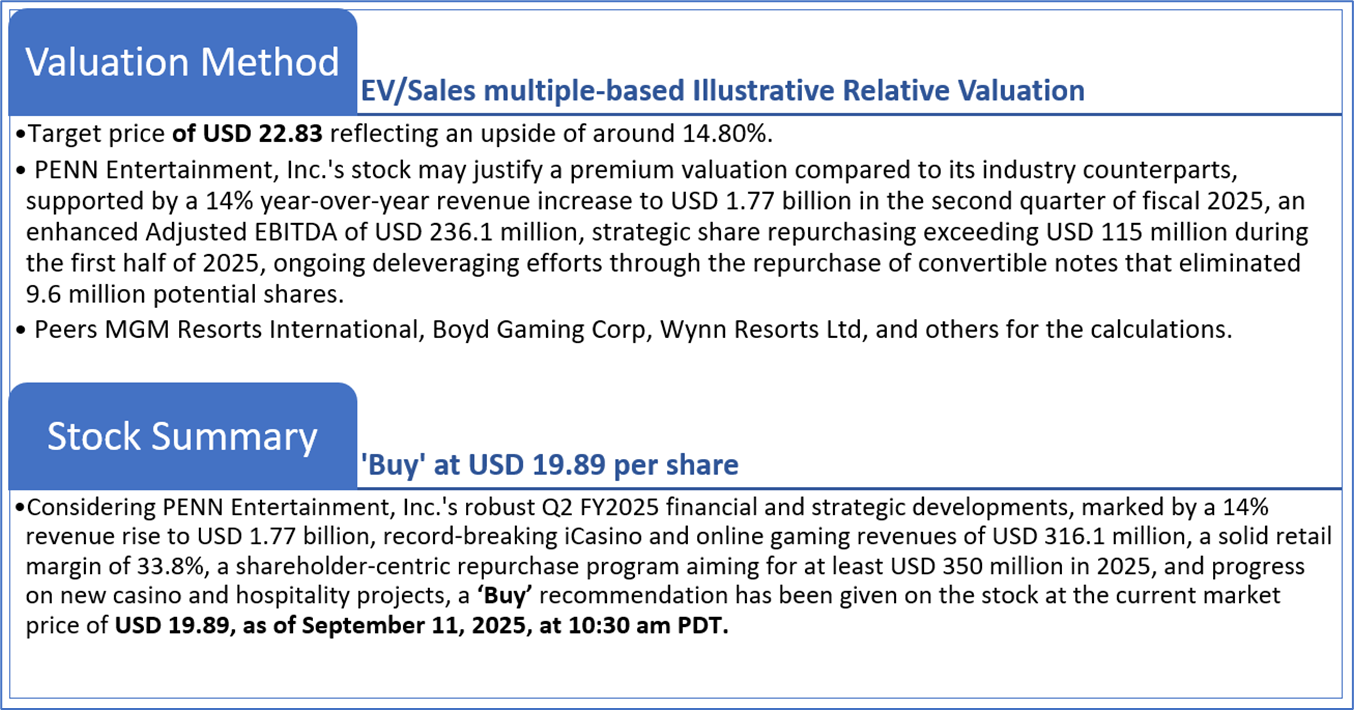
4.2 Fundamental Valuation
Valuation Methodology: EV/Sales Multiple Based Relative Valuation (Illustrative)
Markets are trading in a highly volatile zone currently due to certain macro-economic issues and geopolitical tensions prevailing. Therefore, it is prudent to follow a cautious approach while investing.
Note 1: Past performance is neither an indicator nor a guarantee of future performance.
Note 2: The reference date for all price data, currency, technical indicators, support, and resistance levels is 11 September 2025. The reference data in this report has been partly sourced from REFINITIV.
Note 3: Investment decisions should be made depending on an individual's appetite for upside potential, risks, holding duration, and any previous holdings. An 'Exit' from the stock can be considered if the Target Price mentioned as per the Valuation and or the technical levels provided has been achieved and is subject to the factors discussed above.
Note 4: Dividend Yield may vary as per the stock price movement.
Note 5: Kalkine reports are prepared based on the stock prices captured either from REFINITIV or Trading View. Typically, REFINITIV or Trading View may reflect stock prices with a delay which could be a lag of 25-30 minutes. There can be no assurance that future results or events will be consistent with the information provided in the report. The information is subject to change without any prior notice.
Technical Indicators Defined: -
Support: A level at which the stock prices tend to find support if they are falling, and a downtrend may take a pause backed by demand or buying interest. Support 1 refers to the nearby support level for the stock and if the price breaches the level, then Support 2 may act as the crucial support level for the stock.
Resistance: A level at which the stock prices tend to find resistance when they are rising, and an uptrend may take a pause due to profit booking or selling interest. Resistance 1 refers to the nearby resistance level for the stock and if the price surpasses the level, then Resistance 2 may act as the crucial resistance level for the stock.
Stop-loss: It is a level to protect further losses in case of unfavourable movement in the stock prices.
Kalkine Equities LLC, with Delaware File Number 4697384, Foreign Qualification Registration in California File Number 202109211078, and Texas File Number 805521396, is authorized to provide general advice only. The information on https://kalkine.com/ does not take into account any of your investment objectives, financial situation or needs. You should consider the appropriateness of advice taking into account your own objectives, financial situation and needs and seek independent financial advice before making any financial decisions. The link to our Terms and Conditions and Privacy Policy has been provided for your reference. On the date of publishing the reports (mentioned on the website), employees and/or associates of Kalkine do not hold positions in any of the stocks covered on the website. These stocks can change any time and readers of the reports should not consider these stocks as advice or recommendations later.
Past performance is not a reliable indicator of future performance.
 Please wait processing your request...