Section 1: Company Overview and Fundamentals
1.1 Company Overview:
Shutterstock, Inc (NYSE: SSTK) operates a global creative platform that connects businesses and brands with high-quality digital content. The company delivers its content through a portfolio of brands, including Shutterstock, Pond5, TurboSquid, PicMonkey, PremiumBeat, Splash News, Bigstock, and Offset. The flagship Shutterstock brand offers a diverse range of content, including images, videos, music, and editorial material. Pond5, a video-centric marketplace, enhances the company's offerings by focusing primarily on video content while also providing images and music.
Kalkine’s Dividend Income Report covers the Company Overview, Key positives & negatives, Investment summary, Key investment metrics, Top 10 shareholding, Business updates and insights into company recent financial results, Key Risks & Outlook, Price performance and technical summary, Target Price, and Recommendation on the stock.
Price Performance:

1.2 The Key Positives, Negatives, and Investment summary


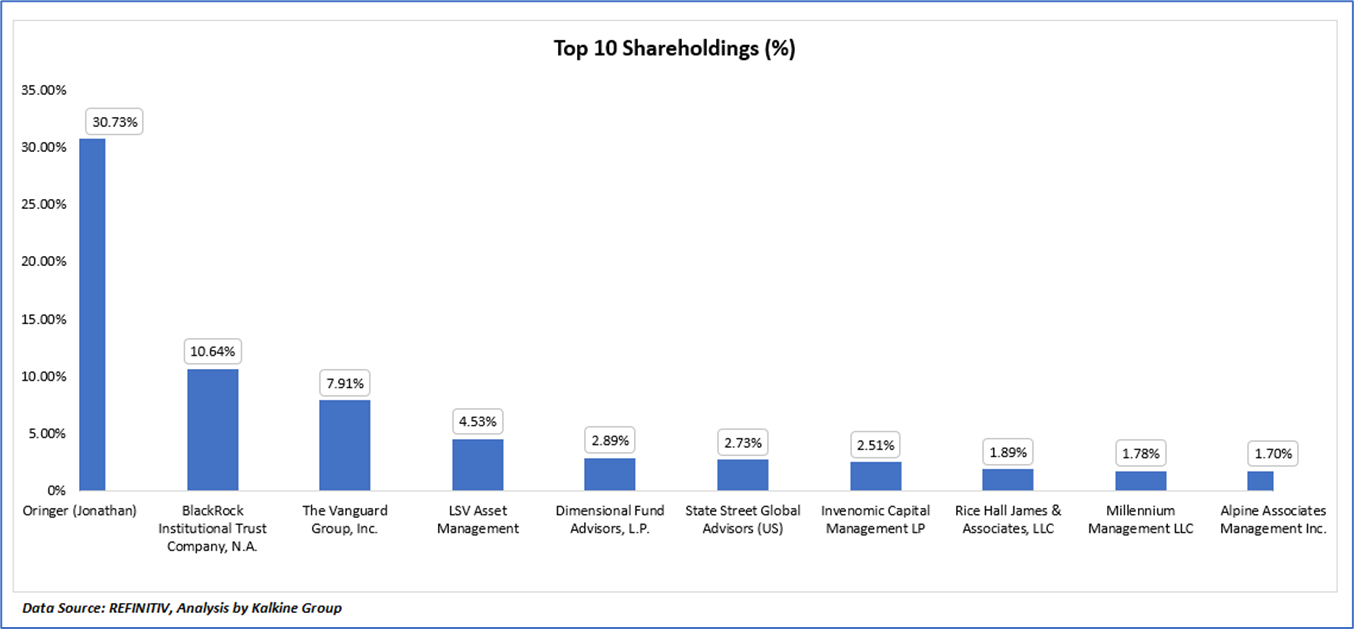
1.3 Top 10 shareholders:
The top 10 shareholders together form ~67.30% of the total shareholding, signifying concentrated shareholding. Oringer (Jonathan) and BlackRock Institutional Trust Company, N.A. are the biggest shareholders, holding the maximum stake in the company at ~30.73% and ~10.64%, respectively.
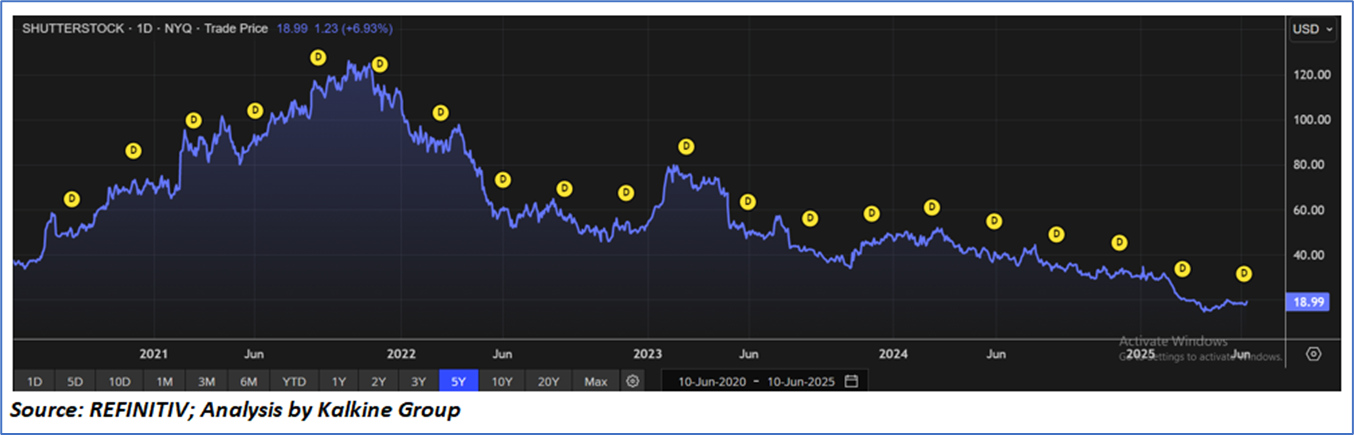
1.4 Dividend payments with impressive dividend yield:
Over the past five years, Shutterstock Inc. has demonstrated a consistent commitment to returning value to shareholders through regular quarterly dividend payments, as indicated by the uninterrupted series of dividends on the chart. This pattern has held steady despite a significant and prolonged decline in the company’s stock price—from a peak of over USD 120 in late 2021 to approximately USD 19 by mid-2025. The consistency in dividends, without any visible cuts or suspensions, suggests that Shutterstock either maintained adequate cash flows or prioritized its dividend policy even during challenging periods. While this may appeal to income-focused investors, it also raises concerns about the long-term sustainability of such payouts if the company’s underlying financial performance and stock trajectory continue to deteriorate. Maintaining dividends in a weakening market environment could potentially strain resources or limit future flexibility.
1.5 Key Metrics
The chart displays the group's quarterly revenue and gross profit (in USD million) from Q1 FY24 to Q1 FY25. Revenue showed a general upward trend from USD 214.3 million in Q1 FY24 to a peak of USD 250.6 million in Q3 FY24, followed by a slight dip to USD 242.6 million in Q1 FY25. The growth is attributed to strong performance in its Content product offering, which grew by USD 29.1 million (17%), accounting for 84% of total revenue. Gross profit followed a similar pattern, increasing from USD 126.1 million in Q1 FY24 to USD 146.0 million in Q3 FY24, then dipping in Q4 FY24 before slightly recovering to USD 141.7 million in Q1 FY25. The profitability is driven by strong revenue growth, especially from the Content product offering, which grew 17% y-o-y and contributed significantly to total revenue. The acquisition of Envato in July 2024 also positively impacted profitability, enhancing gross profit. However, these gains were partially offset by a 2% decline in revenue from the Data, Distribution, and Services segment and a 1% unfavorable impact from foreign currency fluctuations.

Section 2: Business Updates and Financial Highlights
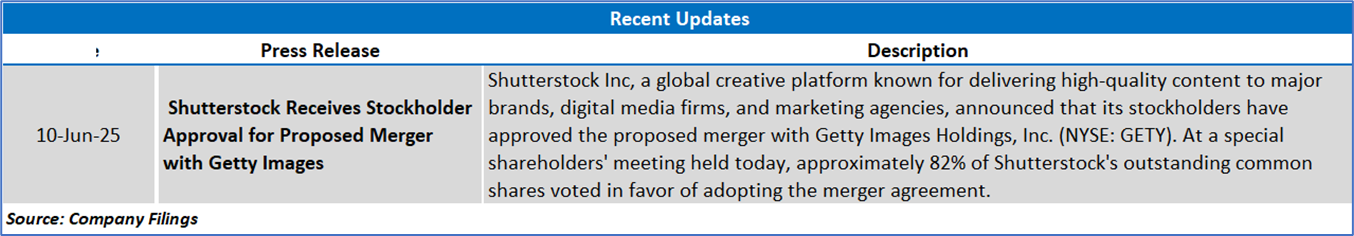
2.1 Recent Updates:
The below picture gives an overview of the recent updates:
2.2 Insights of Q1 FY25:

Section 3: Key Risks and Outlook:

Section 4: Stock Recommendation Summary:
4.1 Technical Summary:
Price Performance:


4.2 Fundamental Valuation
Valuation Methodology: Price/Earnings Per Share Multiple Based Relative Valuation


Markets are trading in a highly volatile zone currently due to certain macroeconomic issues and geopolitical tensions prevailing. Therefore, it is prudent to follow a cautious approach while investing.
Note 1: Past performance is not a reliable indicator of future performance.
Note 2: The reference date for all price data, currency, technical indicators, support, and resistance levels is June 10, 2024. The reference data in this report has been partly sourced from REFINITIV.
Note 3: Investment decisions should be made depending on an individual's appetite for upside potential, risks, holding duration, and any previous holdings. An 'Exit' from the stock can be considered if the Target Price mentioned as per the Valuation and or the technical levels provided has been achieved and is subject to the factors discussed above.
Note 4: The report publishing date is as per the Pacific Time Zone.
Technical Indicators Defined: -
Support: A level at which the stock prices tend to find support if they are falling, and a downtrend may take a pause backed by demand or buying interest. Support 1 refers to the nearby support level for the stock and if the price breaches the level, then Support 2 may act as the crucial support level for the stock.
Resistance: A level at which the stock prices tend to find resistance when they are rising, and an uptrend may take a pause due to profit booking or selling interest. Resistance 1 refers to the nearby resistance level for the stock and if the price surpasses the level, then Resistance 2 may act as the crucial resistance level for the stock.
Stop-loss: It is a level to protect against further losses in case of unfavorable movement in the stock prices.
Kalkine Equities LLC, with Delaware File Number 4697384, Foreign Qualification Registration in California File Number 202109211078, and Texas File Number 805521396, is authorized to provide general advice only. The information on https://kalkine.com/ does not take into account any of your investment objectives, financial situation or needs. You should consider the appropriateness of advice taking into account your own objectives, financial situation and needs and seek independent financial advice before making any financial decisions. The link to our Terms and Conditions and Privacy Policy has been provided for your reference. On the date of publishing the reports (mentioned on the website), employees and/or associates of Kalkine do not hold positions in any of the stocks covered on the website. These stocks can change any time and readers of the reports should not consider these stocks as advice or recommendations later.
Past performance is not a reliable indicator of future performance.
 Please wait processing your request...