Section 1: Company Overview and Fundamentals
1.1 Company Overview:
SIGA Technologies, Inc. (NASDAQ: SIGA) is a commercial-stage pharmaceutical company focused on the health security market. Health security comprises countermeasures for biological, chemical, radiological and nuclear attacks, vaccines and therapies for emerging infectious diseases, and health preparedness. The Company's lead product is TPOXX, also known as tecovirimat and ST-246, an orally administered and intravenous (IV) formulation antiviral drug for the treatment of human smallpox disease caused by variola virus.
Kalkine’s Dividend Income Report covers the Company Overview, Key positives & negatives, Investment summary, Key investment metrics, Top 10 shareholding, Business updates and insights into company recent financial results, Key Risks & Outlook, Price performance and technical summary, Target Price, and Recommendation on the stock.
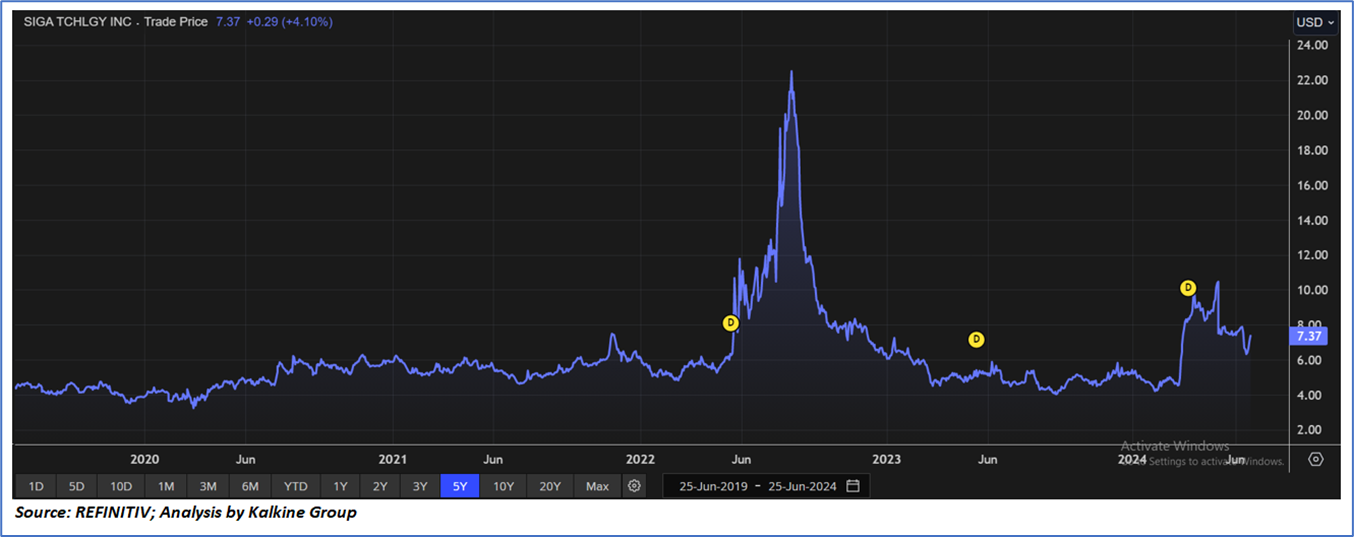
Price Performance:
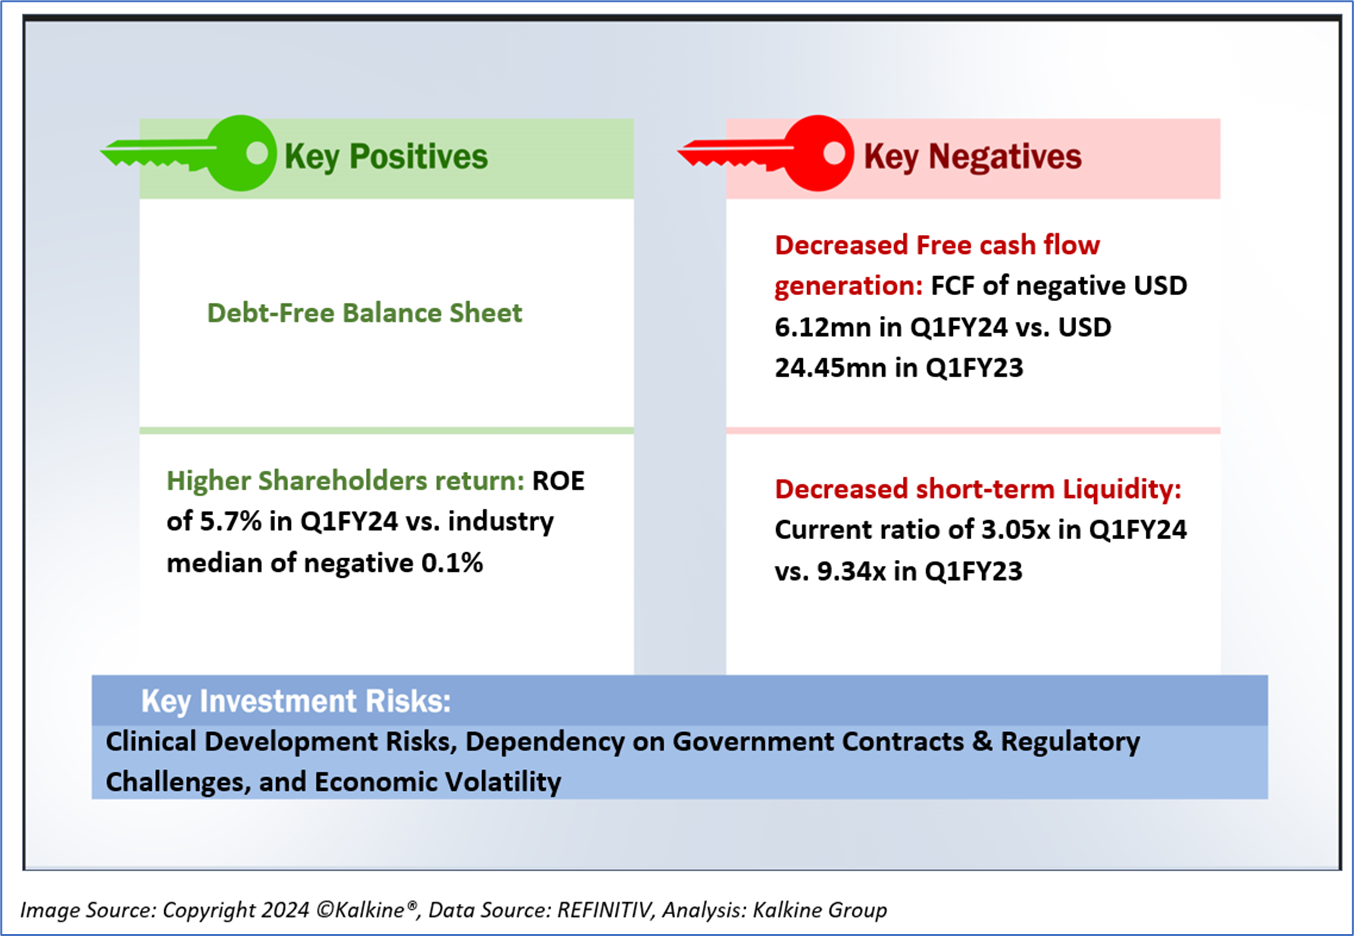
1.2 The Key Positives, Negatives, and Investment summary
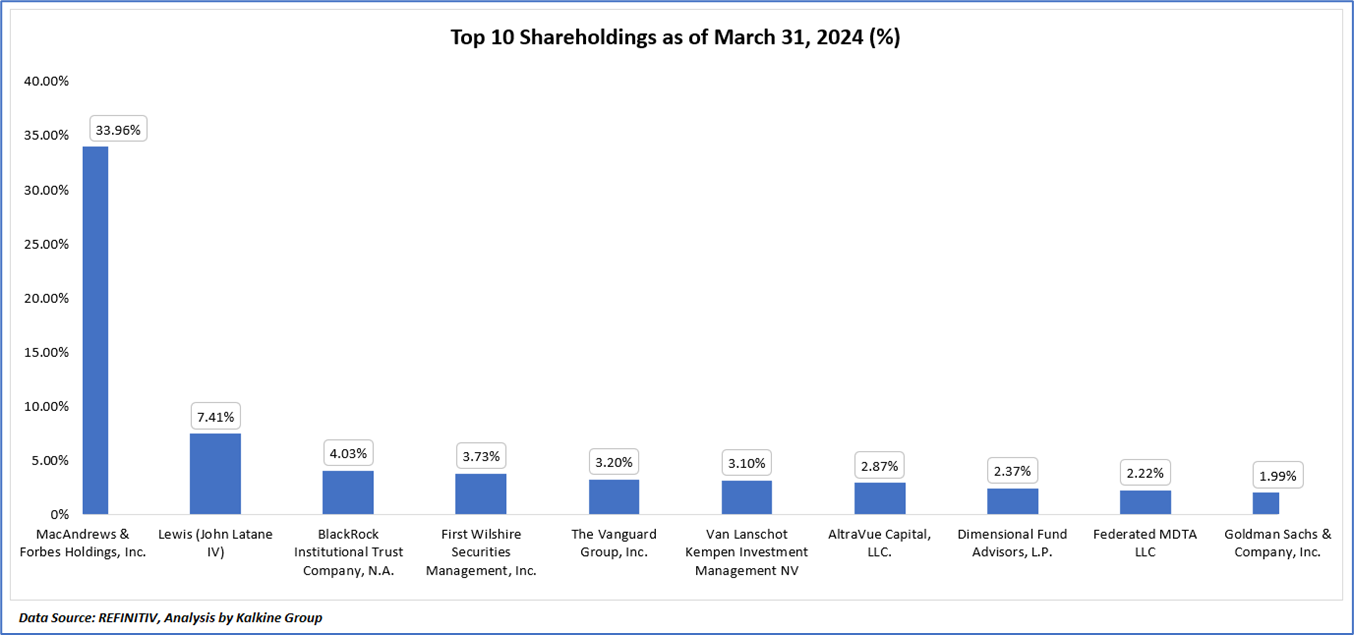
1.3 Top 10 shareholders:
The top 10 shareholders together form ~64.88% of the total shareholding, signifying concentrated shareholding. MacAndrews & Forbes Holdings, Inc. and Lewis (John Latane IV), are the biggest shareholders, holding the maximum stake in the company at ~33.96% and ~7.41%, respectively.
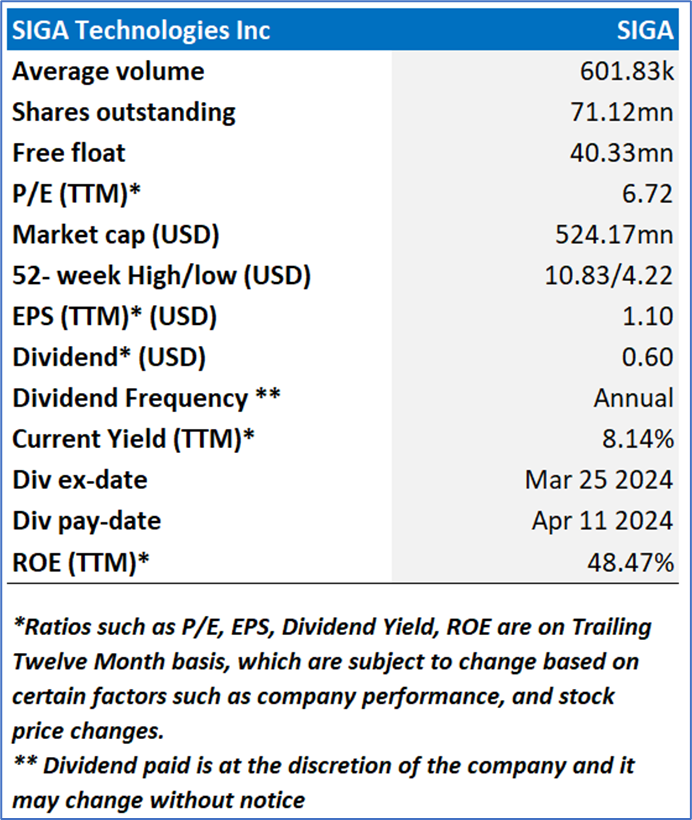
1.4 Dividend payments with impressive dividend yield:
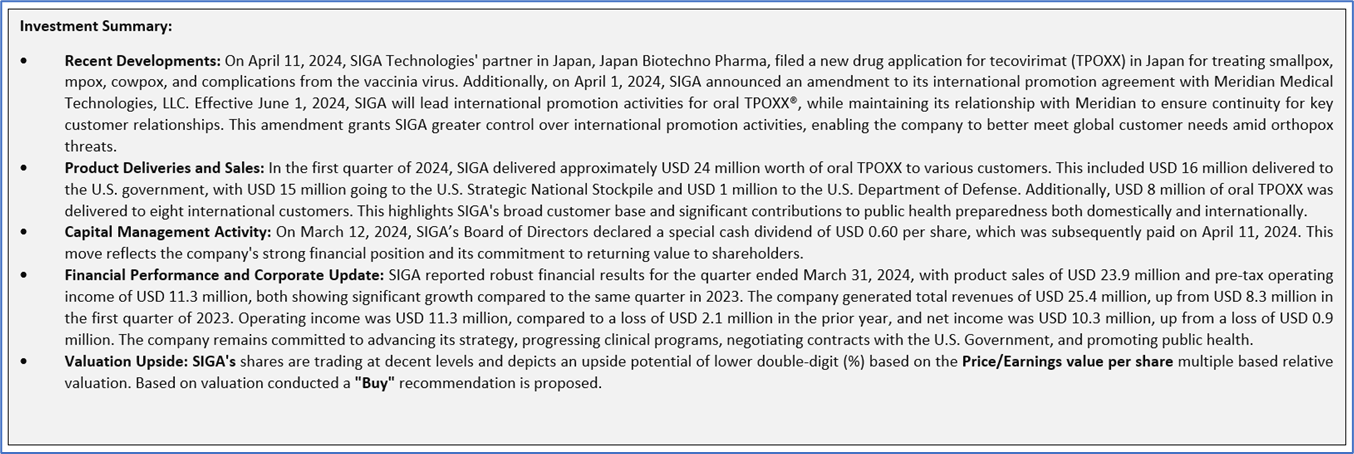
On March 12, 2024, SIGA’s Board of Directors declared a special cash dividend of USD 0.60 per share, which was subsequently paid on April 11, 2024. This move reflects the company's strong financial position and its commitment to returning value to shareholders.
1.5 Key Metrics
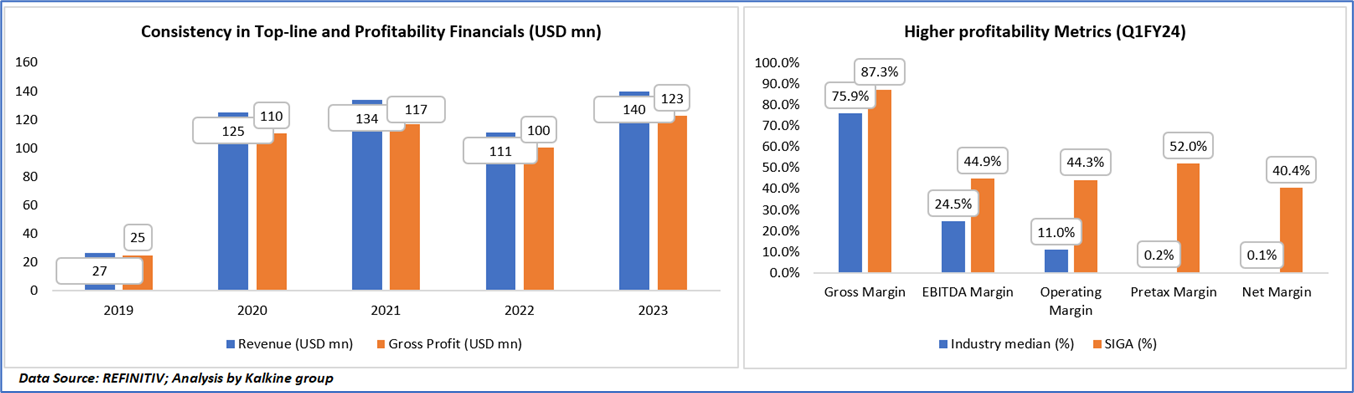
In the fiscal years spanning 2019 to 2023, the company witnessed notable fluctuations in its financial performance. Over this period, revenue figures showed a fluctuating trend, starting at 27 million USD in 2019 and peaking at 140 million USD by 2023, with intermittent dips and recoveries in between. Similarly, gross profit figures mirrored this pattern, starting from 25 million USD in 2019 and reaching 123 million USD in 2023, indicating a general upward trajectory with slight setbacks.
Comparing these financial metrics against industry benchmarks reveals significant deviations in performance metrics. The company consistently maintained a higher gross margin than the industry median, achieving 87.3% in recent years compared to the industry's 75.9%. Moreover, its operational efficiencies, as reflected in EBITDA, operating, pretax, and net margins, consistently outperformed industry norms, with substantial margins recorded in the most recent fiscal year. These metrics underscore the company's adeptness in managing costs and optimizing revenue streams amidst fluctuating market conditions.
Section 2: Business Updates and Financial Highlights
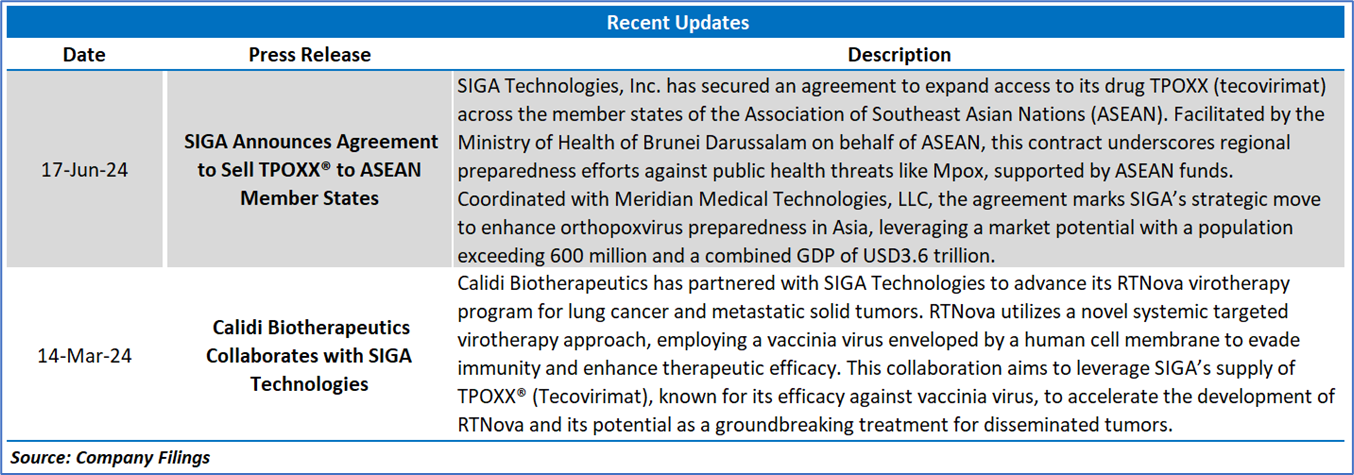
2.1 Recent Updates:
The below picture gives an overview of the recent updates:
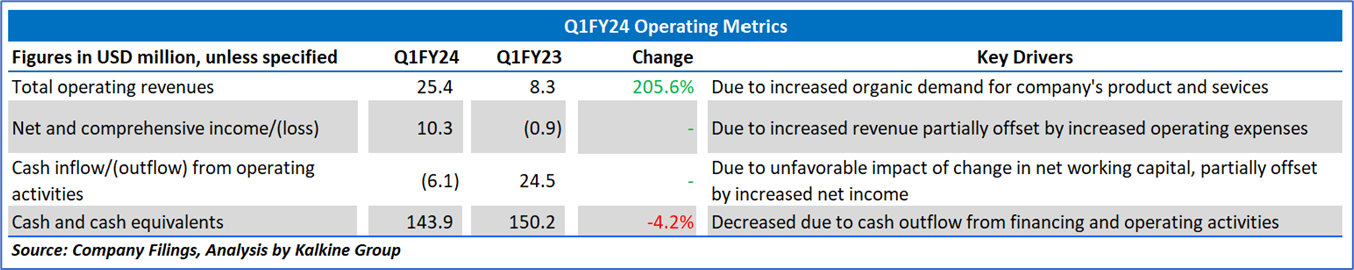
2.2 Insights of Q1FY24:
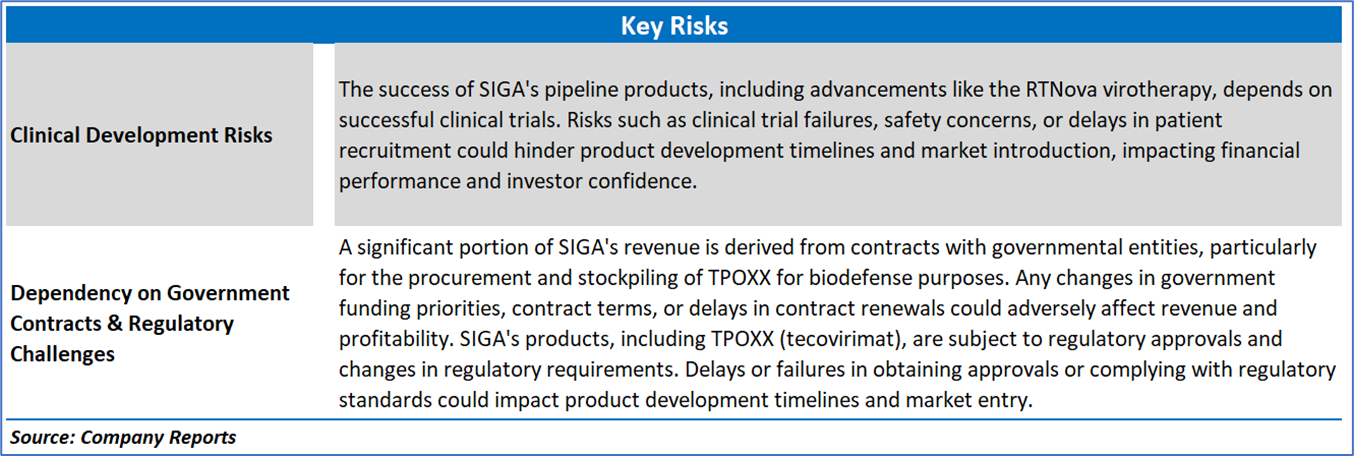
Section 3: Key Risks and Outlook:
Section 4: Stock Recommendation Summary:
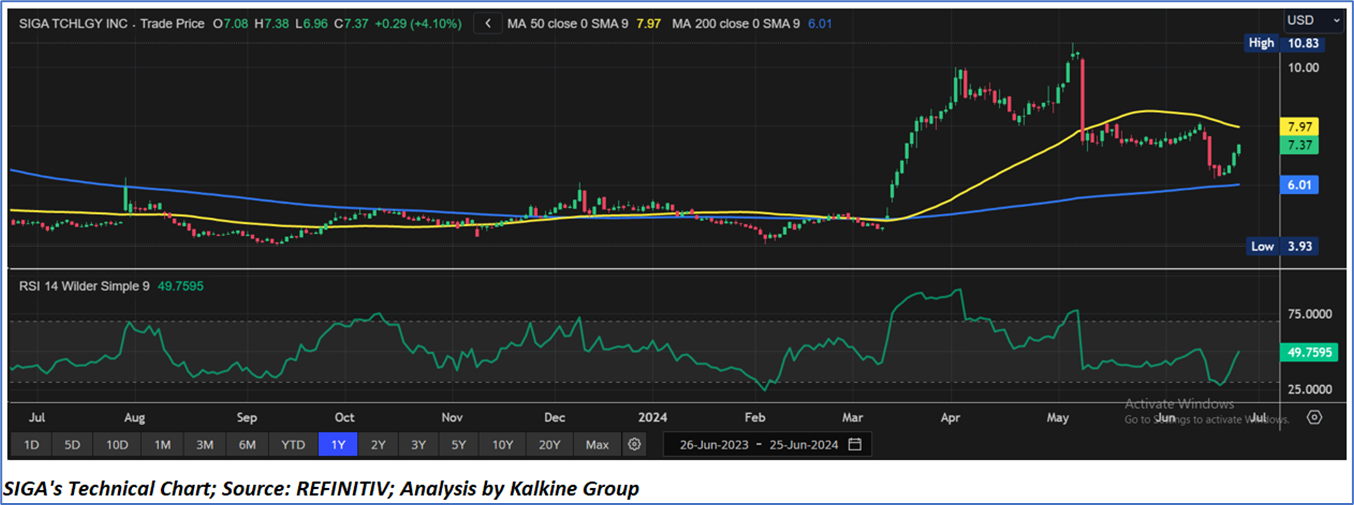
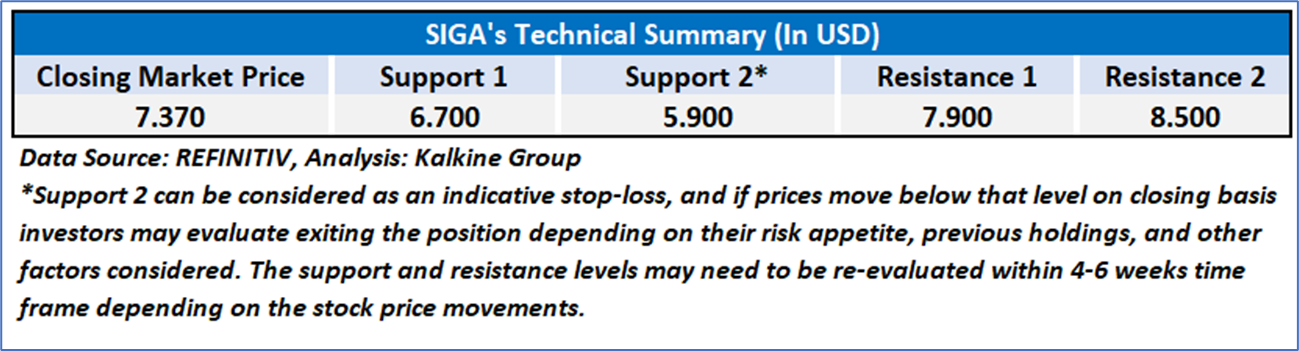
4.1 Technical Summary:
Price Performance:
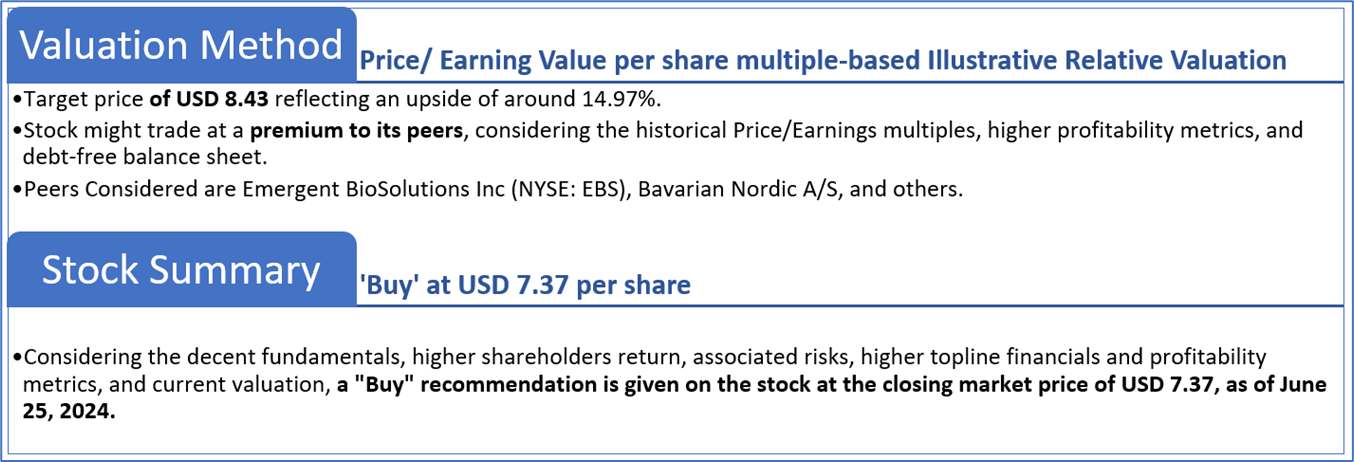
4.2 Fundamental Valuation
Valuation Methodology: Price/Earnings Per Share Multiple Based Relative Valuation

Markets are trading in a highly volatile zone currently due to certain macroeconomic issues and geopolitical tensions prevailing. Therefore, it is prudent to follow a cautious approach while investing.
Note 1: Past performance is not a reliable indicator of future performance.
Note 2: The reference date for all price data, currency, technical indicators, support, and resistance levels is June 25, 2024. The reference data in this report has been partly sourced from REFINITIV.
Note 3: Investment decisions should be made depending on an individual's appetite for upside potential, risks, holding duration, and any previous holdings. An 'Exit' from the stock can be considered if the Target Price mentioned as per the Valuation and or the technical levels provided has been achieved and is subject to the factors discussed above.
Note 4: The report publishing date is as per the Pacific Time Zone.
Technical Indicators Defined: -
Support: A level at which the stock prices tend to find support if they are falling, and a downtrend may take a pause backed by demand or buying interest. Support 1 refers to the nearby support level for the stock and if the price breaches the level, then Support 2 may act as the crucial support level for the stock.
Resistance: A level at which the stock prices tend to find resistance when they are rising, and an uptrend may take a pause due to profit booking or selling interest. Resistance 1 refers to the nearby resistance level for the stock and if the price surpasses the level, then Resistance 2 may act as the crucial resistance level for the stock.
Stop-loss: It is a level to protect against further losses in case of unfavorable movement in the stock prices.
Kalkine Equities LLC provides general information about companies and their securities. The information contained in the reports, including any recommendations regarding the value of or transactions in any securities, does not take into account any of your investment objectives, financial situation or needs. Kalkine Equities LLC is not registered as an investment adviser in the U.S. with either the federal or state government. Before you make a decision about whether to invest in any securities, you should take into account your own objectives, financial situation and needs and seek independent financial advice. All information in our reports represents our views as at the date of publication and may change without notice.
Kalkine Media LLC, an affiliate of Kalkine Equities LLC, may have received, or be entitled to receive, financial consideration in connection with providing information about certain entity(s) covered on its website.
Past performance is not a reliable indicator of future performance.
 Please wait processing your request...