Explore 3 Stock Ideas & Industry Insights Download Free Report

American Tech Report

Snowflake Inc.

Apr 21, 2026

  • SNOW:NYSE
  • Investment Type
    Large-cap
  • Risk Level
  • Action
  • Rec. Price (US$)

Section 1: Company Overview and Fundamentals

1.1 Company Overview:

Snowflake Inc. (NYSE: SNOW) is a data cloud and artificial intelligence company. Its platform is the technology that powers the AI Data Cloud, enabling customers to consolidate data into a single source of truth to drive meaningful insights, apply artificial intelligence (AI) to solve business problems, build data applications, and share data and data products. It provides its platform through a customer-centric, and consumption-based business model.

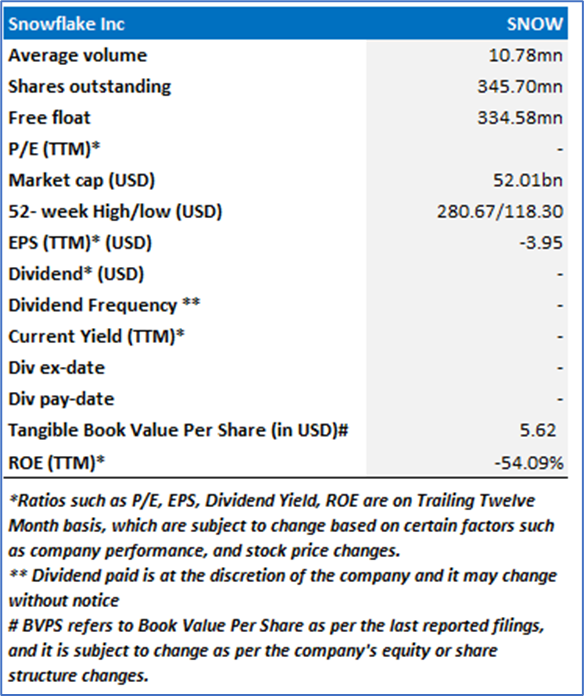
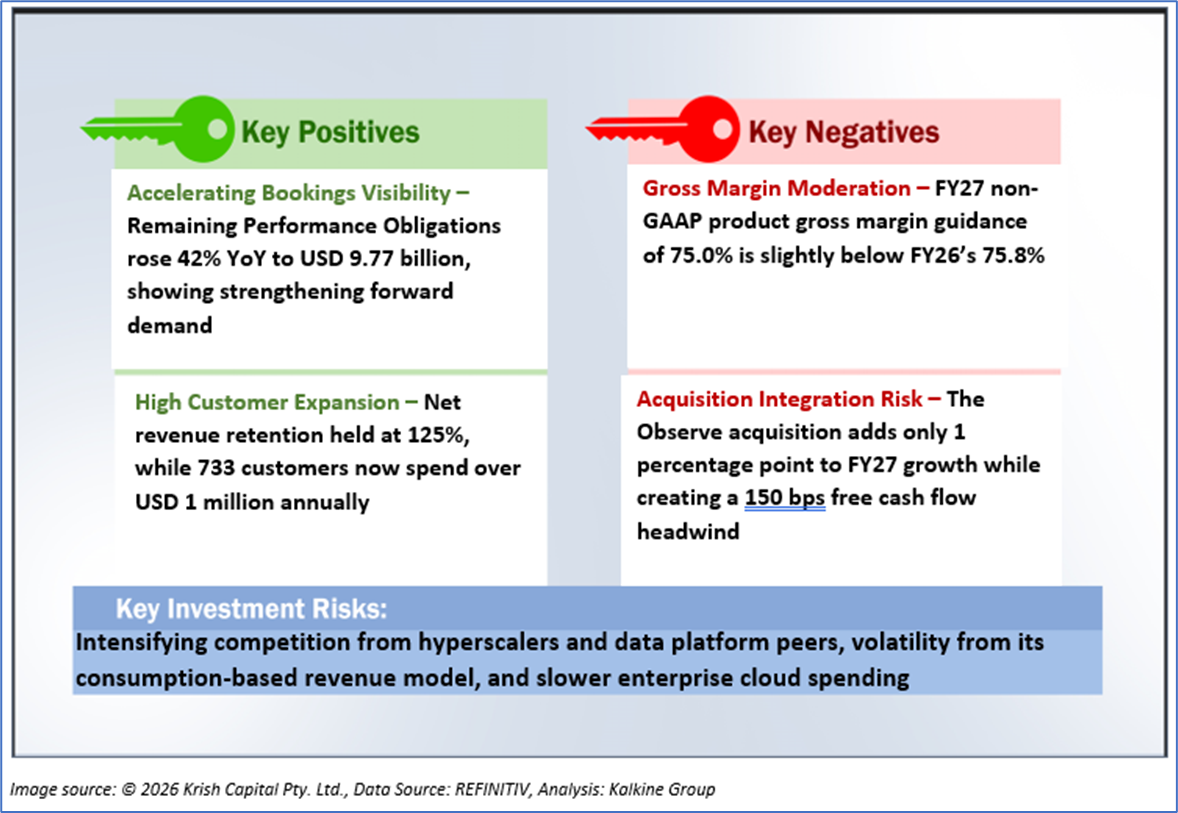
Kalkine’s American Tech Report covers the Company Overview, Key positives & negatives, Investment summary, Key investment metrics, Top 10 shareholding, Business updates and insights into company recent financial results, Key Risks & Outlook, Price performance and technical summary, Target Price, and Recommendation on the stock.
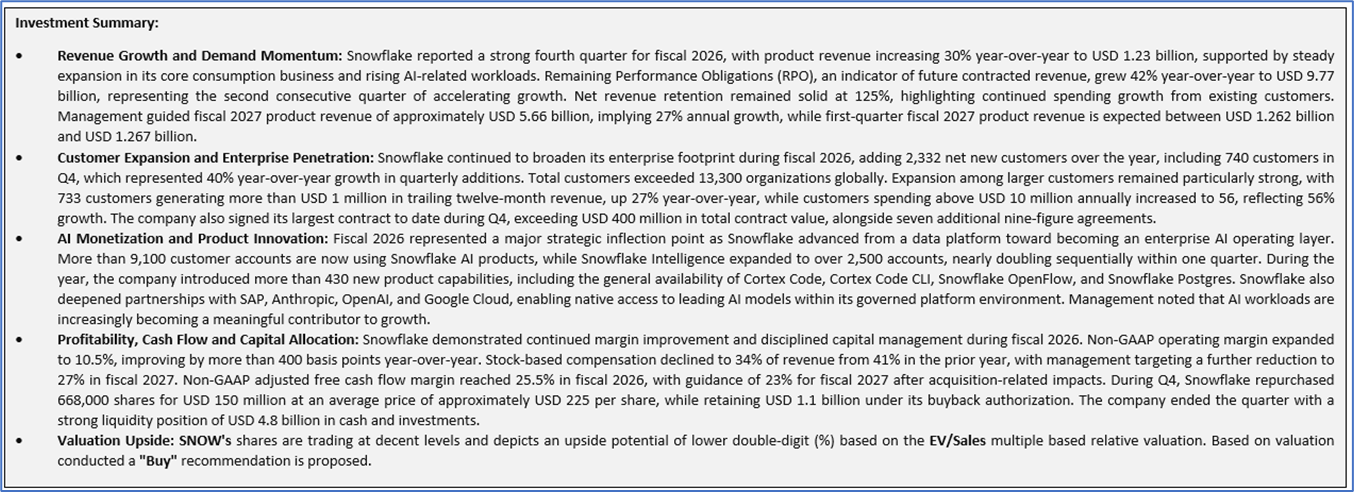
1.2 The Key Positives, Negatives, and Investment summary   
1.3 Top 10 shareholders:

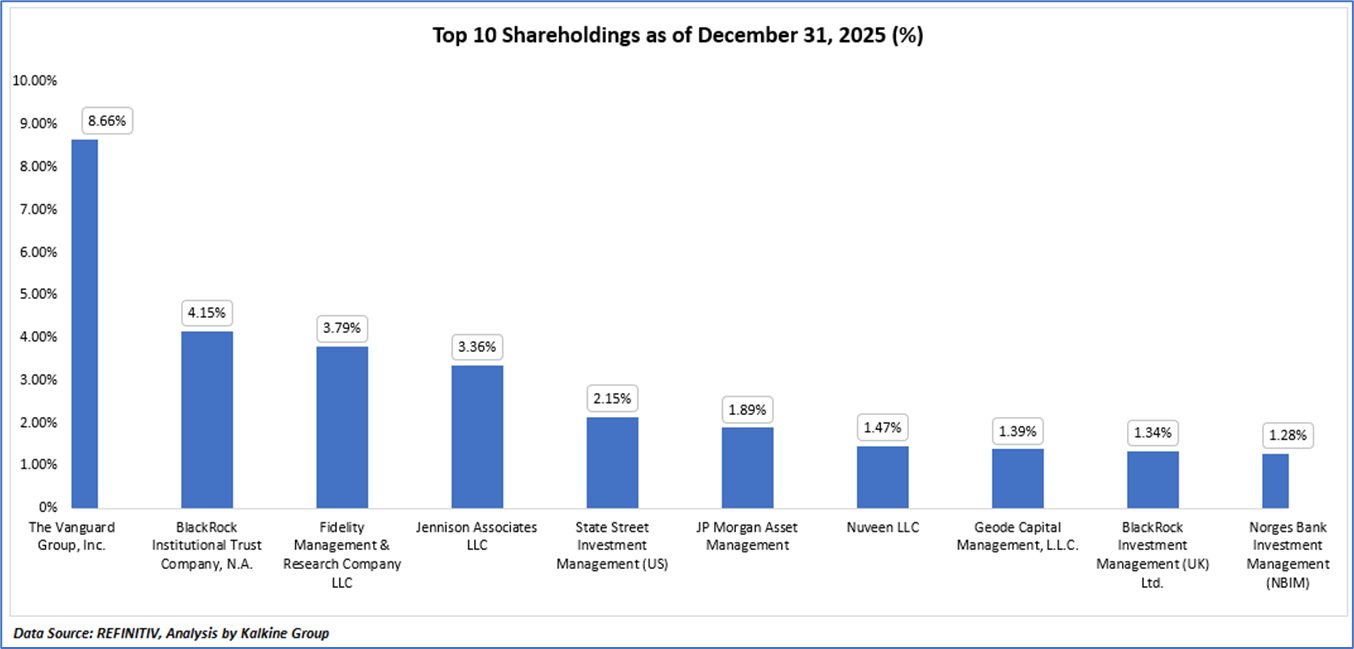
The top 10 shareholders together form ~29.49% of the total shareholding, signifying concentrated shareholding. The Vanguard Group, Inc. and BlackRock Institutional Trust Company, N.A. are the biggest shareholders, holding the maximum stake in the company at ~8.66% and ~4.15%, respectively.
1.4 Key Metrics:
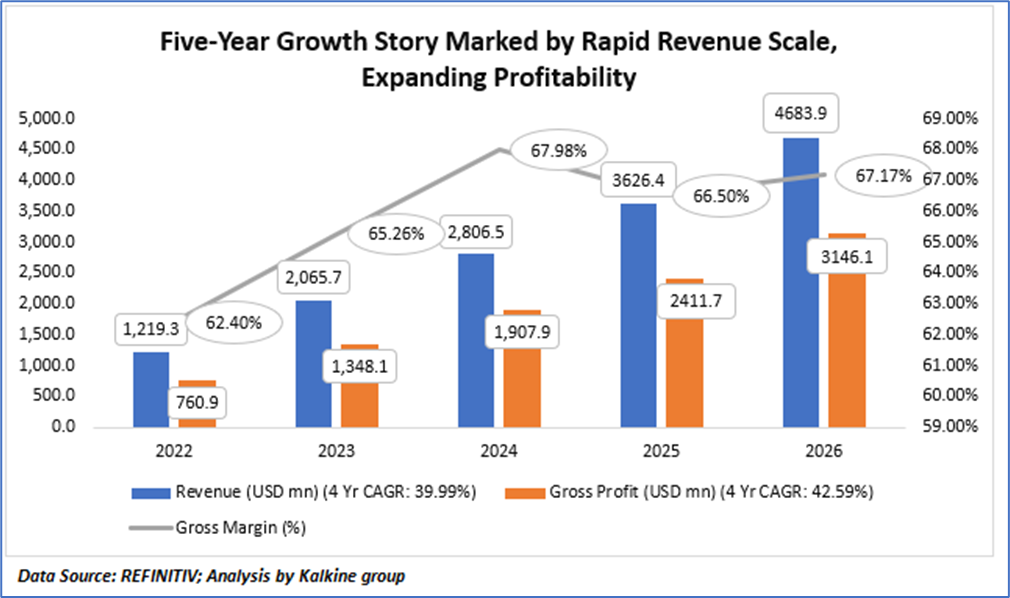
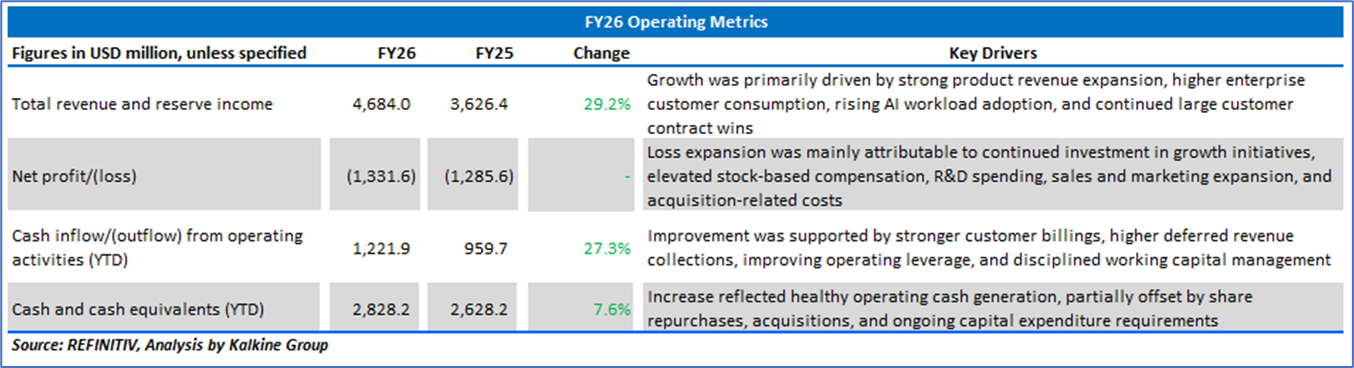
  • Revenue Growth: Snowflake has delivered a strong multi-year revenue expansion profile, with revenue increasing from USD 1,219.3 million in FY2022 to USD 4,683.9 million in FY2026, representing a robust 4-year CAGR of 39.99%. Revenue nearly quadrupled over the period, reflecting sustained enterprise customer acquisition, deeper workload penetration, and continued migration toward cloud-based data and analytics infrastructure. Annual progression remained consistently strong, rising to USD 2,065.7 million in FY2023, USD 2,806.5 million in FY2024, USD 3,626.4 million in FY2025, and USD 4,683.9 million in FY2026, demonstrating durable top-line momentum despite a more challenging macro environment.
  • Gross Profit Expansion: Gross profit growth has outpaced revenue growth over the same period, increasing from USD 760.9 million in FY2022 to USD 3,146.1 million in FY2026, implying an impressive 4-year CAGR of 42.59%. This indicates improving scale benefits, better monetization of the platform, and operating leverage within Snowflake’s infrastructure model. Gross profit rose sequentially to USD 1,348.1 million in FY2023, USD 1,907.9 million in FY2024, USD 2,411.7 million in FY2025, and USD 3,146.1 million in FY2026, highlighting that the company continues converting revenue growth into expanding gross earnings capacity.
  • Margin Performance and Efficiency Trends: Snowflake’s gross margin profile has remained structurally strong and improved over time, rising from 40% in FY2022 to 67.17% in FY2026. Margin expansion to 65.26% in FY2023 and 67.98% in FY2024 reflected scale efficiencies and optimized cloud infrastructure utilization. Although gross margin moderated to 66.50% in FY2025, it recovered to 67.17% in FY2026, indicating that profitability remains resilient even as the company invests in newer growth vectors such as AI workloads and broader platform capabilities. Sustained gross margins in the mid-to-high 60% range position Snowflake favorably versus many infrastructure-heavy software peers.
  • Overall Financial Interpretation: The five-year financial trend indicates that Snowflake is successfully balancing high growth with improving unit economics. Strong double-digit revenue growth, faster gross profit expansion, and stable-to-rising margins collectively suggest a scalable business model with increasing operational maturity. The data also implies that Snowflake’s platform continues to command pricing power and customer relevance while absorbing growth investments. If the company sustains similar revenue momentum and cost discipline, it remains well positioned for further margin expansion and long-term earnings inflection over the coming years.

Section 2: Business Updates and Financial Highlights

2.1 Recent Updates:

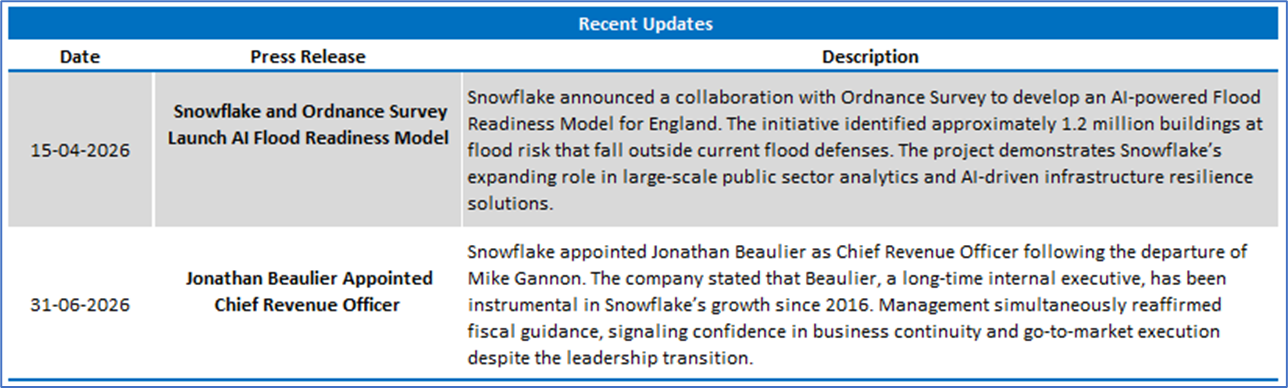
The below picture gives an overview of the recent updates:
 2.2 Insights of FY26:
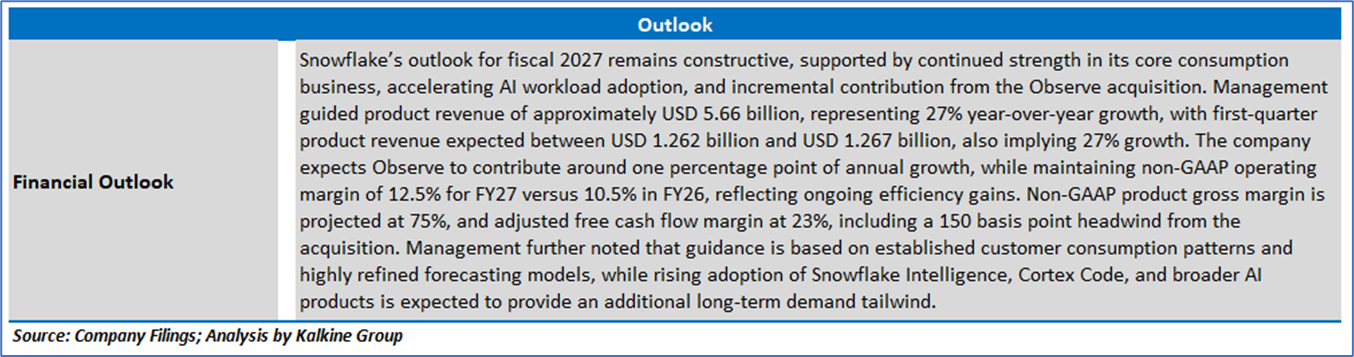
Section 3: Key Risks and Outlook:
Section 4: Stock Recommendation Summary:

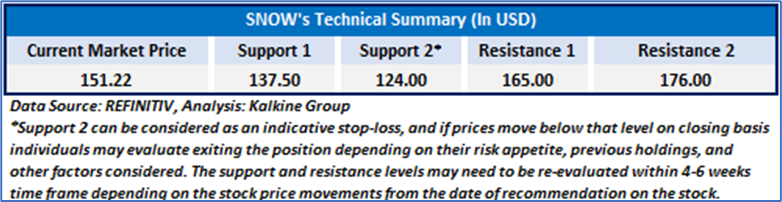
4.1 Technical Summary:

 Price Performance:
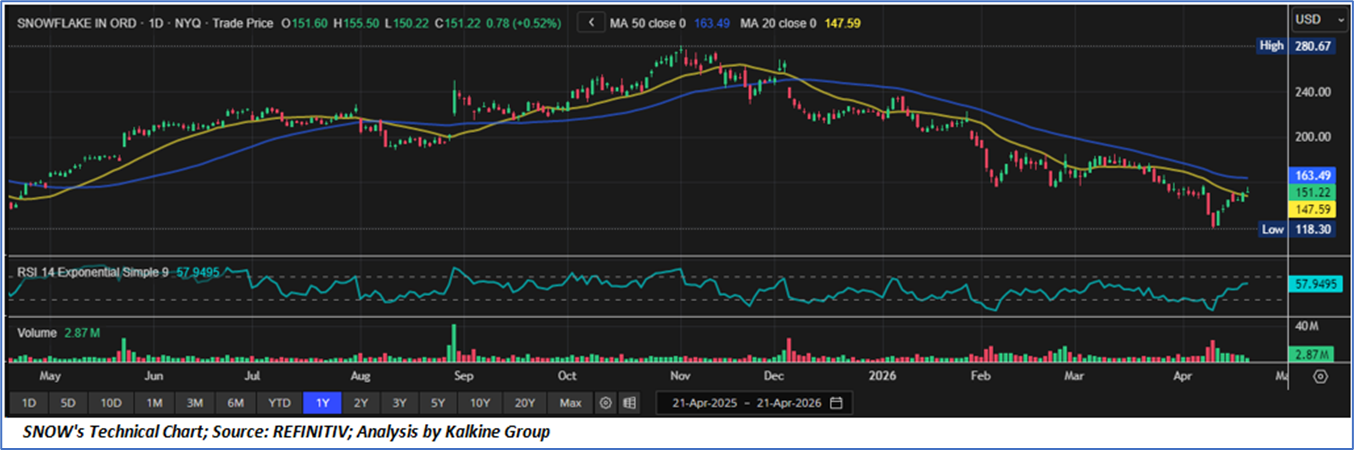
  • Trend Structure and Price Positioning: SNOW is exhibiting an increasingly constructive recovery profile after completing a prolonged corrective phase from the prior cycle high near USD 280.67 to the recent reaction low around USD 118.30. Price has staged a decisive rebound into the USD 151 zone and is now trading above the 20-day moving average at approximately USD 147.59, signaling restoration of short-term positive momentum. While the stock remains marginally below the 50-day moving average near USD 163.49, the narrowing spread between the shorter and longer averages indicates that bearish trend pressure is moderating materially. The recent sequence of higher lows from the April trough suggests a nascent base formation, with market participants increasingly willing to accumulate on pullbacks rather than extend downside pressure.
  • Momentum, Participation and Internal Strength: Momentum internals have improved notably, with the 14-day RSI advancing to approximately 95, which places the oscillator in constructive bullish territory without approaching overbought extremes. This configuration typically reflects strengthening upside participation while preserving capacity for additional price appreciation. Volume behavior also appears supportive, with recent rebound sessions accompanied by firmer turnover relative to preceding consolidation phases, implying genuine demand rather than purely technical short-covering. The absence of momentum divergence during the recent advance further strengthens the argument that the current rebound possesses healthier underlying breadth than prior failed rallies observed during the broader downtrend.
  • Key Levels, Tactical Outlook and Forward Bias: From a tactical perspective, the immediate resistance zone is situated at USD 155–163, where horizontal supply converges with the descending 50-day moving average. A decisive breakout above this band would likely confirm a medium-term trend transition and open upside scope toward USD 175, followed by the psychologically significant USD 190 On the downside, the USD 147 area now represents first dynamic support, while stronger structural support remains near USD 135–138. Provided SNOW sustains above its 20-day average and continues printing higher lows, the prevailing near-term bias remains moderately bullish, with improving risk-reward characteristics for continuation participants.


4.2 Fundamental Valuation

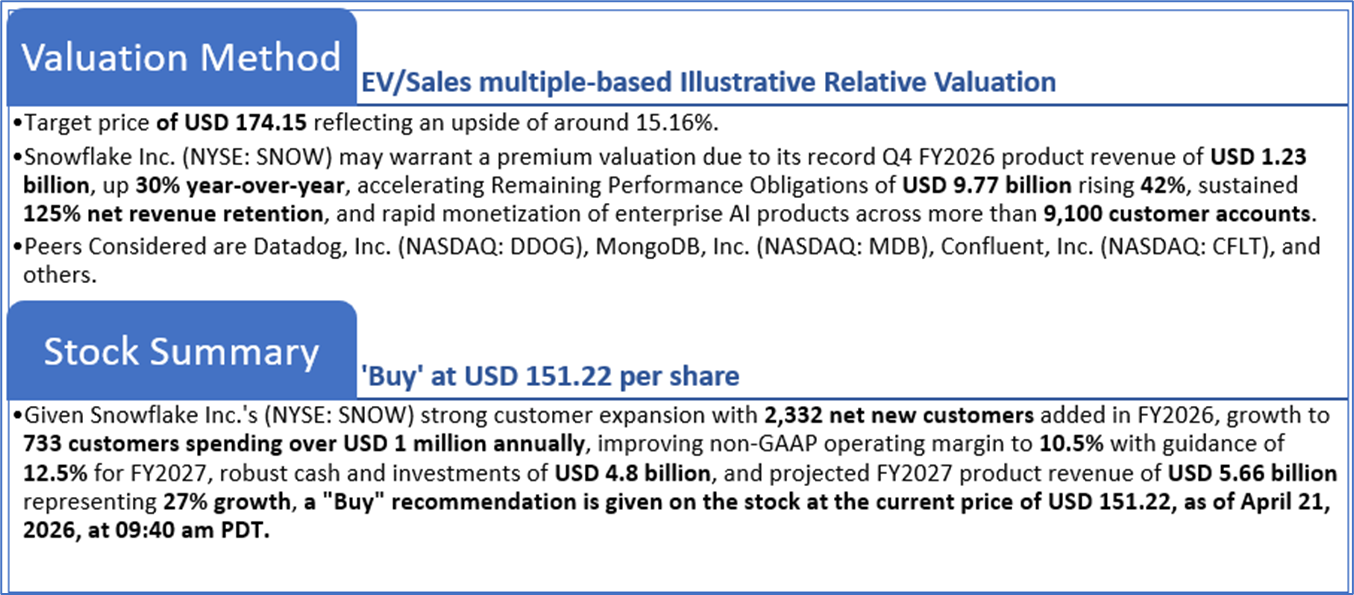
Valuation Methodology: EV/Sales Multiple Based Relative Valuation
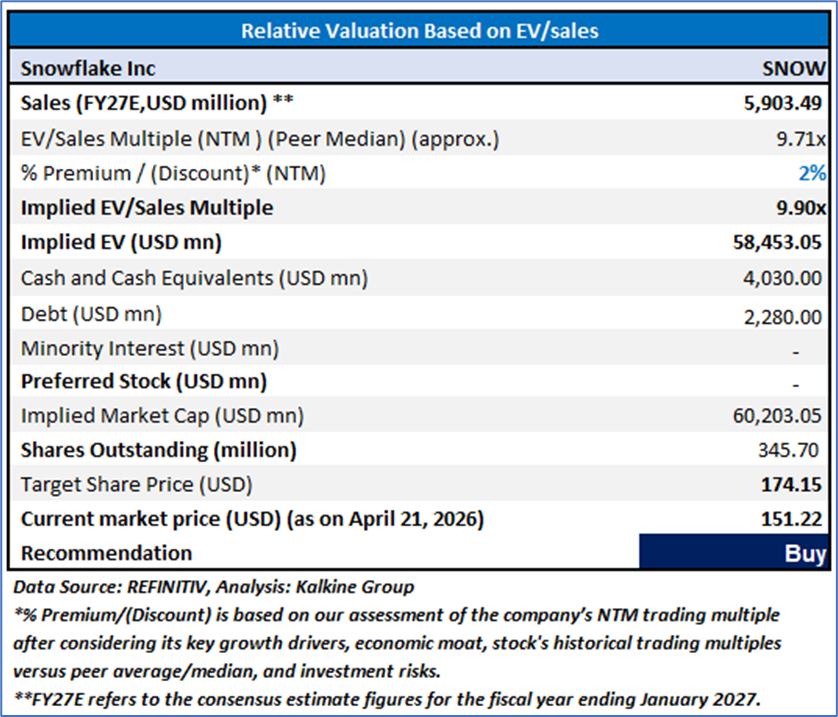
Markets are trading in a highly volatile zone currently due to certain macroeconomic issues and geopolitical tensions prevailing. Therefore, it is prudent to follow a cautious approach while investing.

Note 1: Past performance is not a reliable indicator of future performance.

Note 2: The reference date for all price data, currency, technical indicators, support, and resistance levels is April 21, 2026. The reference data in this report has been partly sourced from REFINITIV.

Note 3: Investment decisions should be made depending on an individual's appetite for upside potential, risks, holding duration, and any previous holdings. An 'Exit' from the stock can be considered if the Target Price mentioned as per the Valuation and or the technical levels provided has been achieved and is subject to the factors discussed above.

Note 4: The report publishing date is as per the Pacific Time Zone.

Technical Indicators Defined: -

Support: A level at which the stock prices tend to find support if they are falling, and a downtrend may take a pause backed by demand or buying interest. Support 1 refers to the nearby support level for the stock and if the price breaches the level, then Support 2 may act as the crucial support level for the stock.

 Resistance: A level at which the stock prices tend to find resistance when they are rising, and an uptrend may take a pause due to profit booking or selling interest. Resistance 1 refers to the nearby resistance level for the stock and if the price surpasses the level, then Resistance 2 may act as the crucial resistance level for the stock.

 Stop-loss: It is a level to protect against further losses in case of unfavorable movement in the stock prices. 


Disclaimer-

Kalkine Equities LLC, with Delaware File Number 4697384, Foreign Qualification Registration in California File Number 202109211078, and Texas File Number 805521396, is authorized to provide general advice only. The information on https://kalkine.com/ does not take into account any of your investment objectives, financial situation or needs. You should consider the appropriateness of advice taking into account your own objectives, financial situation and needs and seek independent financial advice before making any financial decisions. The link to our Terms and Conditions  and Privacy Policy has been provided for your reference. On the date of publishing the reports (mentioned on the website), employees and/or associates of Kalkine do not hold positions in any of the stocks covered on the website. These stocks can change any time and readers of the reports should not consider these stocks as advice or recommendations later.

Past performance is not a reliable indicator of future performance.

Support

Hi! How can we help you today?

Loading…