
Section 1: Company Overview and Fundamentals
1.1 Company Overview:
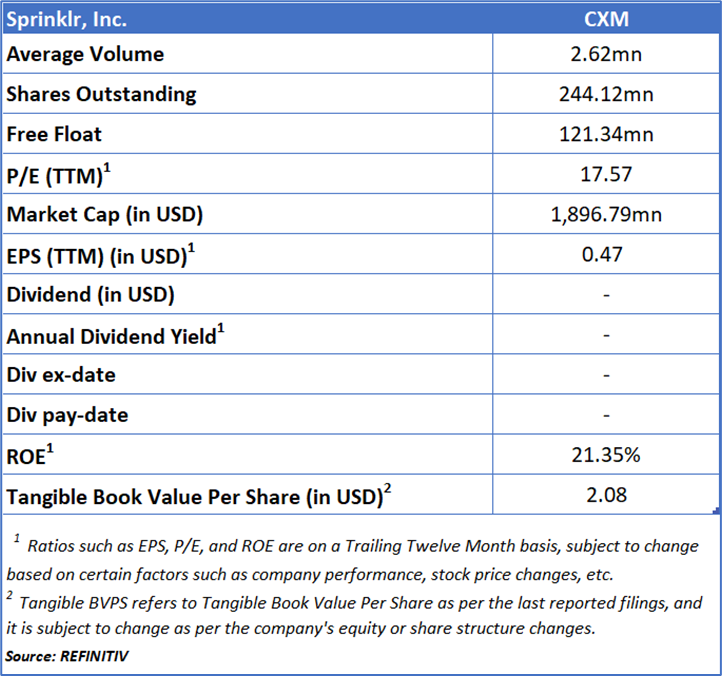
Sprinklr, Inc. (NYSE: CXM) is an enterprise software provider focused on customer-facing operations. Its AI-powered Unified Customer Experience Management (Unified-CXM) platform helps service, marketing, and other front-office teams work seamlessly across organizational silos, engage customers across digital channels, and apply AI-driven insights to enhance the overall customer experience.
Kalkine’s Diversified Opportunities Report covers the Company Overview, Key positives & negatives, Investment summary, Key investment metrics, Top 10 shareholding, Business updates and insights into company recent financial results, Key Risks & Outlook, Price performance and technical summary, Target Price, and Recommendation on the stock.
Stock Performance:
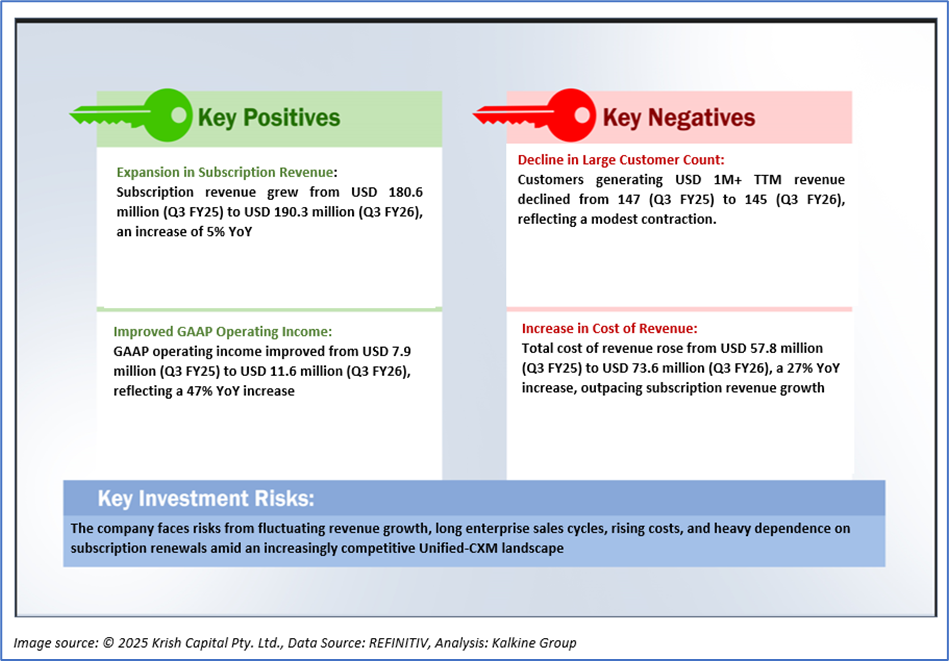
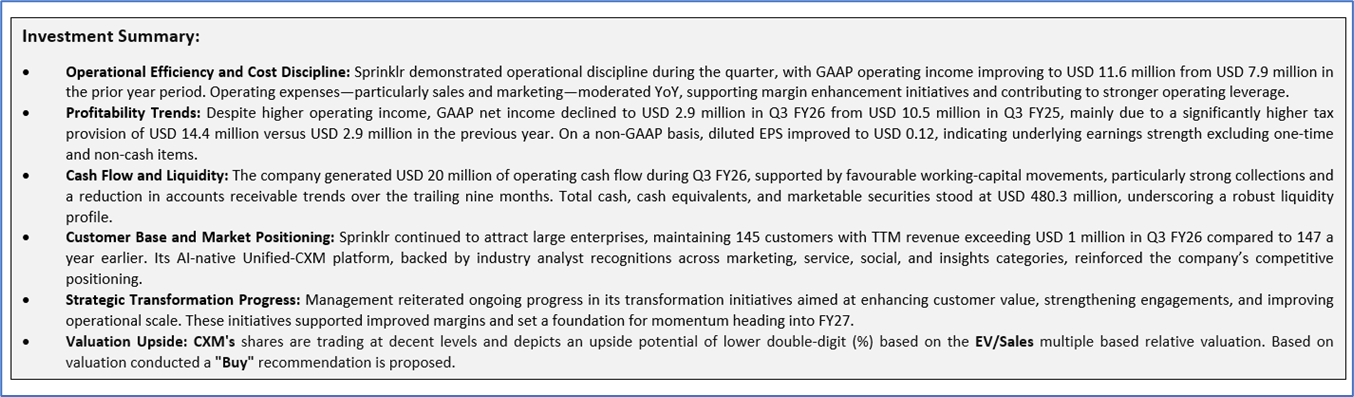
1.2 The Key Positives, Negatives, and Investment summary
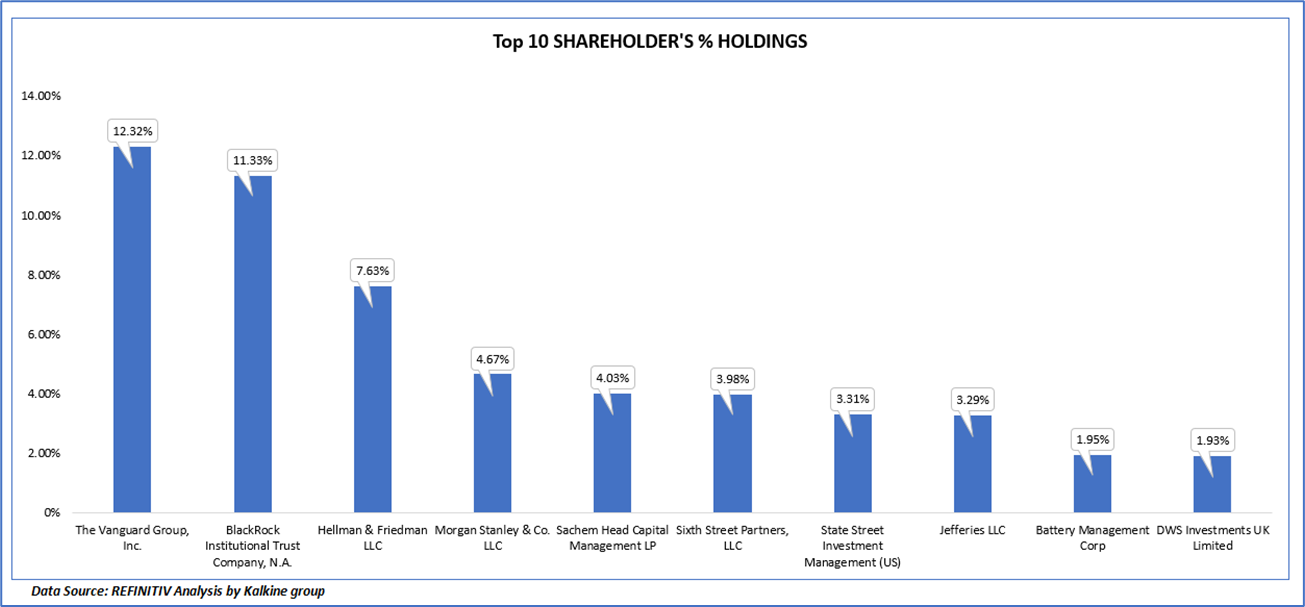
1.3 Top 10 shareholders:
The top 10 shareholders together form ~ 54.43% of the total shareholding, signifying concentrated shareholding. The Vanguard Group, Inc. and BlackRock Institutional Trust Company, N.A. are the biggest shareholders, holding the maximum stake in the company at 12.32% and 11.33%, respectively.
1.4 Key Metrics:
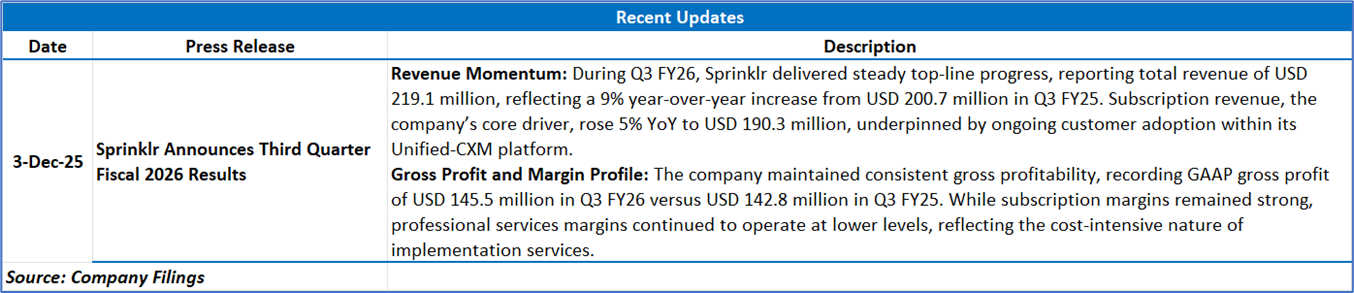
The trends in the chart reflect Sprinklr’s strengthening liquidity and operating efficiency over the period, driven largely by improved collections, a significant reduction in accounts receivable, and steady subscription revenue growth. Cash and free cash flow rise notably in Q4 FY25 and Q1 FY26 due to strong operating inflows, while the dip in Q2 FY26 stems mainly from billing softness and substantial share repurchases that temporarily pressured the current ratio. The sharp rebound in Q3 FY26 is supported by robust cash generation, improved profitability, and stable short-term liabilities, underscoring the company’s disciplined financial management and operational momentum.
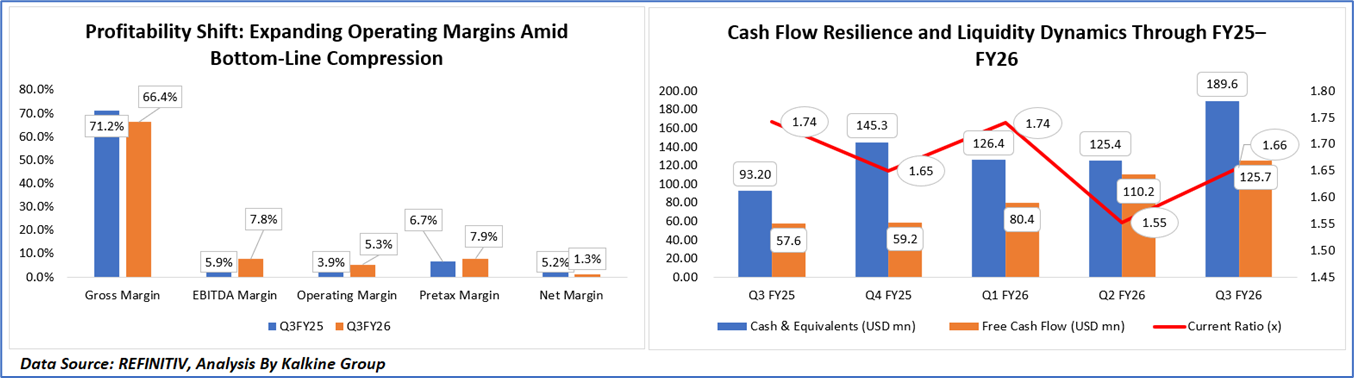
The shift in profitability metrics reflects a combination of operating improvements and one-off financial impacts. Gross margin declined modestly due to higher costs of revenue, particularly in subscription and professional services delivery, which outpaced revenue growth. In contrast, EBITDA and operating margins improved on the back of tighter cost discipline, lower sales and marketing spending, and stronger operating leverage. Pretax margins strengthened as operating income increased meaningfully year over year; however, net margin fell sharply because of a substantial rise in the tax provision—from USD 2.9 million in Q3 FY25 to USD 14.4 million in Q3 FY26 which compressed bottom-line profitability despite operational gains. Overall, the trend reflects underlying margin improvement masked at the net level by an unusually high tax charge for the quarter.
Section 2: Business Updates and Corporate Business Highlights
2.1 Recent Business Updates
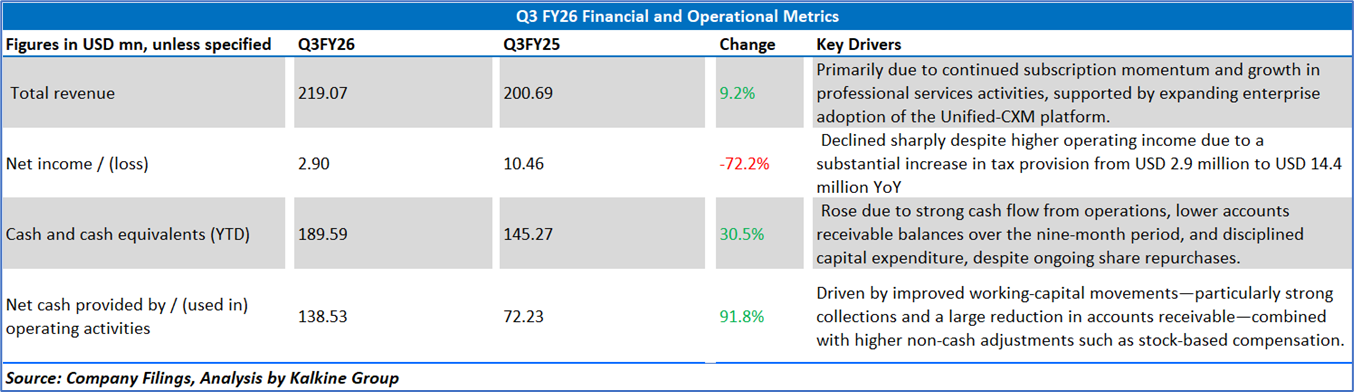
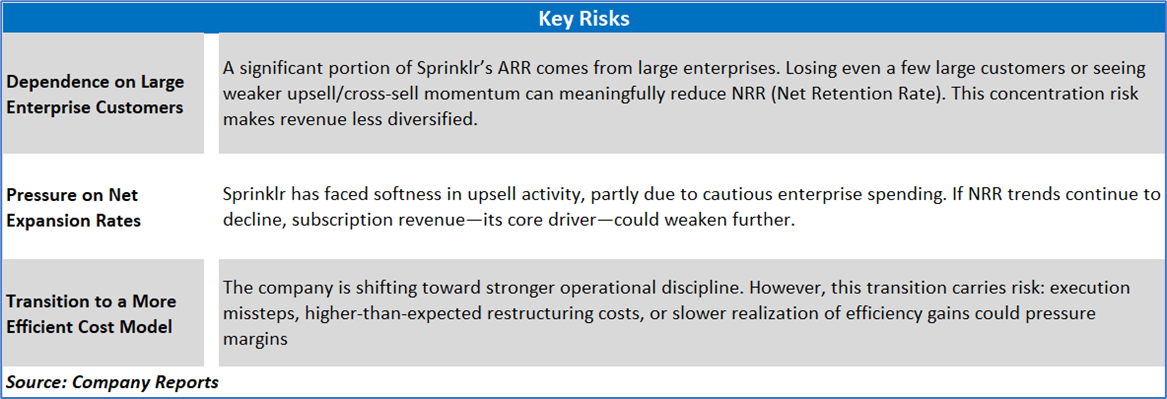
2.2 Insights of Q3FY26:
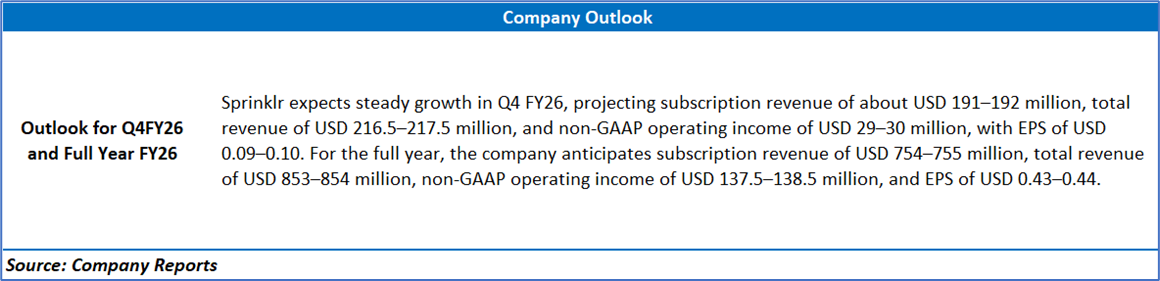
Section 3: Key Risks & Outlook
Section 4: Stock Recommendation Summary:
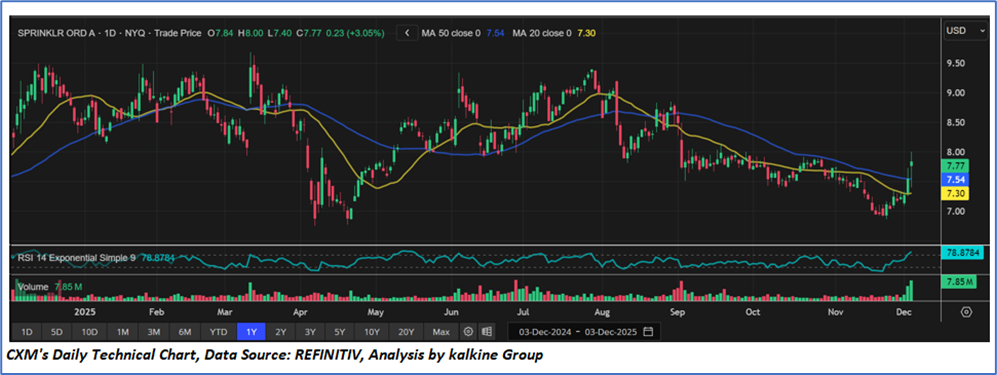
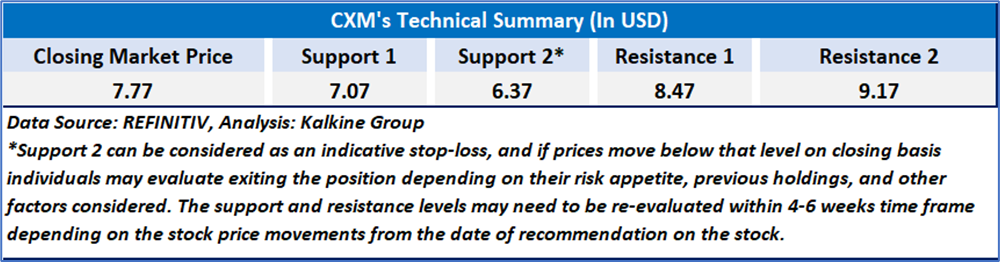
4.1 Price Performance and Technical Summary:
Stock Performance:
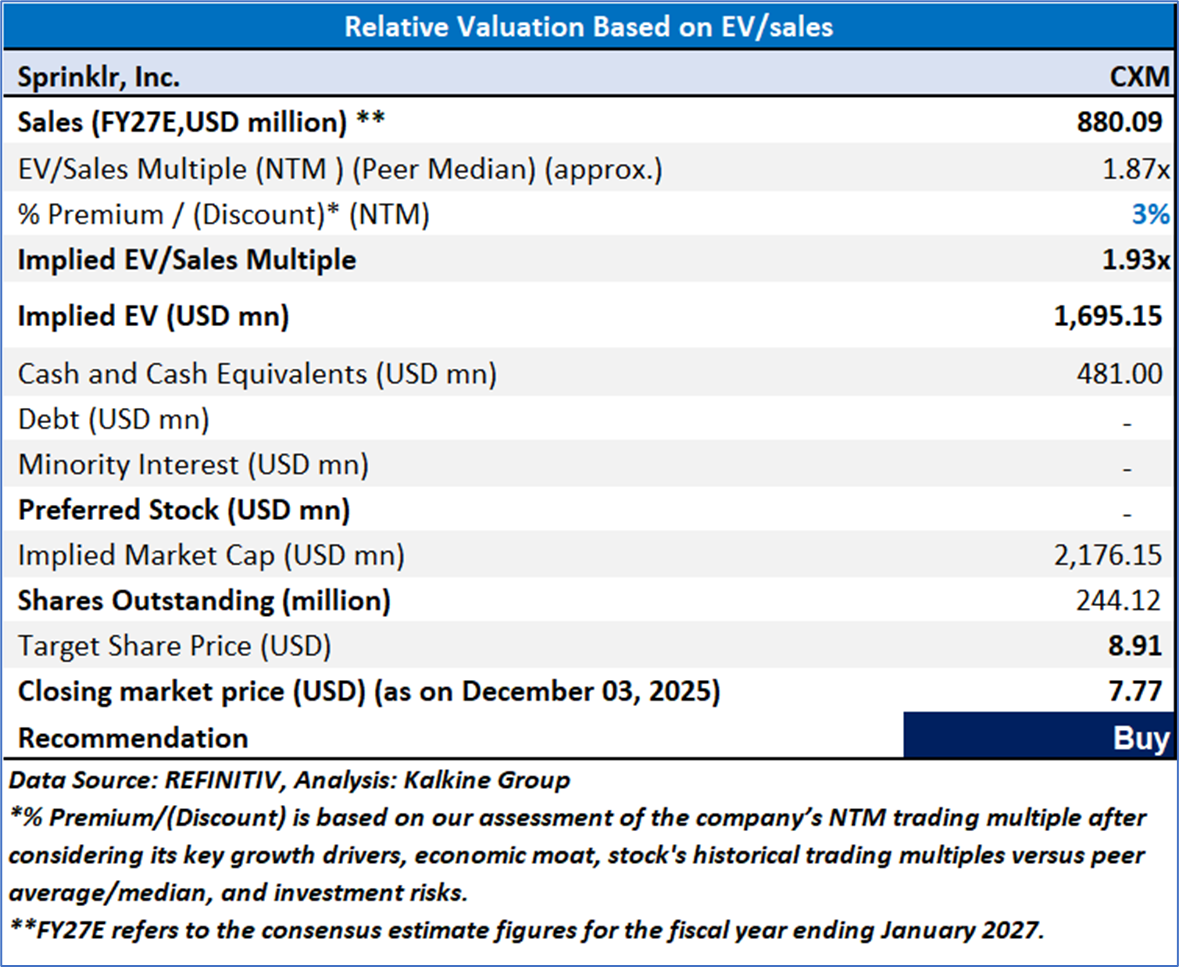
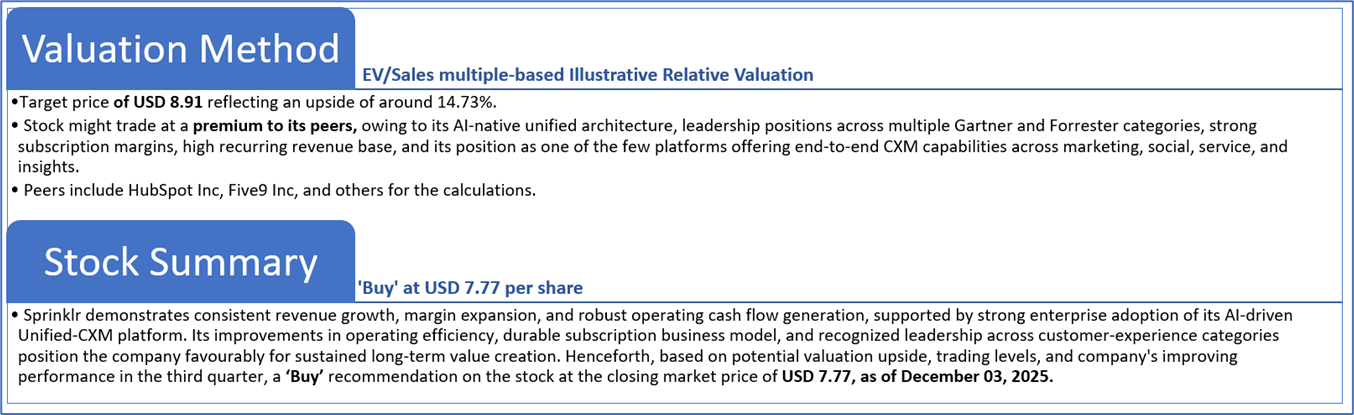
4.2 Fundamental Valuation
Valuation Methodology: EV/Sales Multiple Based Relative Valuation
Markets are trading in a highly volatile zone currently due to certain macroeconomic issues and geopolitical tensions prevailing. Therefore, it is prudent to follow a cautious approach while investing.
Note 1: Past performance is not a reliable indicator of future performance.
Note 2: The reference date for all price data, currency, technical indicators, support, and resistance levels is December 03, 2025. The reference data in this report has been partly sourced from REFINITIV.
Note 3: Investment decisions should be made depending on an individual's appetite for upside potential, risks, holding duration, and any previous holdings. An 'Exit' from the stock can be considered if the Target Price mentioned as per the Valuation and or the technical levels provided has been achieved and is subject to the factors discussed above.
Note 4: The report publishing date is as per the Pacific Time Zone.
Technical Indicators Defined: -
Support: A level at which the stock prices tend to find support if they are falling, and a downtrend may take a pause backed by demand or buying interest. Support 1 refers to the nearby support level for the stock and if the price breaches the level, then Support 2 may act as the crucial support level for the stock.
Resistance: A level at which the stock prices tend to find resistance when they are rising, and an uptrend may take a pause due to profit booking or selling interest. Resistance 1 refers to the nearby resistance level for the stock and if the price surpasses the level, then Resistance 2 may act as the crucial resistance level for the stock.
Stop-loss: It is a level to protect against further losses in case of unfavorable movement in the stock prices.
Kalkine Equities LLC, with Delaware File Number 4697384, Foreign Qualification Registration in California File Number 202109211078, and Texas File Number 805521396, is authorized to provide general advice only. The information on https://kalkine.com/ does not take into account any of your investment objectives, financial situation or needs. You should consider the appropriateness of advice taking into account your own objectives, financial situation and needs and seek independent financial advice before making any financial decisions. The link to our Terms and Conditions and Privacy Policy has been provided for your reference. On the date of publishing the reports (mentioned on the website), employees and/or associates of Kalkine do not hold positions in any of the stocks covered on the website. These stocks can change any time and readers of the reports should not consider these stocks as advice or recommendations later.
Past performance is not a reliable indicator of future performance.
 Please wait processing your request...