
The US Fund Report
This week’s report covers Leverage Shares 2X Long CRM Daily ETF & Leverage Shares 2X Long ASML Daily ETF which are ‘Directional Leveraged ETFs’ that use financial derivatives and debt to amplify the returns of an underlying index, typically by 2x or 3x. These leveraged ETFs aim to provide magnified exposure to the price movements of a specific asset class, either in the direction of rising (bullish) or falling (bearish) prices.
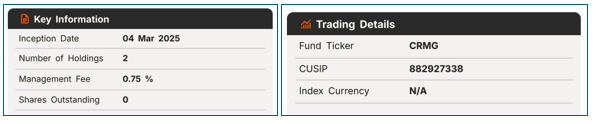
Section 1: Leverage Shares 2X Long CRM Daily ETF
The Fund seeks daily leveraged investment results and is very different from most other exchange-traded funds. The Fund invests at least 80% of its net assets (plus borrowings for investment purposes) in financial instruments with economic characteristics that provide 200% daily leveraged exposure to the price of CRM.
Its performance over extended periods diverges from the expected 200% due to the compounding effect of daily returns, which is influenced by factors like holding duration and stock volatility. High volatility amplifies the impact of compounding, potentially leading to significant deviations from the underlying stock’s performance. Consequently, this ETF is designed for short-term trading rather than buy-and-hold strategies.
Underlying Stock: Salesforce Inc (NYSE: CRM)
Salesforce Inc. is a provider of customer relationship management (CRM) technology. The Company helps organizations of any size reimagine their business for the world of artificial intelligence (AI). With Agent force, its platform, organizations can bring humans together with AI agents to drive customer success on one deeply unified platform. With the Salesforce platform, it delivers a single source of truth, connecting customer data with integrated AI across systems, apps and devices to help companies sell, service, market and conduct commerce from anywhere.
Section 2: Technical Analysis on ETF and Underlying Asset
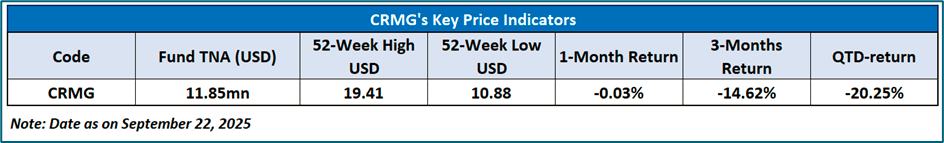
NASDAQ: CRMG
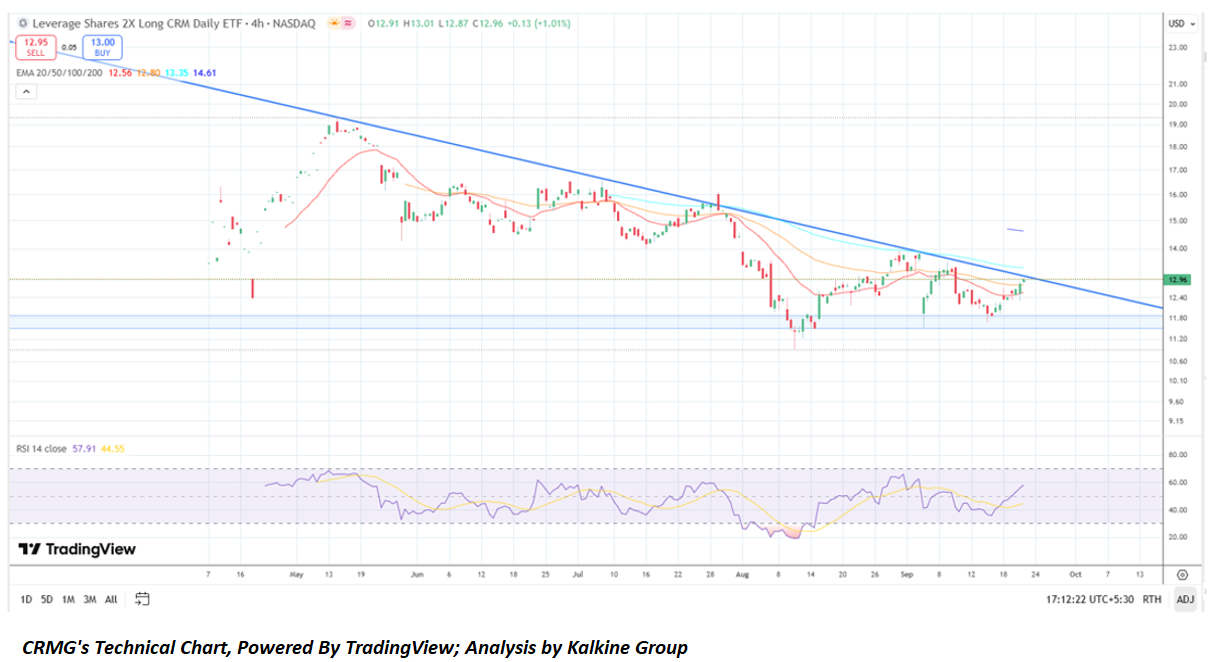
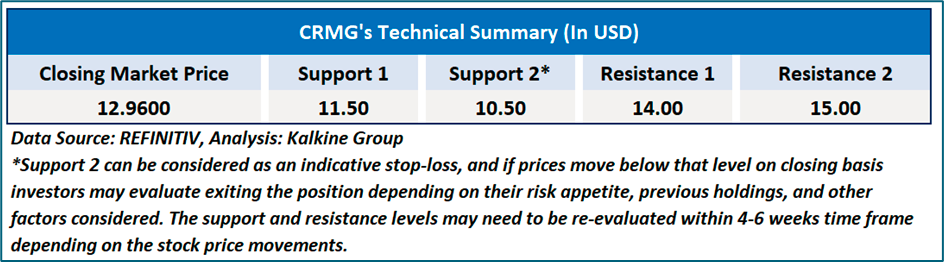
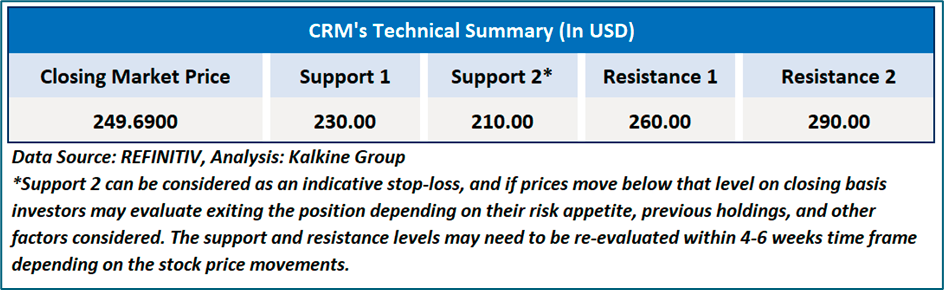
The technical structure of CRMG indicates that the security remains within a broader downtrend, as evidenced by the prevailing descending trendline and bearish alignment of key moving averages; however, the price is currently positioned at a critical juncture near the USD 12.9–13.5 resistance zone, coinciding with both trendline and short-term EMA levels. The recent higher low formation and an improving RSI at approximately 58 suggest a gradual strengthening of buying momentum, though a decisive breakout above USD 13.5 would be required to confirm a potential shift toward bullish sentiment, with subsequent upside targets near USD 14.6 and USD 15.0. Conversely, failure to sustain this upward attempt may invite renewed selling pressure, with immediate support situated at USD 11.8 and a further decline toward USD 10.5 if breached.
Underlying Asset Analysis: NYSE: CRM
Salesforce (CRM) is displaying early signs of bullish momentum, as the recent rebound to USD 249.7 positions the stock near its descending trendline resistance while reclaiming short-term moving averages. The improvement of RSI at approximately 53 suggests strengthening buying interest, supporting the potential for a trend reversal. A decisive breakout above the USD 258–260 zone could confirm a shift in sentiment and pave the way for further upside toward USD 268 and beyond, indicating that the stock may be in the process of building a stronger recovery base after a prolonged corrective phase.
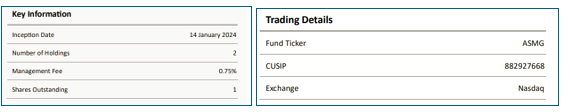
Section 1: Leverage Shares 2X Long ASML Daily ETF
The Fund seeks daily leveraged investment results and is very different from most other exchange-traded funds. The fund is an exchange traded fund that seeks daily levered investment results, before fees and expenses, of two times (200%) of the daily percentage change in the price of the common stock of ASML.
Its performance over extended periods diverges from the expected 200% due to the compounding effect of daily returns, which is influenced by factors like holding duration and stock volatility. High volatility amplifies the impact of compounding, potentially leading to significant deviations from the underlying stock’s performance. Consequently, this ETF is designed for short-term trading rather than buy-and-hold strategies.
Underlying Stock: ASML Holding NV
ASML Holding N.V. is a holding company based in the Netherlands. The Company operates through its subsidiaries in the Netherlands, the United States, Italy, France, Germany, the United Kingdom, Ireland, Belgium, South Korea, Taiwan, Singapore, China, Hong Kong, Japan, Malaysia and Israel. The Company operates through one business segment which is engage in development, production, marketing, sales, upgrading and servicing of advanced semiconductor equipment systems, consisting of lithography, metrology and inspection systems.
Section 2: Technical Analysis on ETF and Underlying Asset
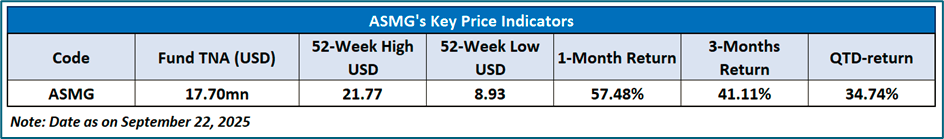
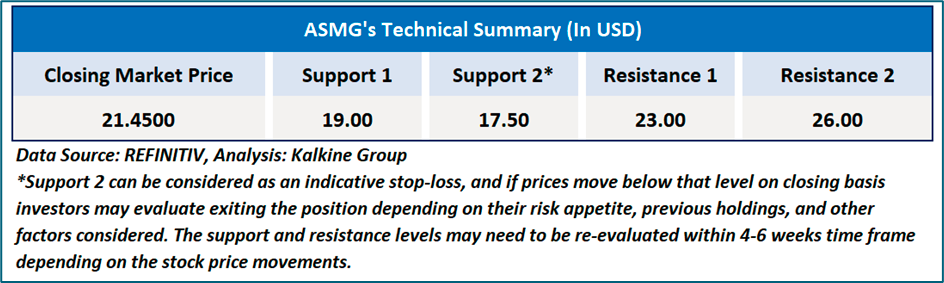
NASDAQ: ASMG
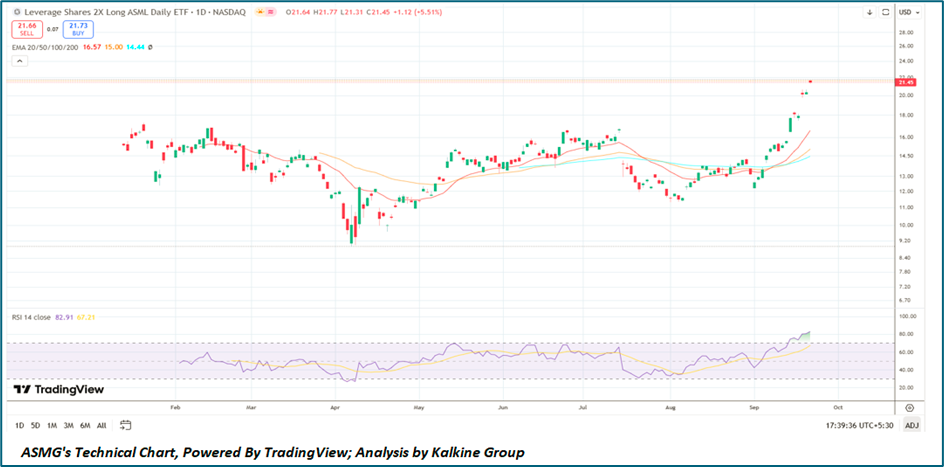
ASMG has experienced a strong upward movement, with the price currently trading near USD 21.45 after a sharp rally from mid-September, supported by sustained buying pressure that has lifted it well above its key moving averages. The short-term EMAs have turned upward, reflecting strengthening momentum, while the RSI, positioned at approximately 83, signals overbought conditions that may warrant caution in the near term. Although the prevailing trend indicates bullish strength, the elevated RSI suggests the possibility of consolidation or a minor pullback before the next directional move, with immediate support around USD 18.5–19.0 and resistance likely near USD 22.5–23.0.
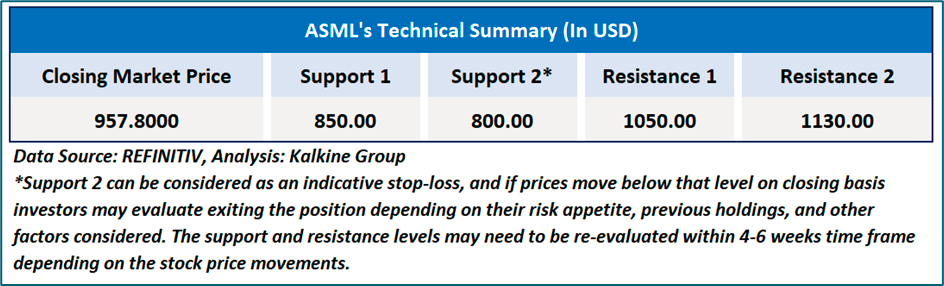
Underlying Asset Analysis: NASDAQ: ASML
ASML is demonstrating strong upward momentum, with the stock closing at USD 957.8 after an accelerated rally in recent sessions, supported by a decisive breakout above key moving averages that have now aligned positively. The RSI at approximately 82 indicates overbought conditions, yet it also reflects the strength of the prevailing trend, underscoring robust buying interest. While some short-term consolidation cannot be ruled out given the steep rise, the overall structure suggests further upside potential if the stock sustains above USD 940, with the next resistance anticipated around USD 990, while immediate support rests near USD 900.
Related Risk: Investing in the Fund carries inherent risks, including potential losses. The Fund's NAV and performance are influenced by various factors. Key risks include the effects of compounding, market volatility, and underlying stock risks, which can significantly impact returns and increase the likelihood of financial losses.
Note 1: Past performance is not a reliable indicator of future performance.
Note 2: The reference date for all price data, currency, technical indicators, support, and resistance level is September 22, 2025. The reference data in this report has been partly sourced from REFINITIV
Note 3: ‘Kalkine reports are prepared based on the stock prices captured either from the New York Stock Exchange (NYSE), NASDAQ Capital Markets (NASDAQ), and or REFINITIV. Typically, all sources (NYSE, NASDAQ, or REFINITIV) may reflect stock prices with a delay which could be a lag of 25-30 minutes. There can be no assurance that future results or events will be consistent with the information provided in the report. The information is subject to change without any prior notice.
Kalkine Equities LLC, with Delaware File Number 4697384, Foreign Qualification Registration in California File Number 202109211078, and Texas File Number 805521396, is authorized to provide general advice only. The information on https://kalkine.com/ does not take into account any of your investment objectives, financial situation or needs. You should consider the appropriateness of advice taking into account your own objectives, financial situation and needs and seek independent financial advice before making any financial decisions. The link to our Terms and Conditions and Privacy Policy has been provided for your reference. On the date of publishing the reports (mentioned on the website), employees and/or associates of Kalkine do not hold positions in any of the stocks covered on the website. These stocks can change any time and readers of the reports should not consider these stocks as advice or recommendations later.
Past performance is not a reliable indicator of future performance.
 Please wait processing your request...