
Overview
Dynamic Core ETF Report covers an innovative investment product, an actively managed ETF that seek capital appreciation by investing in U.S. equities and other instruments. It dynamically adjusts its exposure based on market volatility, aiming to reduce risk during turbulent periods and increase exposure when conditions are favourable, providing a flexible strategy to manage market fluctuations.
This week’s report covers Leverage Shares 2X Long NVDA Daily ETF & GraniteShares 2x Long AMD Daily ETF which are ‘Directional Leveraged ETFs’ that use financial derivatives and debt to amplify the returns of an underlying index, typically by 2x or 3x. These leveraged ETFs aim to provide magnified exposure to the price movements of a specific asset class, either in the direction of rising (bullish) or falling (bearish) prices.
Section 1: Leverage Shares 2X Long NVDA Daily ETF
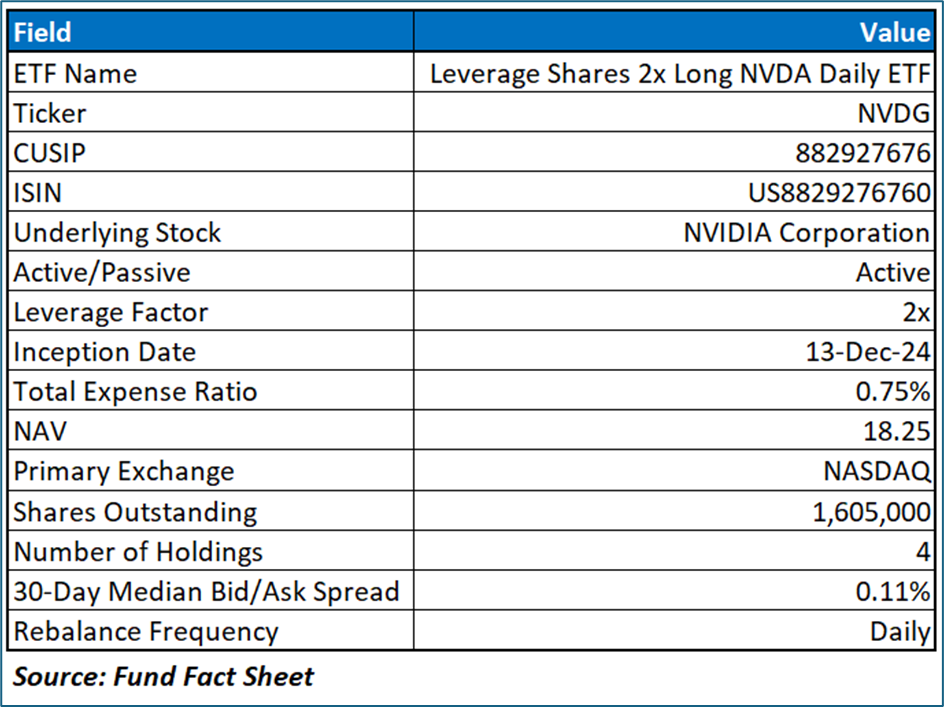
The Fund seeks daily leveraged investment results of two times (200%) the daily percentage change in the share price of NVIDIA Corporation (NASDAQ: NVDA). The Fund may enter into one or more swap agreements with financial institutions for a specified period, which may range from one day to longer than a year.
Its performance over extended periods diverges from the expected 200% due to the compounding effect of daily returns, which is influenced by factors like holding duration and stock volatility. High volatility amplifies the impact of compounding, potentially leading to significant deviations from the underlying stock’s performance. Consequently, this ETF is designed for short-term trading rather than buy-and-hold strategies.
Underlying Stock: NVIDIA Corporation (NASDAQ: NVDA)
NVIDIA Corporation is a full-stack computing infrastructure company. The Company is engaged in accelerated computing to help solve the challenging computational problems. The Company’s segments include Compute & Networking and Graphics.
Section 2: Technical Analysis on ETF and Underlying Asset
NASDAQ: NVDG
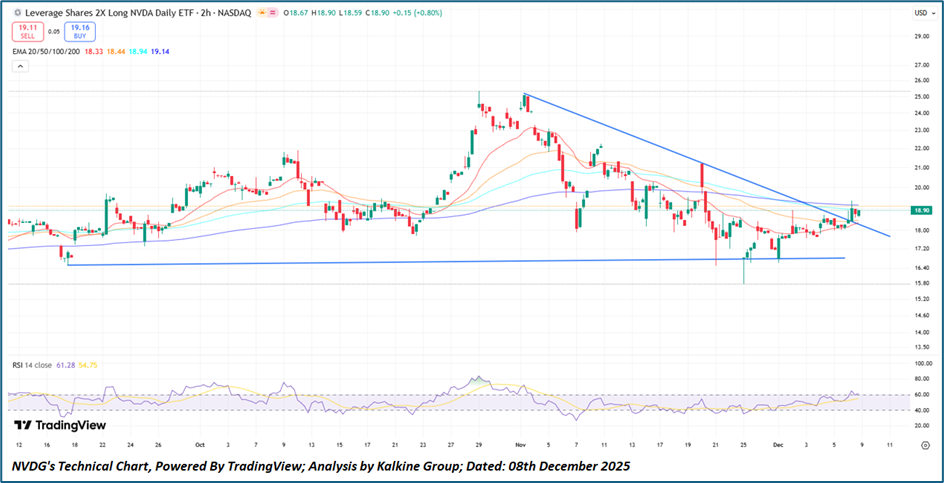
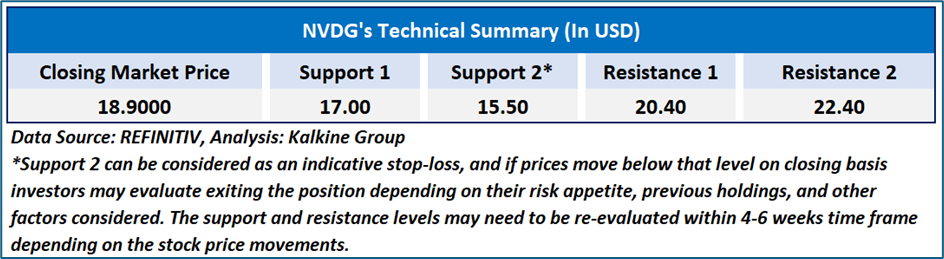
NVDG is demonstrating early signs of technical strengthening, with the price modestly breaking above a persistent descending trendline and stabilising well above its established support base near USD 16.8. Short-term momentum has improved as the ETF trades above its 20-, 50-, and 100-period EMAs, whose convergence and flattening suggest a potential shift toward a more constructive trend, even as the 200-period EMA remains a medium-term resistance level. The RSI, positioned near 61, reflects building—but not overstretched—bullish momentum, while incremental upticks in volume during the breakout attempt indicate improving market participation. Collectively, these factors present a cautiously optimistic technical backdrop, contingent on sustained price strength and continued confirmation above the USD 19–19.20 zone.
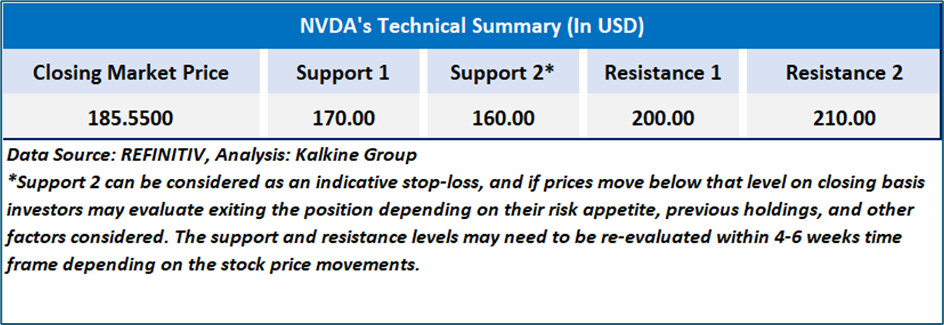
Underlying Asset Analysis: NASDAQ: NVDA
NVDA is exhibiting an improving technical profile as the stock breaks above its multi-week descending trendline while holding firmly above a rising long-term support base, signalling strengthening underlying demand. The price has reclaimed the 20-, 50-, and 100-period EMAs, forming a supportive cluster around USD 182–184, and momentum has turned constructive with the RSI near 61, indicating growing—but not overstretched—buying interest. With volume gradually increasing during the breakout attempt and resistance in the USD 188–190 zone now within reach, the setup reflects a cautiously bullish bias, suggesting that sustained follow-through could open the path for further upside continuation.
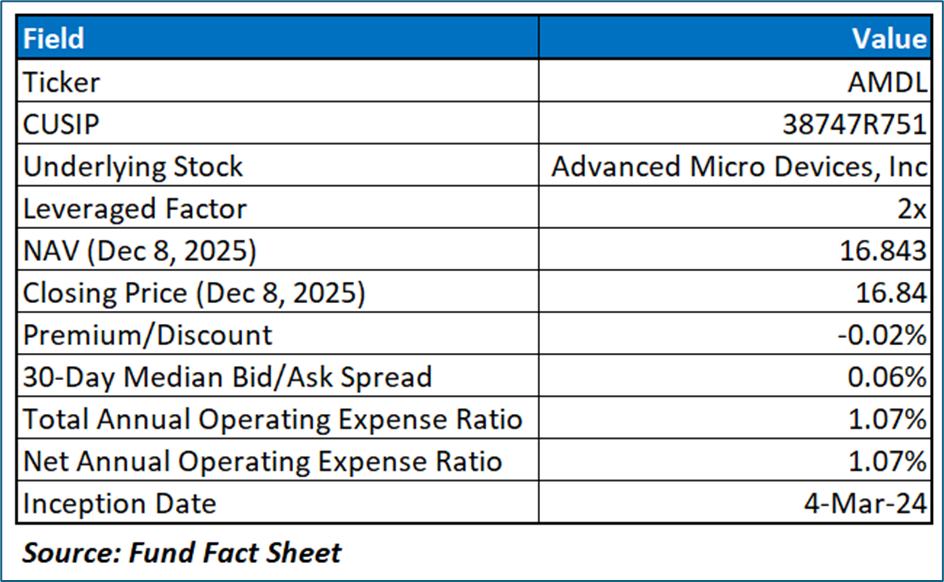
Section 1: GraniteShares 2x Long AMD Daily ETF
The Fund seeks daily investment results, before fees and expenses, of two times (200%) the daily percentage change in the share price of Advanced Micro Devices Inc (NASDAQ: AMD). The Fund is an actively managed ETF that attempts to achieve two times the daily percentage change in the share price of the Underlying Security.
Its performance over extended periods diverges from the expected 200% due to the compounding effect of daily returns, which is influenced by factors like holding duration and stock volatility. High volatility amplifies the impact of compounding, potentially leading to significant deviations from the underlying stock’s performance. Consequently, this ETF is designed for short-term trading rather than buy-and-hold strategies.
Underlying Stock: Advanced Micro Devices Inc (NASDAQ: AMD)
Advanced Micro Devices, Inc. is a global semiconductor company. The Company is focused on high-performance computing, graphics and visualization technologies. Its segments include Data Center, Client and Gaming, and Embedded. Data Center segment includes artificial intelligence (AI) accelerators, microprocessors (CPUs) for servers, graphics processing units (GPUs), accelerated processing units (APUs), data processing units (DPUs), Field Programmable Gate Arrays (FPGAs), smart network interface Cards (SmartNICs) and Adaptive system-on-Chip (SoC) products for data centers.
Section 2: Technical Analysis on ETF and Underlying Asset
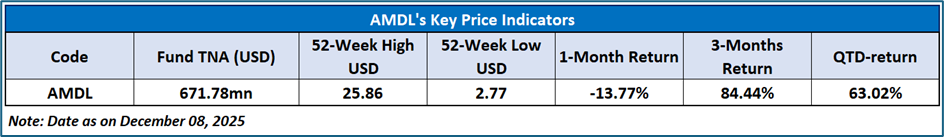
NASDAQ: ASMG
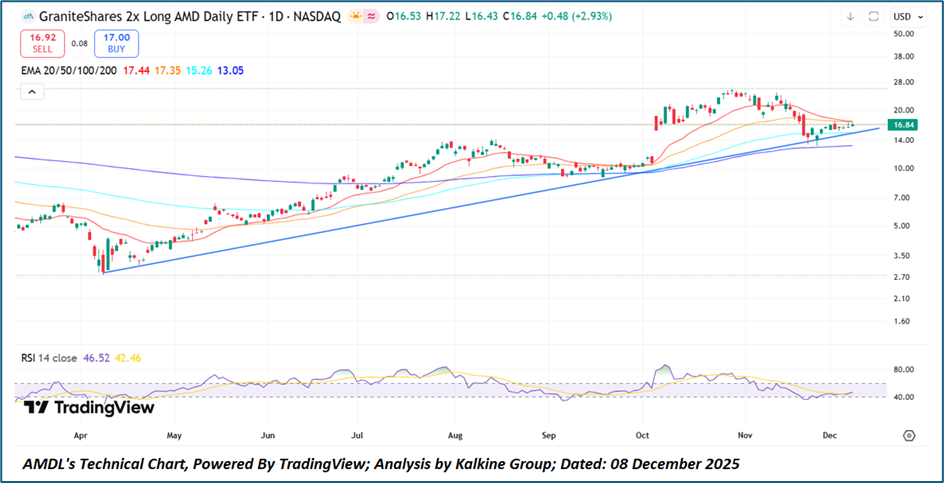
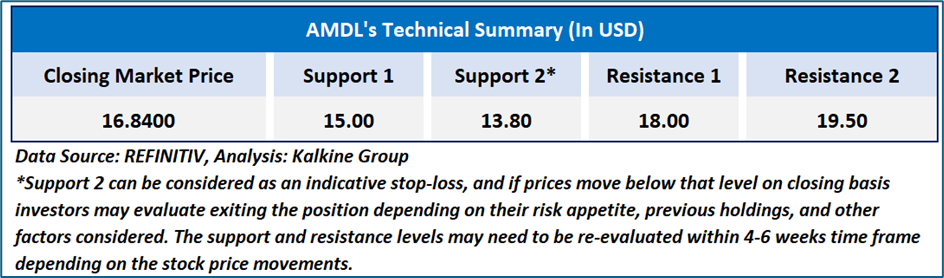
AMDL’s technical setup remains constructively positioned, with the ETF continuing to hold its long-standing ascending trendline and recently rebounding from the USD 14–15 support zone, indicating sustained underlying demand. Price action has begun stabilizing above the 20-day EMA and is approaching alignment with the 50-day EMA, reflecting early signs of potential trend re-strengthening, while the RSI’s recovery from lower levels suggests fading bearish momentum. Overall, the consolidation above key support areas, combined with improving short-term signals, sets a cautiously bullish backdrop, with a break above the USD 18–19 region likely to confirm a more decisive upward continuation.
Underlying Asset Analysis: NASDAQ: AMD
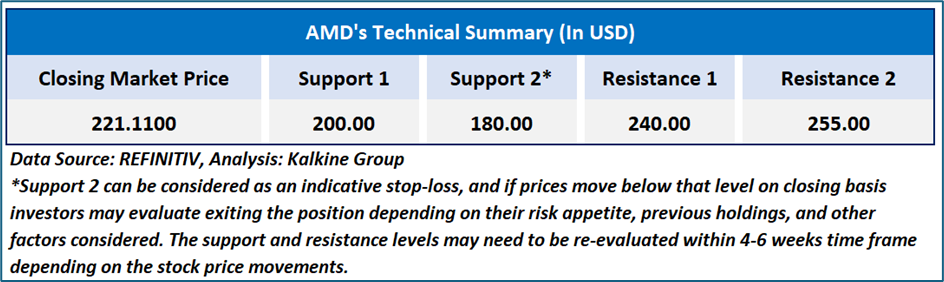
AMD’s technical structure shows signs of stabilisation after its recent pullback, with the price holding firmly above the 100-day and 200-day EMAs—an important indication that the broader uptrend remains intact. The stock has begun to consolidate above the USD 215–220 region, suggesting accumulation near a key support zone, while the gradual flattening of shorter-term EMAs hints at an early attempt to rebuild upward momentum. Although the RSI remains neutral around 48, it has lifted from oversold territory, indicating that bearish pressure is easing and creating room for a potential upside rotation. Collectively, these factors point to a cautiously constructive backdrop, where a sustained break above the declining short-term averages could open the way for a renewed advance toward previous highs.
Related Risk: Investing in the Fund carries inherent risks, including potential losses. The Fund's NAV and performance are influenced by various factors. Key risks include the effects of compounding, market volatility, and underlying stock risks, which can significantly impact returns and increase the likelihood of financial losses.
Note 1: Past performance is not a reliable indicator of future performance.
Note 2: The reference date for all price data, currency, technical indicators, support, and resistance level is December 08, 2025. The reference data in this report has been partly sourced from REFINITIV
Note 3: ‘Kalkine reports are prepared based on the stock prices captured either from the New York Stock Exchange (NYSE), NASDAQ Capital Markets (NASDAQ), and or REFINITIV. Typically, all sources (NYSE, NASDAQ, or REFINITIV) may reflect stock prices with a delay which could be a lag of 25-30 minutes. There can be no assurance that future results or events will be consistent with the information provided in the report. The information is subject to change without any prior notice.
Kalkine Equities LLC, with Delaware File Number 4697384, Foreign Qualification Registration in California File Number 202109211078, and Texas File Number 805521396, is authorized to provide general advice only. The information on https://kalkine.com/ does not take into account any of your investment objectives, financial situation or needs. You should consider the appropriateness of advice taking into account your own objectives, financial situation and needs and seek independent financial advice before making any financial decisions. The link to our Terms and Conditions and Privacy Policy has been provided for your reference. On the date of publishing the reports (mentioned on the website), employees and/or associates of Kalkine do not hold positions in any of the stocks covered on the website. These stocks can change any time and readers of the reports should not consider these stocks as advice or recommendations later.
Past performance is not a reliable indicator of future performance.
 Please wait processing your request...