
Overview
Dynamic Core ETF Report covers an innovative investment product, an actively managed ETF that seek capital appreciation by investing in U.S. equities and other instruments. It dynamically adjusts its exposure based on market volatility, aiming to reduce risk during turbulent periods and increase exposure when conditions are favourable, providing a flexible strategy to manage market fluctuations.
This week’s report covers GraniteShares 2x Long COIN Daily ETF (CONL) & Defiance Daily Target 2X Long NVO ETF (NVOX) which are ‘Directional Leveraged ETFs’ that use financial derivatives and debt to amplify the returns of an underlying index, typically by 2x or 3x. These leveraged ETFs aim to provide magnified exposure to the price movements of a specific asset class, either in the direction of rising (bullish) or falling (bearish) prices.
Section 1: GraniteShares 2x Long COIN Daily ETF
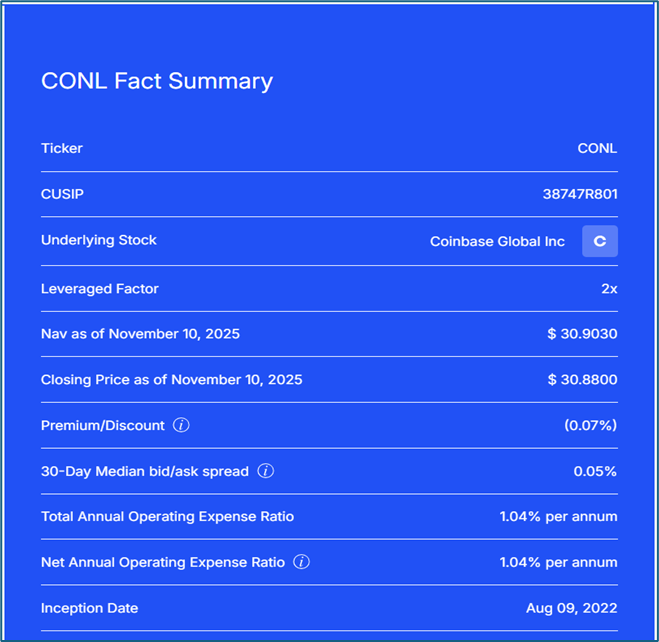
The Fund seeks daily leveraged investment results of two times (200%) the daily percentage change in the share price of Coinbase Global, Inc (COIN). The Fund may enter into one or more swap agreements with financial institutions for a specified period, which may range from one day to longer than a year.
Its performance over extended periods diverges from the expected 200% due to the compounding effect of daily returns, which is influenced by factors like holding duration and stock volatility. High volatility amplifies the impact of compounding, potentially leading to significant deviations from the underlying stock’s performance. Consequently, this ETF is designed for short-term trading rather than buy-and-hold strategies.
Underlying Stock: Coinbase Global Inc (NASDAQ: COIN)
Coinbase Global, Inc. is a holding company of Coinbase, Inc. and other subsidiaries. The Company provides a platform for its customers to engage with crypto assets and offers critical infrastructure for the on chain economy. It offers products and services to three customer groups: Consumers, Institutions, and Developers. Consumers include retail customers seeking to invest in or trade crypto assets and engage on chain.
Section 2: Technical Analysis on ETF and Underlying Asset
NASDAQ: CONL
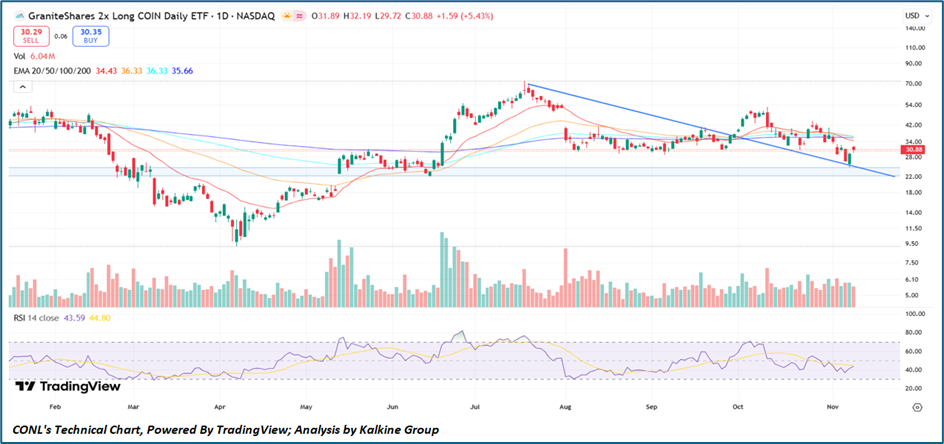
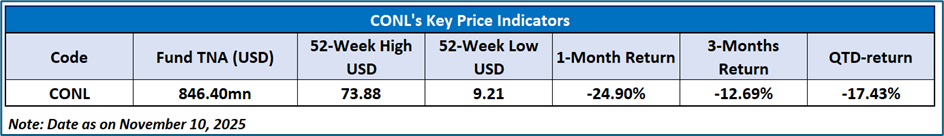
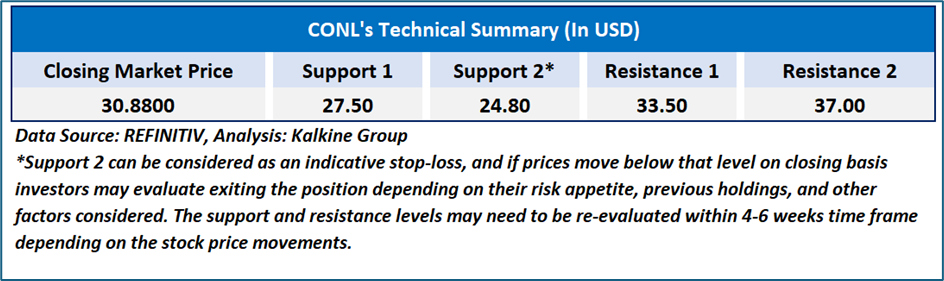
GraniteShares 2x Long COIN Daily ETF (NASDAQ: CONL) is currently trading at USD 30.88, up 5.43%, showing a mild rebound but remaining below its key 20-day (USD 34.43) and 50-day (USD 36.33) EMAs, reflecting a continued short-term downtrend. The price recently tested support near USD 28, forming a potential base within a descending channel, while resistance lies near USD 34–36, aligning with the EMAs and trendline. The RSI at 43.6 indicates a neutral-to-weak momentum zone, suggesting room for recovery if buying interest strengthens. Volume activity remains steady, hinting at accumulation near lower levels. Overall, CONL appears to be in a technical consolidation phase, and a decisive breakout above the USD 36 level could confirm a short-term reversal, while holding above USD 28 remains crucial to maintain support stability.
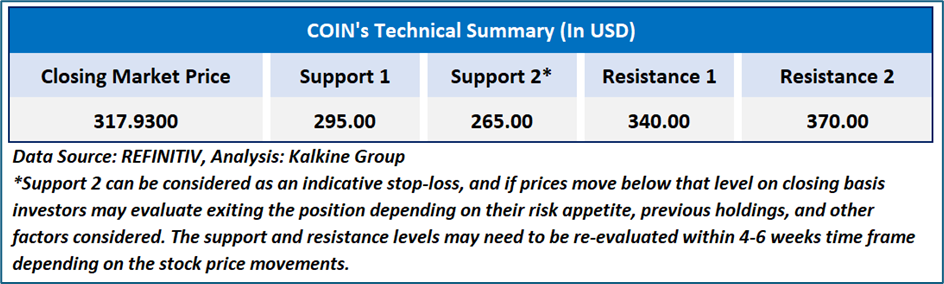
Underlying Asset Analysis: NASDAQ: COIN
SoFi Technologies Inc. (NASDAQ: SOFI) is trading around USD 30.00, maintaining a firm uptrend supported by a series of higher lows and consistent buying activity. The stock is holding above all major exponential moving averages (20-, 50-, 100-, and 200-period), which are aligned positively, signaling strong bullish momentum. The RSI at 62.03 indicates healthy strength with room for further upside before reaching overbought territory. Price action shows a symmetrical triangle breakout pattern, suggesting consolidation before a potential upward move, with resistance near USD 31.50–32.00 and key support around USD 28.00–28.50. Sustained trading above USD 30.50 may confirm a breakout, paving the way for a rally toward the USD 33.00–34.00 zone in the near term, supported by rising volume and improving sentiment.
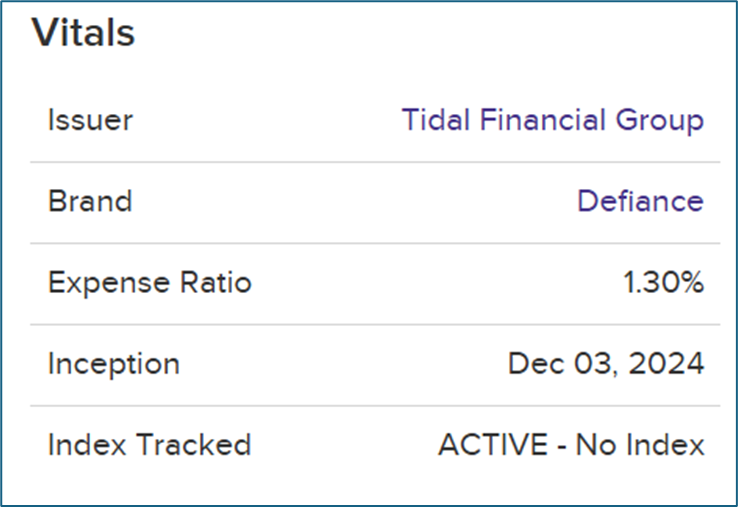
Section 1: Defiance Daily Target 2X Long NVO ETF (NVOX)
The Fund seeks daily investment results, before fees and expenses, of two times (200%) the daily percentage change in the share price of Novo Nordisk A/S. The Fund is an actively managed ETF that attempts to achieve two times the daily percentage change in the share price of the Underlying Security.
Its performance over extended periods diverges from the expected 200% due to the compounding effect of daily returns, which is influenced by factors like holding duration and stock volatility. High volatility amplifies the impact of compounding, potentially leading to significant deviations from the underlying stock’s performance. Consequently, this ETF is designed for short-term trading rather than buy-and-hold strategies.
Underlying Stock: Novo Nordisk A/S (NYSE: NVO)
Novo Nordisk A/S is a global healthcare company engaged in diabetes care. The Company is also engaged in the discovery, development, manufacturing and marketing of pharmaceutical products. The Company operates through two business segments: diabetes and obesity care, and biopharmaceuticals.
Section 2: Technical Analysis on ETF and Underlying Asset
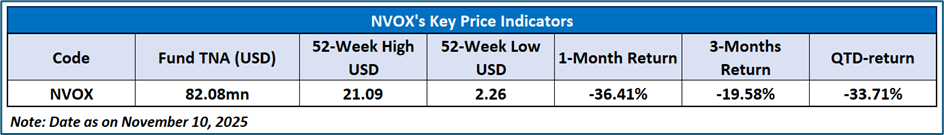
NYSE: NVOX
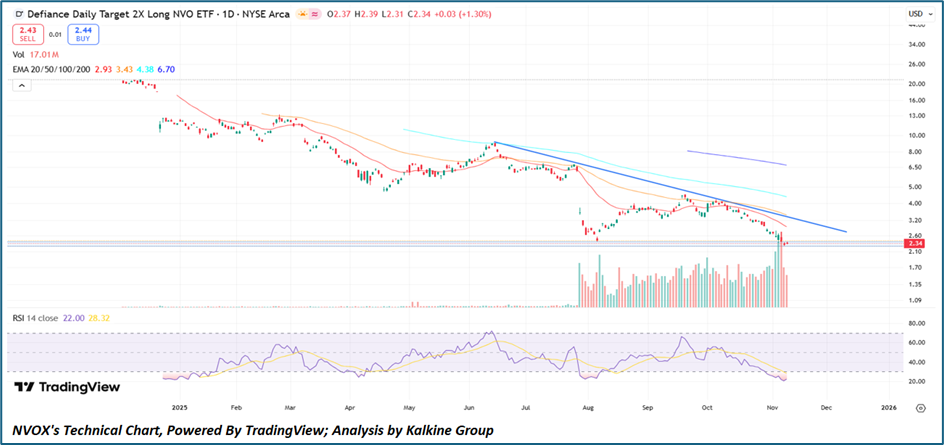
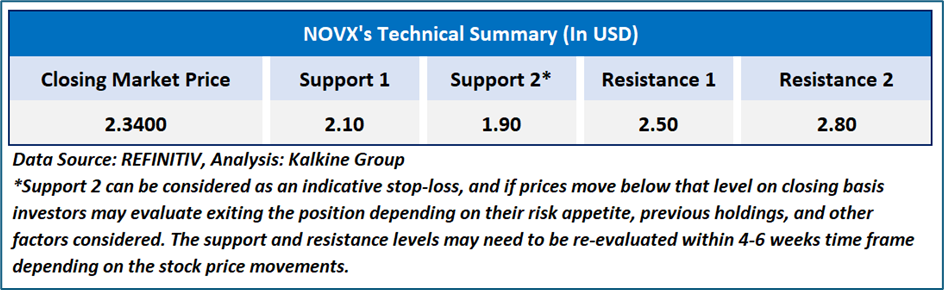
Defiance Daily Target 2X Long NVO ETF (NYSE Arca: NVOX) is trading at USD 2.34, up 1.30%, showing mild buying interest after an extended downtrend but remaining below key EMAs—20-day (USD 2.93), 50-day (USD 3.43), and 100-day (USD 4.38)—indicating persistent bearish momentum. The ETF continues to trade within a descending channel, facing resistance near USD 2.60–2.90 and support around USD 2.10–2.00, where it has recently found stability. The RSI at 22 signals deep oversold territory, hinting at a potential short-term technical rebound if volume and momentum improve. However, overall trend structure remains weak, and a sustained move above USD 3.00 would be essential to confirm trend reversal and re-establish bullish sentiment.
Underlying Asset Analysis: NYSE: NVO
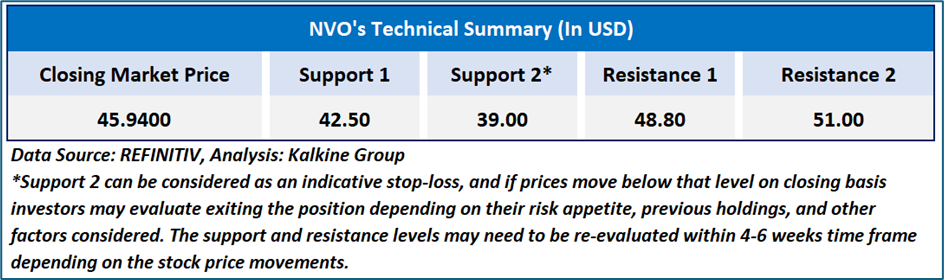
Novo Nordisk A/S (NYSE: NVO) is trading at USD 45.94, up 0.57%, but remains entrenched in a persistent downtrend, trading below all major EMAs—20-day (USD 50.87), 50-day (USD 54.14), 100-day (USD 58.16), and 200-day (USD 67.27)—indicating strong bearish sentiment. The stock is testing a crucial support zone near USD 45–43.5, while resistance lies around USD 50–52, which aligns with short-term moving averages. The RSI at 21.4 signals deep oversold conditions, suggesting potential for a near-term technical rebound if buyers emerge. However, sustained weakness in momentum and high selling volume indicate continued caution, with recovery confirmation requiring a decisive break above USD 52 to shift the bias toward neutral or bullish territory.
|
Related Risk: Investing in the Fund carries inherent risks, including potential losses. The Fund's NAV and performance are influenced by various factors. Key risks include the effects of compounding, market volatility, and underlying stock risks, which can significantly impact returns and increase the likelihood of financial losses. |
|
Note 1: Past performance is not a reliable indicator of future performance. |
|
Note 2: The reference date for all price data, currency, technical indicators, support, and resistance level is November 10, 2025. The reference data in this report has been partly sourced from REFINITIV |
|
Note 3: ‘Kalkine reports are prepared based on the stock prices captured either from the New York Stock Exchange (NYSE), NASDAQ Capital Markets (NASDAQ), and or REFINITIV. Typically, all sources (NYSE, NASDAQ, or REFINITIV) may reflect stock prices with a delay which could be a lag of 25-30 minutes. There can be no assurance that future results or events will be consistent with the information provided in the report. The information is subject to change without any prior notice. |
Kalkine Equities LLC, with Delaware File Number 4697384, Foreign Qualification Registration in California File Number 202109211078, and Texas File Number 805521396, is authorized to provide general advice only. The information on https://kalkine.com/ does not take into account any of your investment objectives, financial situation or needs. You should consider the appropriateness of advice taking into account your own objectives, financial situation and needs and seek independent financial advice before making any financial decisions. The link to our Terms and Conditions and Privacy Policy has been provided for your reference. On the date of publishing the reports (mentioned on the website), employees and/or associates of Kalkine do not hold positions in any of the stocks covered on the website. These stocks can change any time and readers of the reports should not consider these stocks as advice or recommendations later.
Past performance is not a reliable indicator of future performance.
 Please wait processing your request...