
 CA
 NZ
 UK
 AU
 IND

 US

Overview
This week’s report covers Leverage Shares 2X Long CRWV Daily ETF (NASDAQ CRWG), Leverage Shares 2X Long RTX Daily ETF (NASDAQ: RTXG) which are ‘Directional Leveraged ETFs’ that use financial derivatives and debt to amplify the returns of an underlying index, typically by 2x or 3x. These leveraged ETFs aim to provide magnified exposure to the price movements of a specific asset class, either in the direction of rising (bullish) or falling (bearish) prices.
Section 1: Leverage Shares 2X Long CRWV Daily ETF
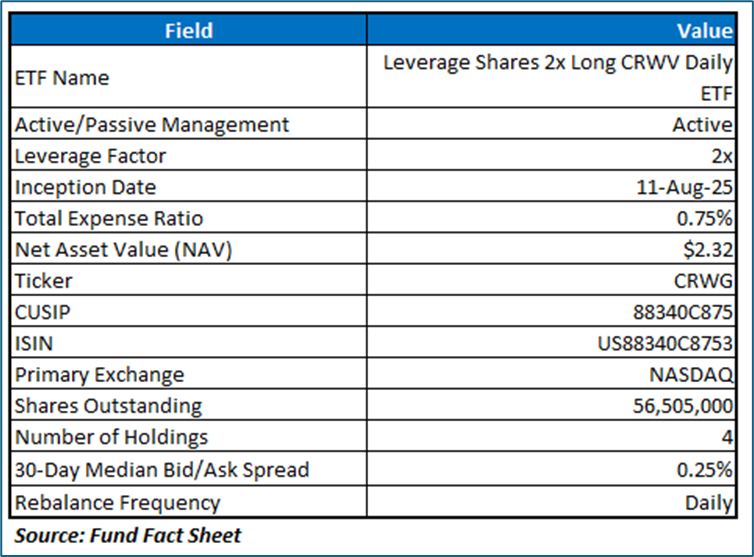
The Fund seeks daily leveraged investment results of two times (200%) the daily percentage change in the share price of CoreWeave Inc (NASDAQ: CRWV). The Fund may enter into one or more swap agreements with financial institutions for a specified period, which may range from one day to longer than a year.
Its performance over extended periods diverges from the expected 200% due to the compounding effect of daily returns, which is influenced by factors like holding duration and stock volatility. High volatility amplifies the impact of compounding, potentially leading to significant deviations from the underlying stock’s performance. Consequently, this ETF is designed for short-term trading rather than buy-and-hold strategies.
Underlying Stock: CoreWeave Inc (NASDAQ: CRWV)
CoreWeave, Inc. is a cloud infrastructure technology company. The Company offers the CoreWeave Cloud Platform, which consists of software and cloud services that deliver the automation and efficiency needed to manage complex artificial intelligence (AI) infrastructure. Its CoreWeave Cloud Platform is an integrated solution that is purpose-built for running AI workloads such as model training and inference. Its solutions include infrastructure services, managed software services, and application software services.

Section 2: Technical Analysis on ETF and Underlying Asset
NASDAQ: CRWG
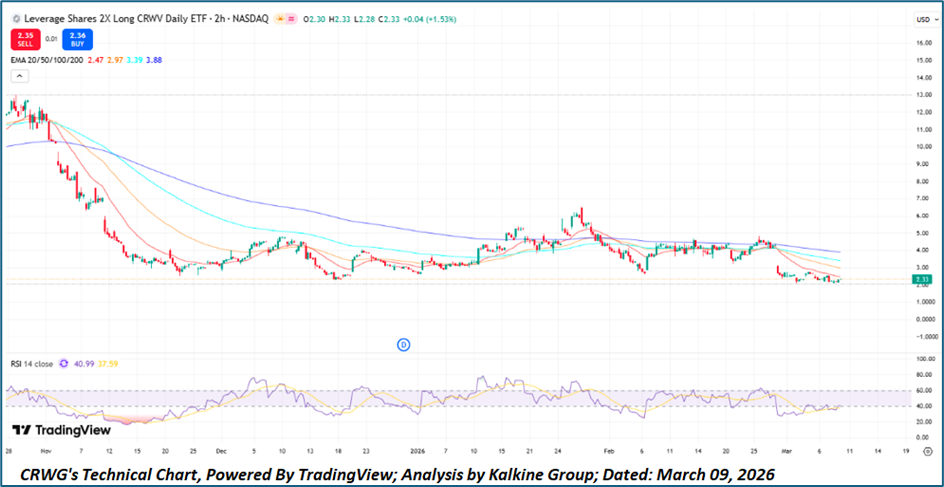
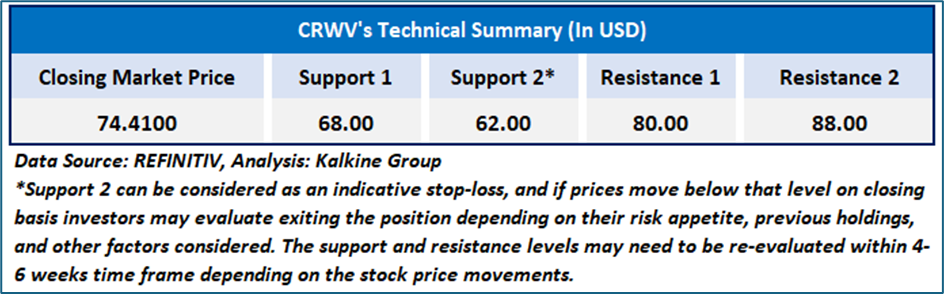
CRWG is showing early signs of a potential stabilization after a prolonged downtrend, with price consolidating near the USD2.20–USD2.30 support zone on the 2-hour chart. The recent candles indicate reduced selling pressure as the ETF attempts to hold above this base, while the short-term EMAs (20/50) are beginning to flatten, suggesting that downside momentum is weakening. Meanwhile, the RSI is hovering near the neutral zone around 40 and gradually turning upward, which may signal improving buying interest if momentum continues to build. A sustained move above the immediate resistance around USD2.50–USD2.60 could strengthen the near-term bullish outlook and potentially trigger a rebound toward the higher moving averages. Overall, the setup points to a cautiously bullish bias in the short term, provided support holds and momentum indicators continue to improve.
Underlying Asset Analysis: NASDAQ: CRWV
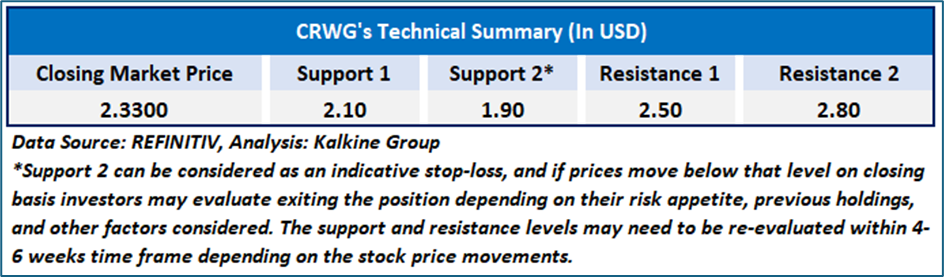
CRWV appears to be stabilizing after a recent pullback, with price finding support in the USD 70–USD 72 zone on the 2-hour chart. The decline has slowed, and recent candles suggest early accumulation as selling pressure begins to ease. Although the price is currently trading below the short-term moving averages (20 and 50 EMA), these averages are beginning to flatten, indicating that bearish momentum may be weakening. Meanwhile, the RSI is hovering around the mid-40 range and showing signs of turning upward, which suggests improving momentum and potential for a short-term recovery. If CRWV manages to reclaim the USD 78–USD 80 resistance region, it could confirm a near-term bullish shift and open the path for a move toward the higher moving averages around the mid-USD 80s. Overall, the technical setup suggests a cautiously bullish outlook in the short term, provided the current support level continues to hold.
Section 1: Leverage Shares 2X Long RTX Daily ETF (NASDAQ: RTXG)
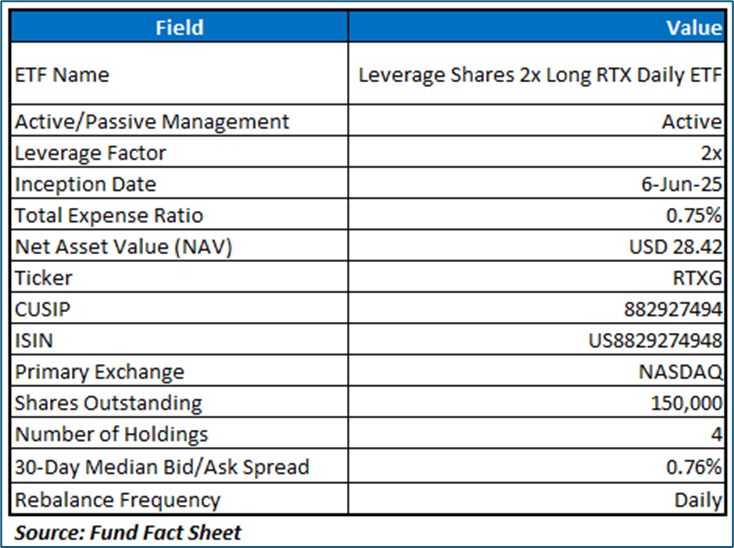
The Fund seeks daily investment results, before fees and expenses, of two times (200%) the daily percentage change in the share price of RTX Corporation (NYSE: RTX). The Fund is an actively managed ETF that attempts to achieve two times the daily percentage change in the share price of the Underlying Security.
Its performance over extended periods diverges from the expected 200% due to the compounding effect of daily returns, which is influenced by factors like holding duration and stock volatility. High volatility amplifies the impact of compounding, potentially leading to significant deviations from the underlying stock’s performance. Consequently, this ETF is designed for short-term trading rather than buy-and-hold strategies.
Underlying Stock: RTX Corporation (NYSE: RTX)
RTX Corporation (NYSE: RTX) is an aerospace and defense company, which provides advanced systems and services for commercial, military, and government customers worldwide. The Company operates through three segments: Collins Aerospace, Pratt & Whitney, and Raytheon.

Section 2: Technical Analysis on ETF and Underlying Asset
NASDAQ: RTXG
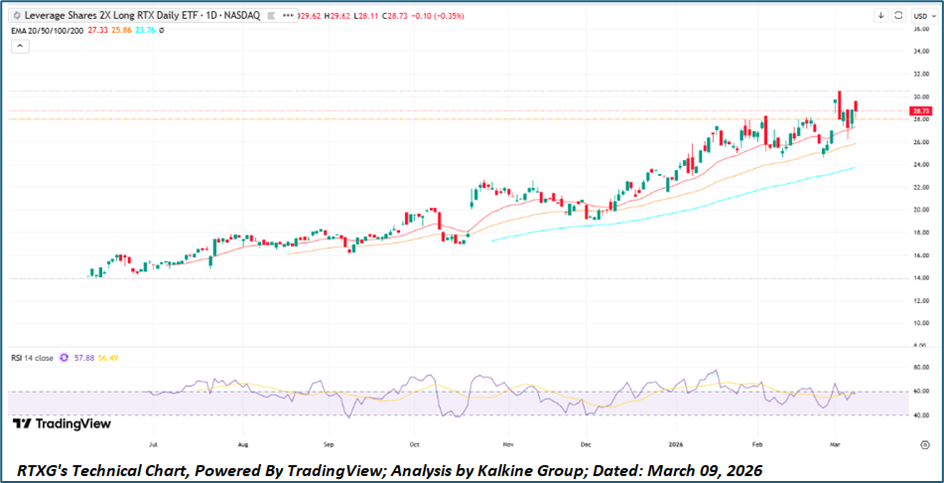
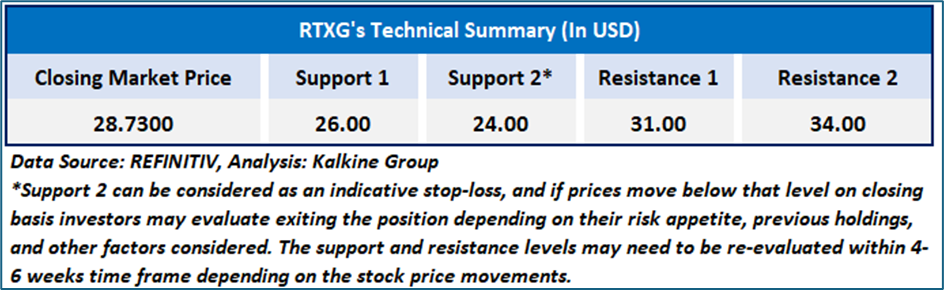
Leverage Shares 2X Long RTX Daily ETF is exhibiting a constructive bullish structure on the daily chart, with price continuing to trade above the key moving averages (EMA 20, 50, and 100), indicating sustained upward momentum. The recent pullback toward the short-term EMA zone appears to be a healthy consolidation within the prevailing uptrend rather than a structural breakdown. Higher highs and higher lows remain intact, suggesting buyers continue to defend dips. Additionally, RSI is holding near the mid-60 region, reflecting positive momentum without being excessively overbought, which leaves room for further upside. If price sustains above the USD 28 support region, the chart setup favors a potential continuation toward the USD 30–31 resistance zone in the near term.
Underlying Asset Analysis: NYSE: RTX
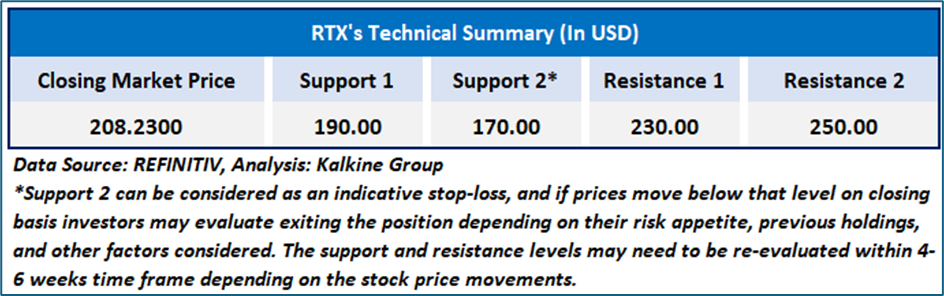
RTX Corporation is exhibiting a constructive bullish trend on the daily chart, with price maintaining a sequence of higher highs and higher lows while trading comfortably above the key moving averages (20, 50, 100, and 200 EMA), indicating sustained medium-term momentum. The recent consolidation near the USD 205–210 region appears to be a healthy pause following the strong upward move rather than a reversal. Momentum indicators remain supportive, with the RSI hovering in the neutral-to-positive zone near the mid-50s to low-60s range, suggesting room for additional upside without entering overbought territory. If the stock sustains above the immediate support zone around USD 198–200, the prevailing trend structure favors a continuation toward the USD 215–220 resistance band in the near term, keeping the broader technical bias moderately bullish.
Kalkine Equities LLC, with Delaware File Number 4697384, Foreign Qualification Registration in California File Number 202109211078, and Texas File Number 805521396, is authorized to provide general advice only. The information on https://kalkine.com/ does not take into account any of your investment objectives, financial situation or needs. You should consider the appropriateness of advice taking into account your own objectives, financial situation and needs and seek independent financial advice before making any financial decisions. The link to our Terms and Conditions and Privacy Policy has been provided for your reference. On the date of publishing the reports (mentioned on the website), employees and/or associates of Kalkine do not hold positions in any of the stocks covered on the website. These stocks can change any time and readers of the reports should not consider these stocks as advice or recommendations later.
Past performance is not a reliable indicator of future performance.
 Please wait processing your request...