
Overview
Dynamic Core ETF Report covers an innovative investment product, an actively managed ETF that seek capital appreciation by investing in U.S. equities and other instruments. It dynamically adjusts its exposure based on market volatility, aiming to reduce risk during turbulent periods and increase exposure when conditions are favourable, providing a flexible strategy to manage market fluctuations.
This week’s report covers Defiance Daily Target 2x Short RGTI ETF, Leverage Shares 2x Long NEM Daily ETF which are ‘Directional Leveraged ETFs’ that use financial derivatives and debt to amplify the returns of an underlying index, typically by 2x or 3x. These leveraged ETFs aim to provide magnified exposure to the price movements of a specific asset class, either in the direction of rising (bullish) or falling (bearish) prices.
Section 1: Defiance Daily Target 2x Short RGTI ETF
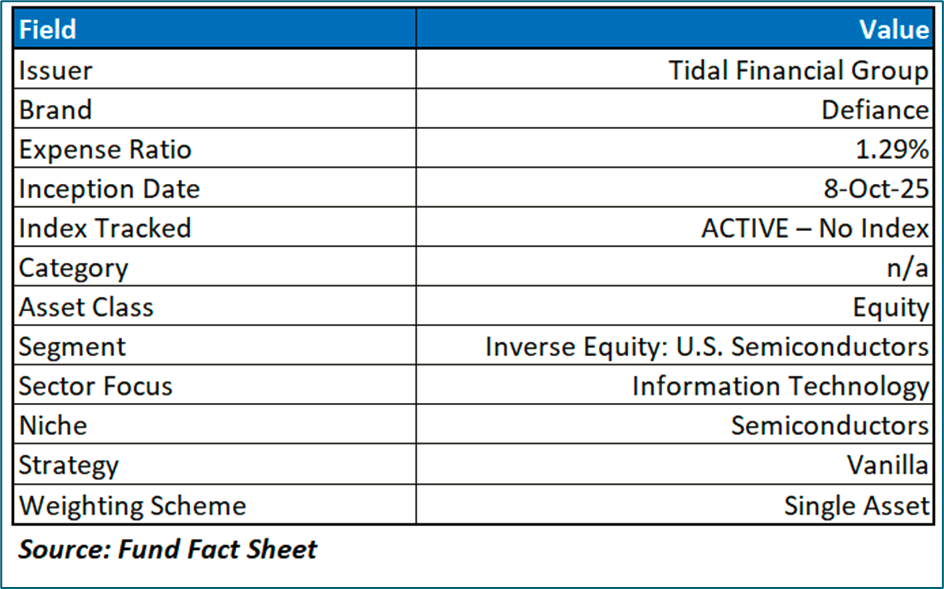
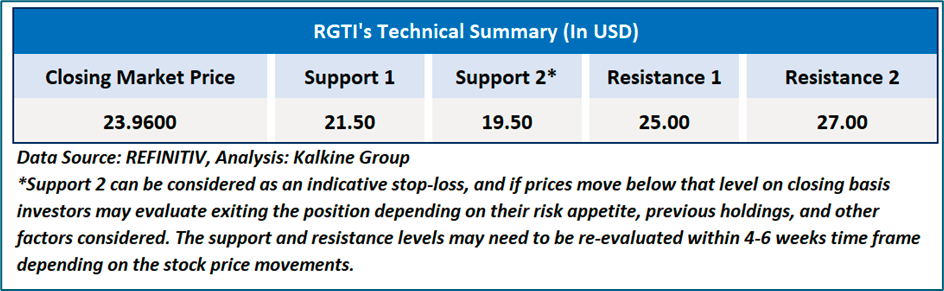
The Fund seeks daily leveraged investment results of two times (200%) the daily percentage change in the share price of Rigetti Computing, Inc. (NASDAQ: RGTI). The Fund may enter into one or more swap agreements with financial institutions for a specified period, which may range from one day to longer than a year.
Its performance over extended periods diverges from the expected 200% due to the compounding effect of daily returns, which is influenced by factors like holding duration and stock volatility. High volatility amplifies the impact of compounding, potentially leading to significant deviations from the underlying stock’s performance. Consequently, this ETF is designed for short-term trading rather than buy-and-hold strategies.
Underlying Stock: Rigetti Computing, Inc. (NASDAQ: RGTI)
Rigetti Computing, Inc. (NASDAQ: RGTI) is a full-stack quantum computing company. The Company operates quantum computers over the cloud and serves global enterprise, government, and research clients through its Rigetti Quantum Cloud Services platform. The Company’s quantum-classical infrastructure provides high-performance integration with public and private clouds for practical quantum computing. It has developed a multi-chip quantum processor for scalable quantum computing systems.
Section 2: Technical Analysis on ETF and Underlying Asset
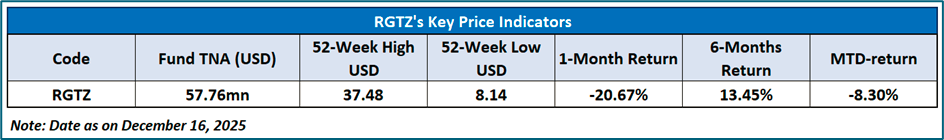
NASDAQ: RGTZ
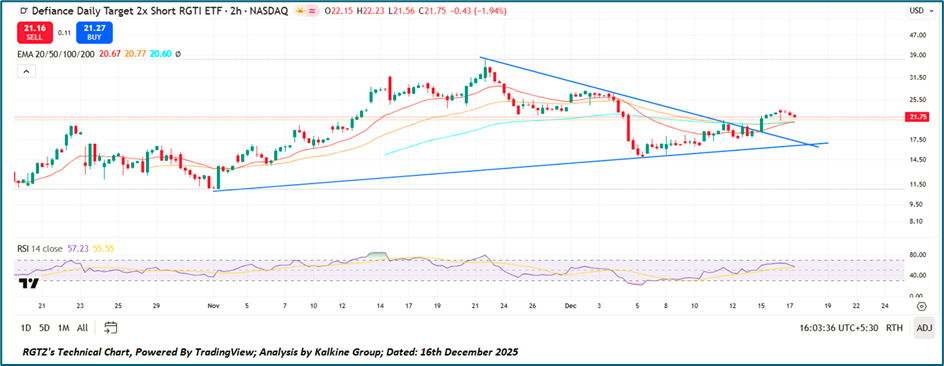
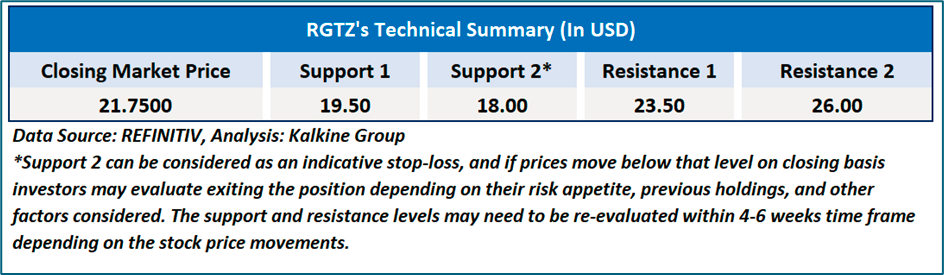
RGTZ is currently consolidating within a narrowing symmetrical triangle on the 2-hour chart, reflecting a balance between buyers and sellers following the prior uptrend. Price is oscillating around the short- and medium-term EMAs, indicating a loss of directional momentum, while the longer-term EMA continues to slope upward, suggesting the broader trend remains constructive. The RSI hovering in the mid-50s points to neutral momentum with no immediate overbought or oversold conditions, implying that a decisive breakout above the descending trendline could revive bullish momentum, whereas a breakdown below the rising support may trigger renewed downside pressure.
Underlying Asset Analysis: NASDAQ: RGTI
RGTI remains in a corrective phase on the 4-hour chart, with price trading below the declining 50- and 100-period EMAs, indicating sustained near-term bearish pressure following the prior sharp rally. The stock is compressing within a narrowing range beneath a downward-sloping trendline, suggesting consolidation rather than a confirmed trend reversal, while the 200-period EMA continues to provide medium-term structural support. Momentum indicators remain subdued, with the RSI hovering below the neutral 50 level, implying limited buying strength; a decisive breakout above the descending trendline and key moving averages would be required to signal trend stabilization, whereas failure to hold current support levels could expose the stock to further downside.
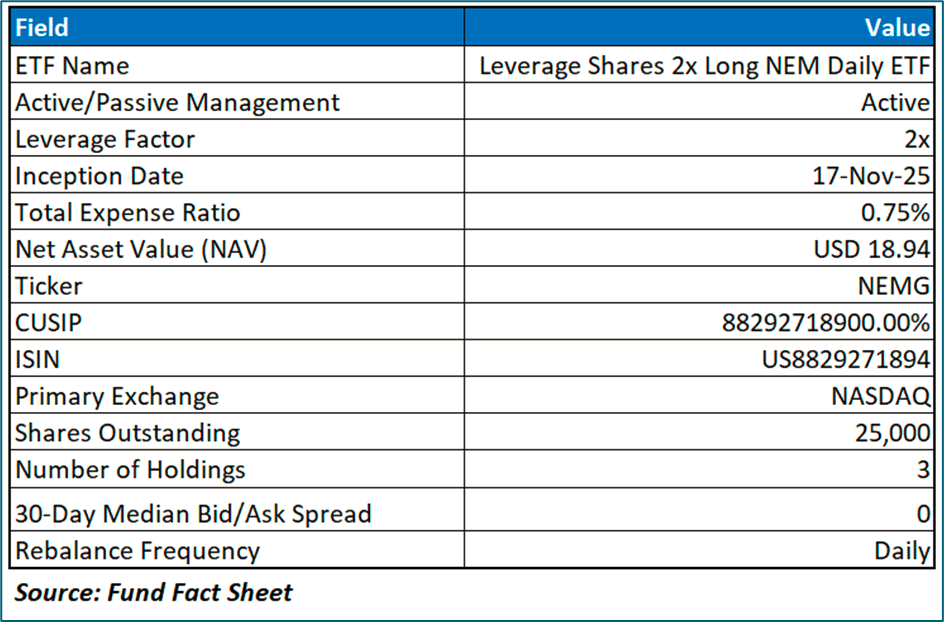
Section 1: Leverage Shares 2x Long NEM Daily ETF
The Fund seeks daily investment results, before fees and expenses, of two times (200%) the daily percentage change in the share price of Newmont Corporation (NYSE: NEM). The Fund is an actively managed ETF that attempts to achieve two times the daily percentage change in the share price of the Underlying Security.
Its performance over extended periods diverges from the expected 200% due to the compounding effect of daily returns, which is influenced by factors like holding duration and stock volatility. High volatility amplifies the impact of compounding, potentially leading to significant deviations from the underlying stock’s performance. Consequently, this ETF is designed for short-term trading rather than buy-and-hold strategies.
Underlying Stock: Newmont Corporation (NYSE: NEM)
Newmont Corporation (NYSE: NEM) is a gold company and a producer of copper, zinc, lead, and silver with operations and/or assets in the Africa, Australia, Latin America & Caribbean, North America, and Papua New Guinea regions.
Section 2: Technical Analysis on ETF and Underlying Asset
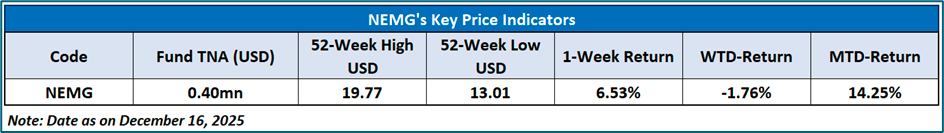
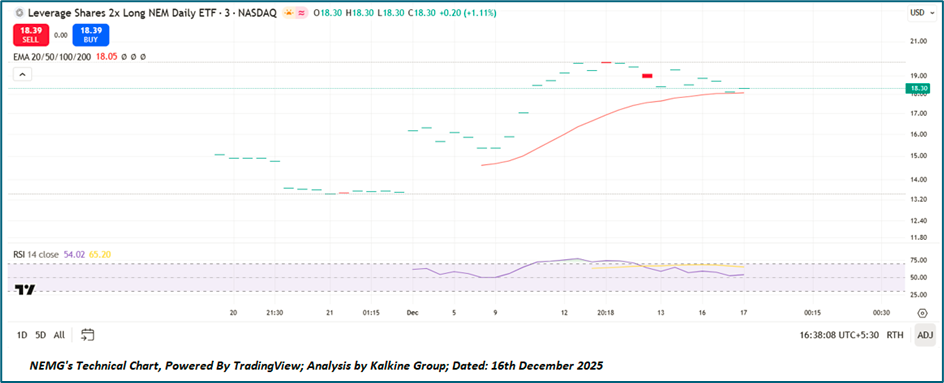
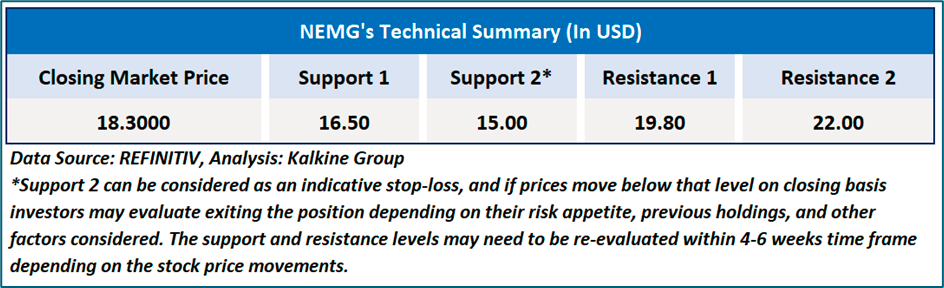
NASDAQ: NEMG
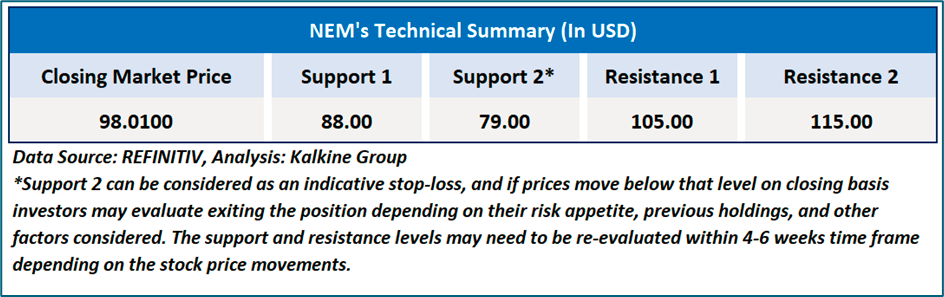
Underlying Asset Analysis: NYSE: NEM
NEM continues to trade in a constructive medium-term uptrend, with price holding above the rising 100- and 200-period EMAs, reinforcing underlying trend support despite recent consolidation. In the near term, momentum has moderated as the stock consolidates just below the recent swing highs near the USD 100–102 resistance zone, with the 20- and 50-period EMAs flattening, indicating a pause rather than a reversal. The RSI remains above the neutral 50 level, suggesting residual bullish momentum; however, a sustained breakout above the overhead resistance is required to reassert upside continuation, while a pullback toward the USD 94–96 region would likely attract support within the prevailing bullish structure.
Related Risk: Investing in the Fund carries inherent risks, including potential losses. The Fund's NAV and performance are influenced by various factors. Key risks include the effects of compounding, market volatility, and underlying stock risks, which can significantly impact returns and increase the likelihood of financial losses.
Note 1: Past performance is not a reliable indicator of future performance.
Note 2: The reference date for all price data, currency, technical indicators, support, and resistance level is December 16, 2025. The reference data in this report has been partly sourced from REFINITIV
Note 3: ‘Kalkine reports are prepared based on the stock prices captured either from the New York Stock Exchange (NYSE), NASDAQ Capital Markets (NASDAQ), and or REFINITIV. Typically, all sources (NYSE, NASDAQ, or REFINITIV) may reflect stock prices with a delay which could be a lag of 25-30 minutes. There can be no assurance that future results or events will be consistent with the information provided in the report. The information is subject to change without any prior notice.
Kalkine Equities LLC, with Delaware File Number 4697384, Foreign Qualification Registration in California File Number 202109211078, and Texas File Number 805521396, is authorized to provide general advice only. The information on https://kalkine.com/ does not take into account any of your investment objectives, financial situation or needs. You should consider the appropriateness of advice taking into account your own objectives, financial situation and needs and seek independent financial advice before making any financial decisions. The link to our Terms and Conditions and Privacy Policy has been provided for your reference. On the date of publishing the reports (mentioned on the website), employees and/or associates of Kalkine do not hold positions in any of the stocks covered on the website. These stocks can change any time and readers of the reports should not consider these stocks as advice or recommendations later.
Past performance is not a reliable indicator of future performance.
 Please wait processing your request...