
Overview
Dynamic Core ETF Report covers an innovative investment product, an actively managed ETF that seek capital appreciation by investing in U.S. equities and other instruments. It dynamically adjusts its exposure based on market volatility, aiming to reduce risk during turbulent periods and increase exposure when conditions are favourable, providing a flexible strategy to manage market fluctuations.
This week’s report covers Tradr 2X Long IREN Daily ETF (IREX) & Leverage Shares 2X Long ASML Daily ETF (ASMG) which are ‘Directional Leveraged ETFs’ that use financial derivatives and debt to amplify the returns of an underlying index, typically by 2x or 3x. These leveraged ETFs aim to provide magnified exposure to the price movements of a specific asset class, either in the direction of rising (bullish) or falling (bearish) prices.
Section 1: Tradr 2X Long IREN Daily ETF
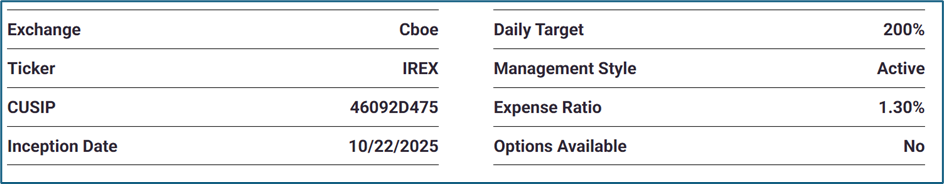
The Fund seeks daily leveraged investment results of two times (200%) the daily percentage change in the share price of IREN Limited (NASDAQ: IREN). The Fund may enter into one or more swap agreements with financial institutions for a specified period, which may range from one day to longer than a year.
Its performance over extended periods diverges from the expected 200% due to the compounding effect of daily returns, which is influenced by factors like holding duration and stock volatility. High volatility amplifies the impact of compounding, potentially leading to significant deviations from the underlying stock’s performance. Consequently, this ETF is designed for short-term trading rather than buy-and-hold strategies.
Underlying Stock: IREN Limited (NASDAQ: IREN)
IREN Limited is an Australia-based company, which owns and operates data centers powered by 100% renewable energy. Its facilities are optimized for Bitcoin mining, artificial intelligence (AI) cloud services, and other power-dense compute. Its data center mining facilities are in Canal Flats, Mackenzie, Prince George and Childress. Bitcoin Mining provides security to the Bitcoin network.
Section 2: Technical Analysis on ETF and Underlying Asset
CBOE: IREX
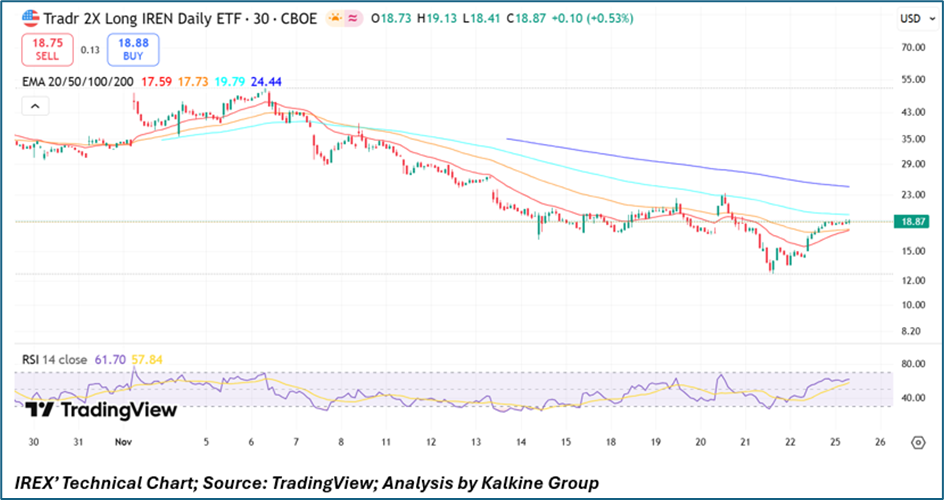
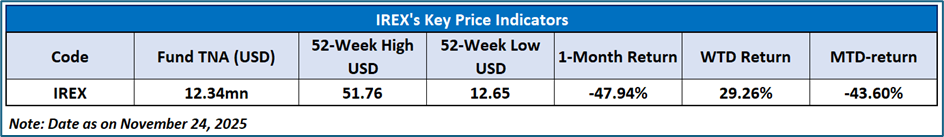
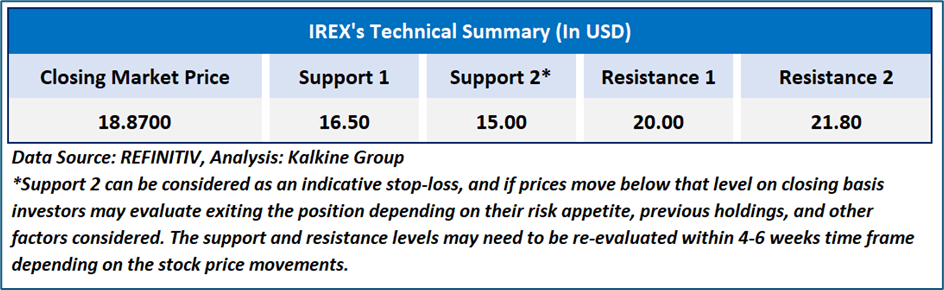
IREX has begun to exhibit early signs of technical stabilization, with the price rebounding from the USD 15–16 support zone and advancing above the short-term 20- and 50-period EMAs, indicating an improvement in near-term momentum despite remaining below longer-duration trend lines. The RSI, currently in the upper-50s, reflects strengthening but not overextended buying interest, suggesting additional room for upward movement if demand persists. With immediate resistance positioned around USD 19.50–20.00 and broader upside potential extending toward the USD 22–23 region upon a decisive breakout, while support remains firmly established at USD 16, the overall technical posture for IREX is cautiously constructive and modestly biased toward a continued short-term recovery.
Underlying Asset Analysis: NASDAQ: IREN
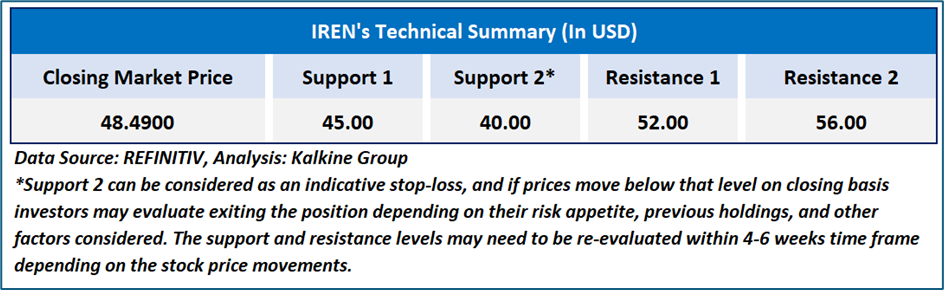
For IREN Limited, the technical setup reflects a moderately constructive but still cautious near-term outlook. The price has recently stabilized above the 100-day EMA (≈ USD 50.57) and is attempting to reclaim the 50-day and 20-day EMAs (≈ USD 53.45 and 49.37) after a multi-week corrective decline, indicating early signs of base formation. While the shorter EMAs remain downward-sloping, the long-term 200-day EMA (≈ USD 41.20) continues to rise steadily, signalling that the broader structural uptrend remains intact. Momentum conditions are neutral, with the RSI recovering toward 45, reflecting diminishing selling pressure and the potential for a gradual shift toward positive momentum should the price sustain closes above the short-term moving averages. Immediate resistance lies in the USD 52–55 zone, and a decisive breakout above this band would strengthen bullish prospects, whereas failure to hold support near USD 46–47 may reopen downside risk toward the 200-day EMA region.
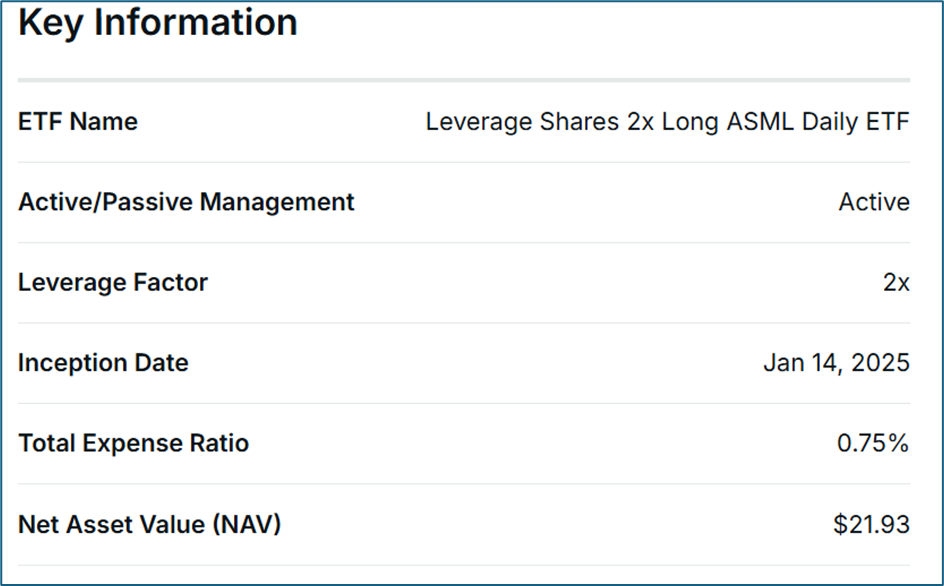
Section 1: Leverage Shares 2X Long ASML Daily ETF (ASMG)
The Fund seeks daily investment results, before fees and expenses, of two times (200%) the daily percentage change in the share price of ASML Holding NV. The Fund is an actively managed ETF that attempts to achieve two times the daily percentage change in the share price of the Underlying Security.
Its performance over extended periods diverges from the expected 200% due to the compounding effect of daily returns, which is influenced by factors like holding duration and stock volatility. High volatility amplifies the impact of compounding, potentially leading to significant deviations from the underlying stock’s performance. Consequently, this ETF is designed for short-term trading rather than buy-and-hold strategies.
Underlying Stock: ASML Holding NV (NASDAQ: ASML)
ASML Holding N.V. is a holding company based in the Netherlands. The Company operates through its subsidiaries in the Netherlands, the United States, Italy, France, Germany, the United Kingdom, Ireland, Belgium, South Korea, Taiwan, Singapore, China, Hong Kong, Japan, Malaysia and Israel. The Company operates through one business segment which is engage in development, production, marketing, sales, upgrading and servicing of advanced semiconductor equipment systems, consisting of lithography, metrology and inspection systems.
Section 2: Technical Analysis on ETF and Underlying Asset
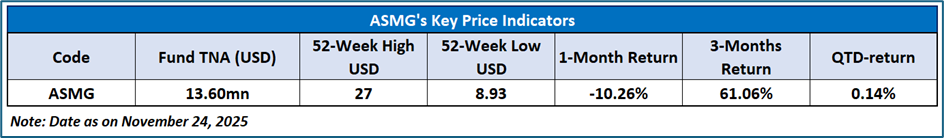
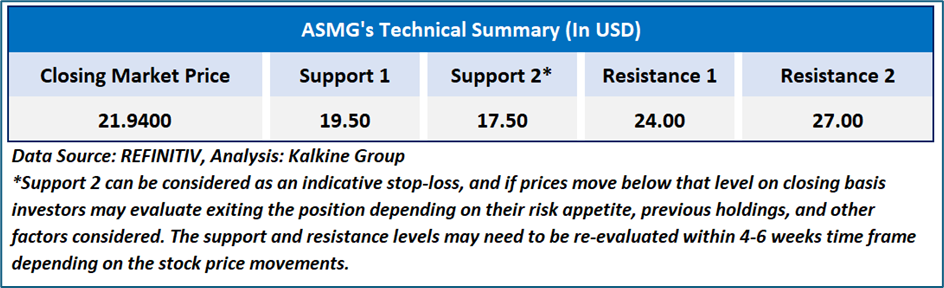
NASDAQ: ASMG
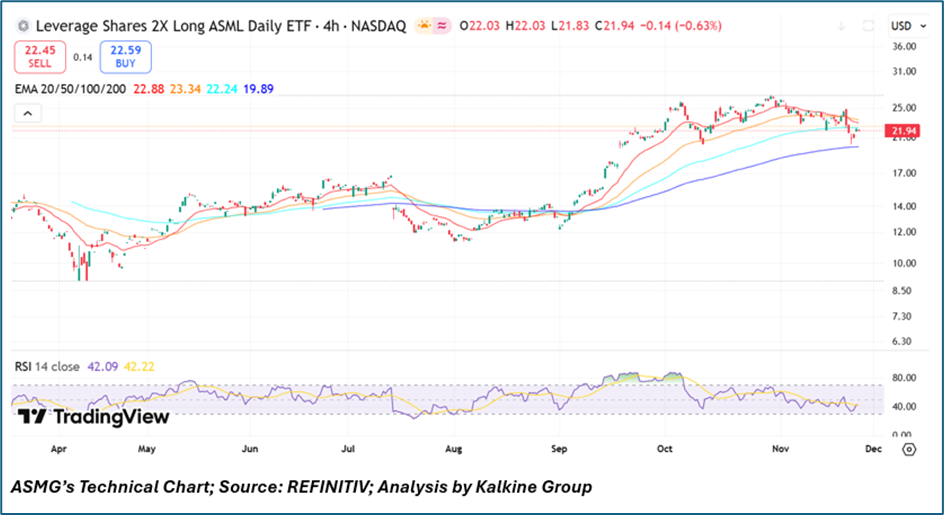
ASMG’s 4-hour technical structure reflects a cautiously improving setup, with price stabilizing near USD 21.94 after a multi-session pullback and showing early signs of constructive demand as it holds above the 200-period EMA (USD 19.89), a key longer-term support indicator. The shorter EMAs (20/50/100) at USD 22.88, USD 23.34, and USD 22.24 respectively remain compressed and downward-sloping, but the recent moderation in selling pressure and repeated defense of the mid-USD 21 zone suggests loss of bearish momentum and the potential for a near-term inflection if the price reclaims the 20-EMA on sustained volume. Meanwhile, the RSI hovering near 42 reflects subdued but stabilizing momentum, consistent with a market that is transitioning from oversold conditions and could shift toward a more constructive trajectory if RSI breaks above the neutral 50 threshold. Overall, while the broader trend remains mixed, the alignment of multi-frame support, easing downside pressure, and early momentum recovery introduces a mildly bullish bias contingent on a confirmed breakout above the clustered EMA resistance.
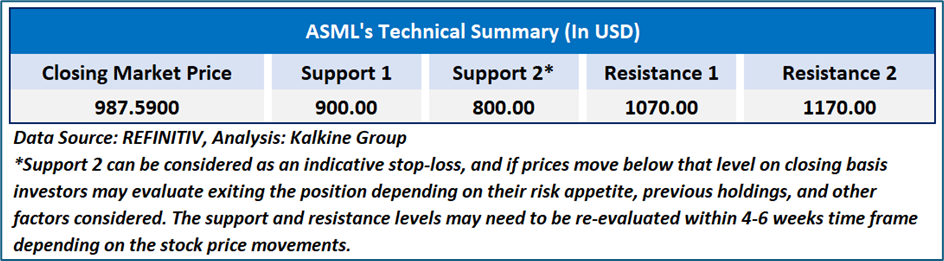
Underlying Asset Analysis: NASDAQ: ASML
ASML’s 4-hour chart exhibits a broadly constructive technical posture despite recent corrective pressure, with the price stabilizing near USD 985–990 and showing early signs of a potential base forming above the 200-period EMA (around USD 912), which continues to trend upward and indicates that the longer-term structure remains intact. The shorter-term EMAs (20/50/100) have flattened and begun to converge, suggesting the loss of bearish momentum and the possibility of a near-term inflection if buyers sustain pressure above the USD 1,000 psychological threshold. Momentum indicators support this stabilizing tone, as the RSI hovers in the low-40s—firmly off oversold levels—and shows nascent upward curvature, implying weakening downward force and room for a recovery swing should price reclaim the 20-period EMA (~USD 1,005). Collectively, the alignment of rising longer-term averages, improving momentum, and price resilience near multi-week support zones lends a cautiously bullish tilt, with the technical bias improving materially if ASML achieves a sustained close back above the USD 1,020–1,040 resistance corridor.
Related Risk: Investing in the Fund carries inherent risks, including potential losses. The Fund's NAV and performance are influenced by various factors. Key risks include the effects of compounding, market volatility, and underlying stock risks, which can significantly impact returns and increase the likelihood of financial losses.
Note 1: Past performance is not a reliable indicator of future performance.
Note 2: The reference date for all price data, currency, technical indicators, support, and resistance level is November 24, 2025. The reference data in this report has been partly sourced from REFINITIV
Note 3: ‘Kalkine reports are prepared based on the stock prices captured either from the New York Stock Exchange (NYSE), NASDAQ Capital Markets (NASDAQ), and or REFINITIV. Typically, all sources (NYSE, NASDAQ, or REFINITIV) may reflect stock prices with a delay which could be a lag of 25-30 minutes. There can be no assurance that future results or events will be consistent with the information provided in the report. The information is subject to change without any prior notice.
Kalkine Equities LLC, with Delaware File Number 4697384, Foreign Qualification Registration in California File Number 202109211078, and Texas File Number 805521396, is authorized to provide general advice only. The information on https://kalkine.com/ does not take into account any of your investment objectives, financial situation or needs. You should consider the appropriateness of advice taking into account your own objectives, financial situation and needs and seek independent financial advice before making any financial decisions. The link to our Terms and Conditions and Privacy Policy has been provided for your reference. On the date of publishing the reports (mentioned on the website), employees and/or associates of Kalkine do not hold positions in any of the stocks covered on the website. These stocks can change any time and readers of the reports should not consider these stocks as advice or recommendations later.
Past performance is not a reliable indicator of future performance.
 Please wait processing your request...