
This week’s report covers Direxion Daily MSFT Bull 2X - MSFU (Underlying Stock Microsoft) , Leverage Shares 2X Long CRCL - CRCG (underlying stock - Circle Inc - CRCL) which are ‘Directional Leveraged ETFs’ that use financial derivatives and debt to amplify the returns of an underlying index, typically by 2x or 3x. These leveraged ETFs aim to provide magnified exposure to the price movements of a specific asset class, either in the direction of rising (bullish) or falling (bearish) prices.
Section 1: Direxion Daily MSFT Bull 2X - MSFU
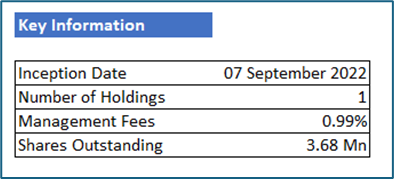
The Fund aims to deliver daily investment results that correspond to 200% of the active daily performance of Microsoft (MSFT), before accounting for fees and expenses. This means that if MSFT’s stock price increases by 1% on a given day, the Fund is designed to increase by approximately 2%, leveraging the underlying asset’s daily movements. Such a strategy involves significant risk and volatility, as the Fund seeks to amplify the daily gains of MSFT, which can also lead to magnified losses during periods of decline. Investors should be aware that the Fund's objective is focused on short-term daily performance rather than long-term results, making it suitable primarily for sophisticated investors with a high-risk tolerance.
Under normal circumstances, the Fund invests at least 80% of its net assets in securities of MSFT and various financial instruments that provide leveraged exposure to MSFT. These instruments include swap agreements, options, and other derivatives designed to magnify the daily returns of the underlying stock. By employing these strategies, the Fund aims to achieve its targeted leveraged exposure, allowing it to efficiently capture the daily performance of MSFT. However, the use of derivatives and leverage also introduces additional risks, such as counterparty risk and increased volatility, which investors should carefully consider before investing.
Underlying Stock: Microsoft Corp. (NASDAQ: MSFT)
Microsoft Corporation is a technology company. The Company develops and supports software, services, devices, and solutions. The Company’s segments include Productivity and Business Processes, Intelligent Cloud, and More Personal Computing. The Productivity and Business Processes segment consists of products and services in its portfolio of productivity, communication, and information services.
Section 2: Technical Analysis on ETF and Underlying Asset
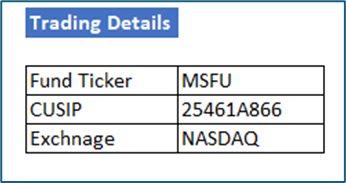
NASDAQ: MSFU
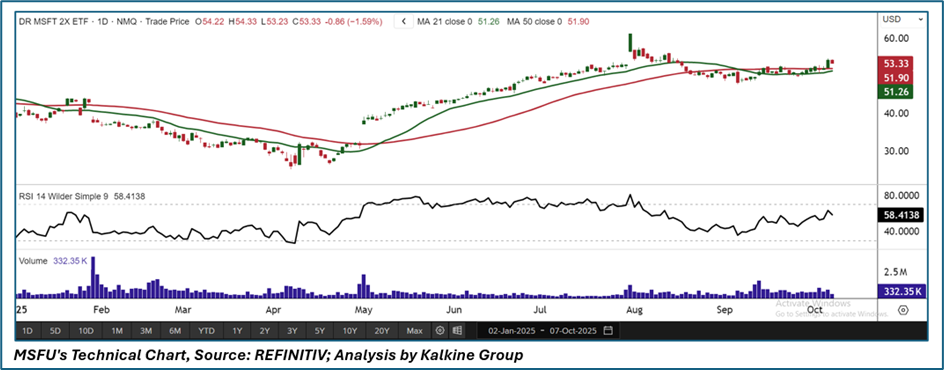
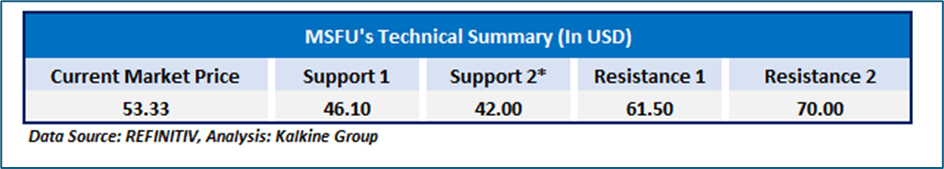
The technical outlook for MSFU has recently experienced a notable upward movement followed by a moderate correction. The stock price is demonstrating resilience around the $51 level, consolidating for a period before eventually climbing higher, which suggests the potential for further gains in the near term. Additionally, the price has regained both its 21-period and 50-period EMAs, reinforcing a positive outlook. Conversely, if the price drops below these key moving averages, it could encounter additional downside risk. The 14-period RSI remains above the midpoint, supporting a positive bias. Ultimately, the future direction of MSFU will largely hinge on these critical support and resistance levels, as they will influence supply and demand dynamics that drive the stock’s price movements.
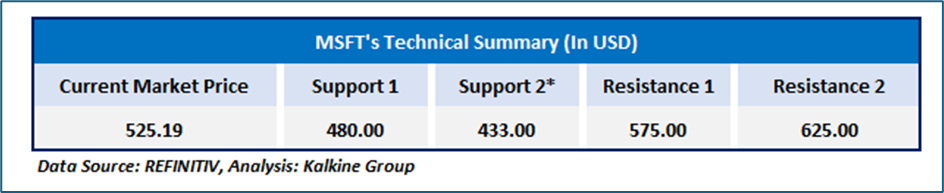
Underlying Asset Analysis: NASDAQ: MSFT
Microsoft (MSFT) continues to exhibit a broader uptrend, with the stock consistently forming higher highs and demonstrating resilience during each dip. Recently, the price successfully breached the key psychological level of $500 and is currently sustaining above it. However, a decisive move below this level could signal potential downside risk.
Looking ahead, the stock’s near-term direction will largely hinge on its ability to maintain support above this critical threshold, while resistance at previous highs remains a key level to watch. These price zones will play a pivotal role in shaping the supply and demand dynamics that influence MSFT’s future movements.
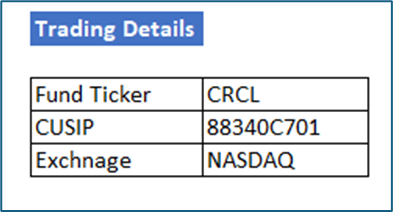
Section 1: Leverage Shares 2X Long CRCL - CRCG
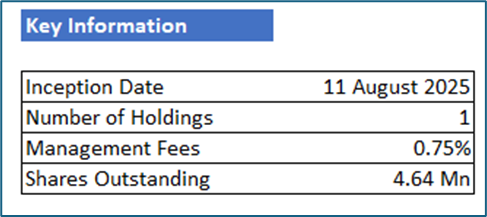
The Fund aims to deliver daily leveraged investment results, making it distinct from most other exchange-traded funds (ETFs). Its primary objective is to provide investors with amplified exposure to the performance of its underlying asset, which in this case is Circle Internet Group, Inc. This leveraged approach allows the Fund to magnify the daily price movements of the target asset, offering the potential for higher returns in favorable market conditions. However, it also comes with increased risk, as losses can be similarly amplified, especially over periods longer than a single trading day due to the effects of compounding.
To achieve this, the Fund invests at least 80% of its net assets in financial instruments that collectively offer 200% daily leveraged exposure to the price of Circle Internet Group, Inc. These financial instruments may include derivatives such as futures, options, swaps, or other leverage-based products. By utilizing these instruments, the Fund aims to mirror twice the daily movement of the underlying asset, providing investors with a highly leveraged investment vehicle designed for short-term trading strategies rather than long-term holdings. Investors should carefully consider the risks associated with leveraged ETFs, including volatility and potential for significant loss, before investing.
Underlying Stock: Circle Internet Group, Inc.
Circle Internet Group, Inc. (NYSE: CRCL) is a global financial technology company. It operates as a platform, network, and market infrastructure for stablecoin and blockchain applications and the issuer of a United States dollar-denominated stablecoin, USDC and a euro-denominated stablecoin, EURC (collectively Circle stablecoins). It provides a stablecoin network and a range of blockchain-specific software infrastructure. Its product offerings include Stablecoins, Developer Services, Integration Services, and Tokenized Funds.
Section 2: Technical Analysis on ETF and Underlying Asset
NASDAQ: CRCG
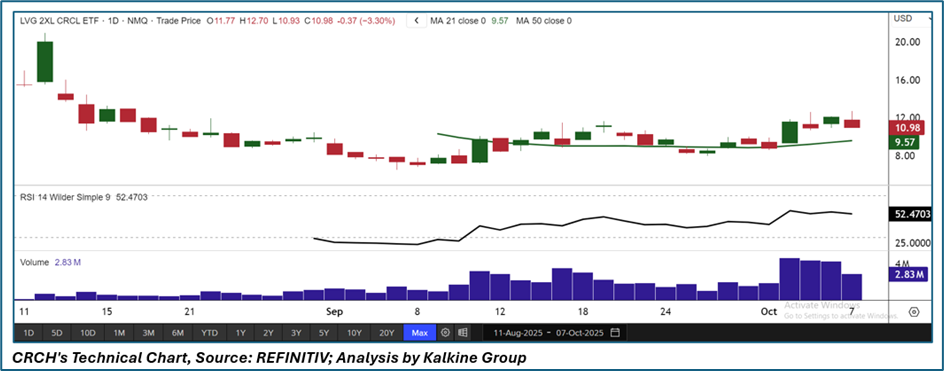
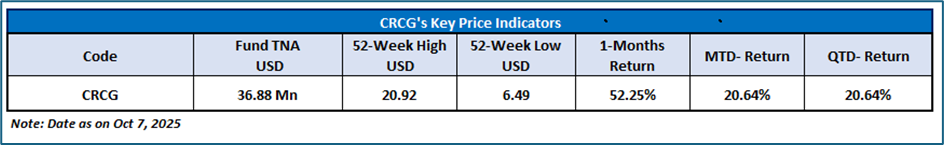
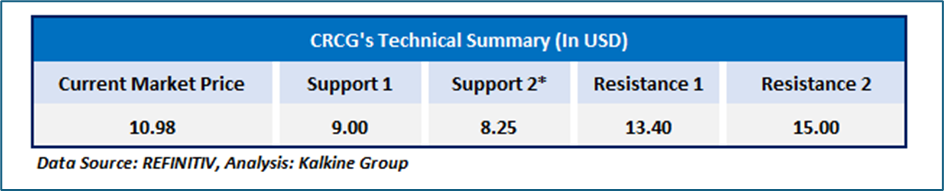
CRCG has shown strong bullish momentum, with the stock currently trading near USD $12 following a sharp rally that began in mid-September. This upward move has been fueled by sustained buying pressure, pushing the price well above its key moving averages. The short-term EMAs are trending higher, signaling strengthening momentum, while the RSI sits around 57—indicating there may still be room for further upside, as the stock is not yet in overbought territory.
Looking ahead, CRCG’s future direction will largely depend on its ability to hold key support levels and break through established resistance, which will shape the supply and demand dynamics driving price action.
However, investors should remain cautious, as sharp rallies can often lead to increased volatility and potential pullbacks, especially if broader market sentiment shifts.
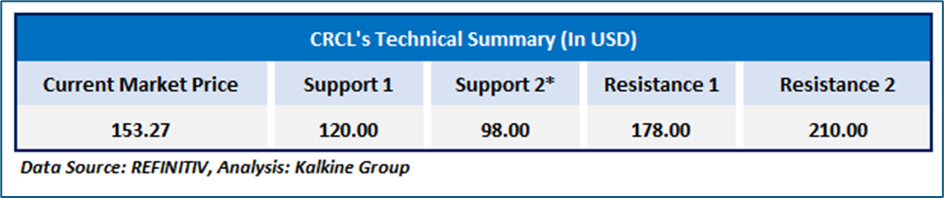
Underlying Asset Analysis: NASDAQ: CRCL
CRCL has found support at key levels and has since drifted higher, buoyed by increasing interest in stablecoins and favorable regulatory developments. The stock has also reclaimed both its 21-period and 50-period EMAs, reinforcing a constructive technical setup and suggesting continued bullish momentum. The 14-period RSI remains above the neutral 50 mark, indicating a positive bias without signaling overbought conditions. However, a break below these key moving averages could expose the stock to renewed downside risk.

Kalkine Equities LLC, with Delaware File Number 4697384, Foreign Qualification Registration in California File Number 202109211078, and Texas File Number 805521396, is authorized to provide general advice only. The information on https://kalkine.com/ does not take into account any of your investment objectives, financial situation or needs. You should consider the appropriateness of advice taking into account your own objectives, financial situation and needs and seek independent financial advice before making any financial decisions. The link to our Terms and Conditions and Privacy Policy has been provided for your reference. On the date of publishing the reports (mentioned on the website), employees and/or associates of Kalkine do not hold positions in any of the stocks covered on the website. These stocks can change any time and readers of the reports should not consider these stocks as advice or recommendations later.
Past performance is not a reliable indicator of future performance.
 Please wait processing your request...