
Overview
Dynamic Core ETF Report covers an innovative investment product, an actively managed ETF that seek capital appreciation by investing in U.S. equities and other instruments. It dynamically adjusts its exposure based on market volatility, aiming to reduce risk during turbulent periods and increase exposure when conditions are favourable, providing a flexible strategy to manage market fluctuations.
This week’s report covers Defiance Daily Target 2X Long SOFI ETF & Defiance Daily Target 2X Long SMCI ETF which are ‘Directional Leveraged ETFs’ that use financial derivatives and debt to amplify the returns of an underlying index, typically by 2x or 3x. These leveraged ETFs aim to provide magnified exposure to the price movements of a specific asset class, either in the direction of rising (bullish) or falling (bearish) prices.
Section 1: Defiance Daily Target 2X Long SOFI ETF
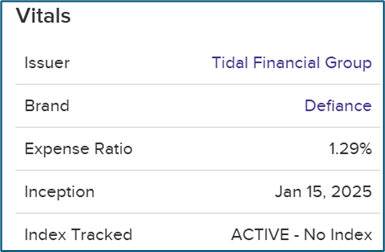
The Fund seeks daily leveraged investment results of two times (200%) the daily percentage change in the share price of SoFi Technologies, Inc (SOFI). The Fund may enter into one or more swap agreements with financial institutions for a specified period, which may range from one day to longer than a year.
Its performance over extended periods diverges from the expected 200% due to the compounding effect of daily returns, which is influenced by factors like holding duration and stock volatility. High volatility amplifies the impact of compounding, potentially leading to significant deviations from the underlying stock’s performance. Consequently, this ETF is designed for short-term trading rather than buy-and-hold strategies.
Underlying Stock: SoFi Technologies Inc (NASDAQ: SOFI)
SoFi Technologies, Inc. is a member-centric, one-stop shop for digital financial services. The Company, through its lending and financial services products, allows members to borrow, save, spend, invest and protect their money. The Company's segments include Lending, Technology Platform and Financial Services.
Section 2: Technical Analysis on ETF and Underlying Asset
NASDAQ: SOFX
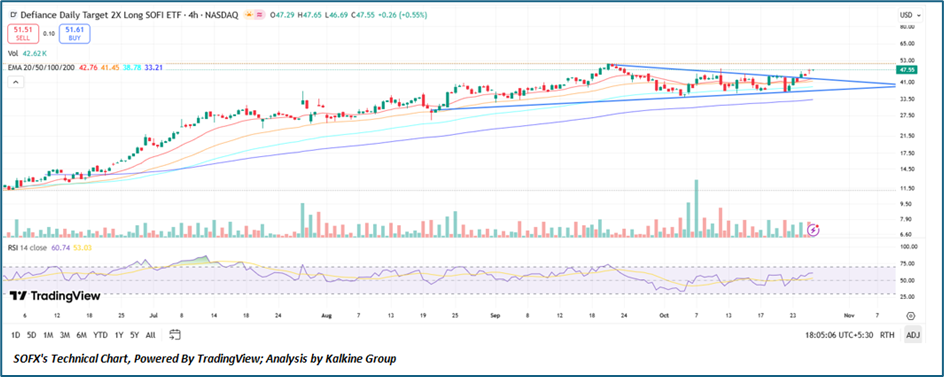
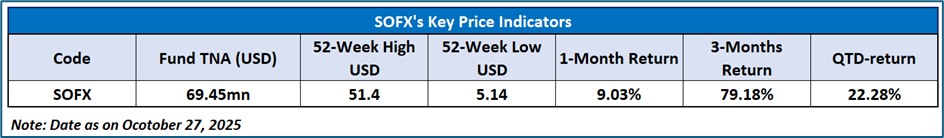
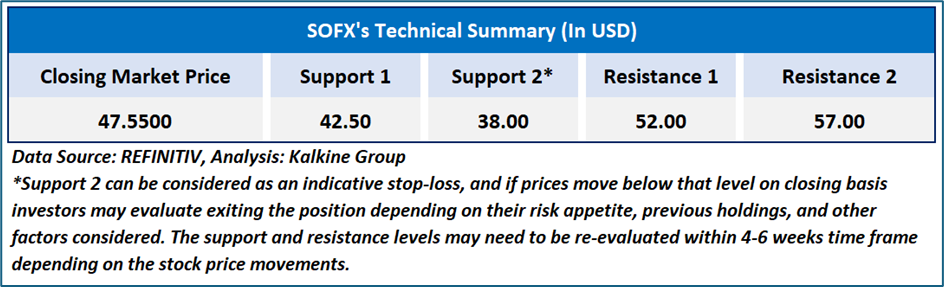
The Defiance Daily Target 2X Long SOFI ETF (NASDAQ: SOFX) is exhibiting a strong bullish setup, trading near USD 47.55 and holding firmly above its key 20-, 50-, 100-, and 200-period EMAs, signaling sustained upward momentum. The formation of a symmetrical triangle pattern suggests a potential breakout, with the RSI at 53.03 reflecting steady, neutral-to-bullish sentiment. Immediate resistance lies around USD 51.50–52.00, and a breakout above this level could propel the ETF toward USD 55.00–58.00, while strong support near USD 42.00–43.00 continues to anchor the trend. Overall, SOFX’s technical point to continued strength with improving buying interest, and a confirmed move above resistance may reinforce the ETF’s medium-term uptrend, attracting momentum-driven investors.
Underlying Asset Analysis: NASDAQ: SOFI
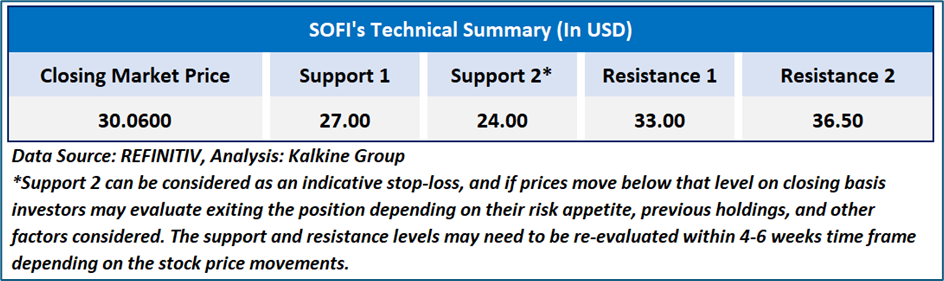
SoFi Technologies Inc. (NASDAQ: SOFI) is trading around USD 30.00, maintaining a firm uptrend supported by a series of higher lows and consistent buying activity. The stock is holding above all major exponential moving averages (20-, 50-, 100-, and 200-period), which are aligned positively, signaling strong bullish momentum. The RSI at 62.03 indicates healthy strength with room for further upside before reaching overbought territory. Price action shows a symmetrical triangle breakout pattern, suggesting consolidation before a potential upward move, with resistance near USD 31.50–32.00 and key support around USD 28.00–28.50. Sustained trading above USD 30.50 may confirm a breakout, paving the way for a rally toward the USD 33.00–34.00 zone in the near term, supported by rising volume and improving sentiment.
Section 1: Defiance Daily Target 2X Long SMCI ETF
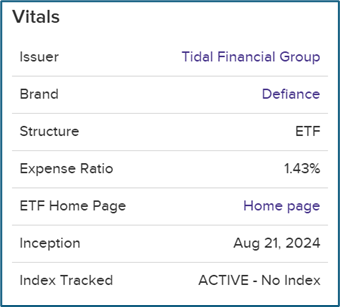
The Fund seeks daily investment results, before fees and expenses, of two times (200%) the daily percentage change in the share price of Super Micro Computer, Inc. The Fund is an actively managed ETF that attempts to achieve two times the daily percentage change in the share price of the Underlying Security.
Its performance over extended periods diverge from the expected 200% due to the compounding effect of daily returns, which is influenced by factors like holding duration and stock volatility. High volatility amplifies the impact of compounding, potentially leading to significant deviations from the underlying stock’s performance. Consequently, this ETF is designed for short-term trading rather than buy-and-hold strategies.
Underlying Stock: Super Micro Computer Inc
Super Micro Computer, Inc. provides application-optimized Total IT solutions. It delivers rack-scale solutions optimized for various workloads, including artificial intelligence and high-performance computing, where acceleration is critical. It produces a portfolio of server and storage solutions for enterprise data centers, cloud service providers and edge computing (5G Telco, Retail and embedded).
Section 2: Technical Analysis on ETF and Underlying Asset
NASDAQ: SMCX
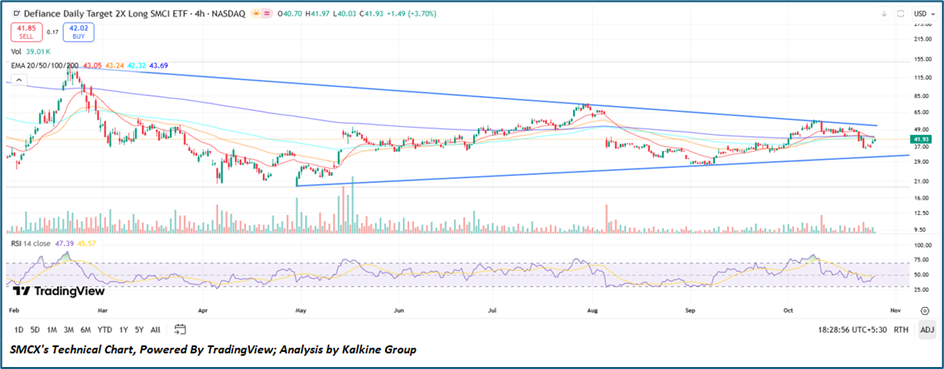
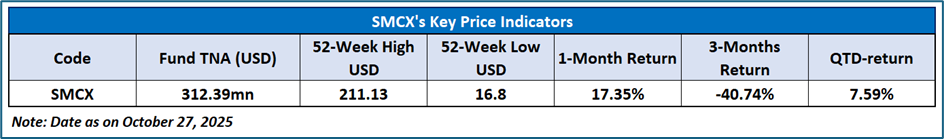
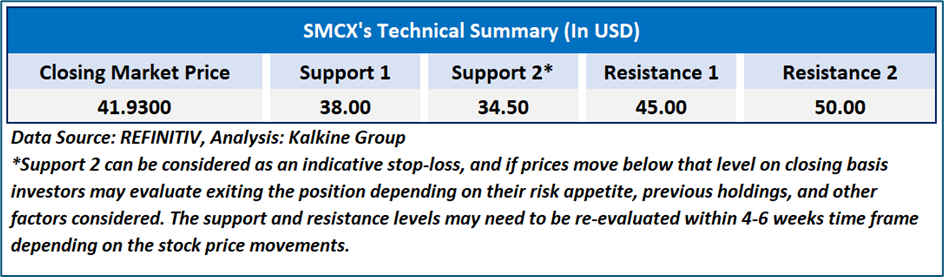
The Defiance Daily Target 2X Long SMCI ETF (NASDAQ: SMCX) is currently trading near USD 41.93, showing signs of recovery after rebounding from its recent support zone around USD 37.00. The ETF is consolidating within a broad descending channel pattern, with resistance near USD 48.00–50.00 and support near USD 30.00–32.00, indicating potential accumulation at lower levels. The RSI at 47.39 suggests neutral momentum, hinting at stabilization after a recent corrective phase. Although short-term moving averages (20-, 50-, 100-, and 200-period EMAs) are converging, signaling a potential trend reversal setup, confirmation above the USD 45.00–46.00 zone could open the path for a rebound toward USD 50.00. Overall, SMCX appears to be forming a base, with improving sentiment likely to support a near-term recovery if buying pressure sustains above key support levels.
Underlying Asset Analysis: NASDAQ: SMCI
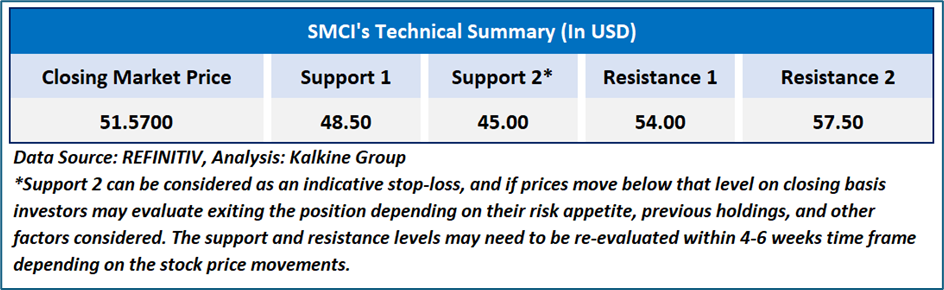
Super Micro Computer Inc. (NASDAQ: SMCI) is trading near USD 51.57, displaying a solid rebound from its ascending trendline support around USD 46.00, suggesting renewed buying interest after a brief correction. The stock is holding above its 20-, 50-, 100-, and 200-period EMAs, which are beginning to converge, indicating a potential trend continuation if momentum strengthens. The RSI at 58.45 shows moderately bullish momentum, with room for further upside before entering overbought territory. A breakout above the USD 55.00–57.00 resistance zone could trigger a move toward USD 63.00–65.00, while key support remains at USD 46.00–47.00. Overall, SMCI’s technical setup reflects strengthening momentum within a long-term ascending channel, supported by improving sentiment and accumulation near critical moving averages.
Related Risk: Investing in the Fund carries inherent risks, including potential losses. The Fund's NAV and performance are influenced by various factors. Key risks include the effects of compounding, market volatility, and underlying stock risks, which can significantly impact returns and increase the likelihood of financial losses.
Note 1: Past performance is not a reliable indicator of future performance.Note 2: The reference date for all price data, currency, technical indicators, support, and resistance level is October 27, 2025. The reference data in this report has been partly sourced from REFINITIVNote 3: ‘Kalkine reports are prepared based on the stock prices captured either from the New York Stock Exchange (NYSE), NASDAQ Capital Markets (NASDAQ), and or REFINITIV. Typically, all sources (NYSE, NASDAQ, or REFINITIV) may reflect stock prices with a delay which could be a lag of 25-30 minutes. There can be no assurance that future results or events will be consistent with the information provided in the report. The information is subject to change without any prior notice.
Kalkine Equities LLC, with Delaware File Number 4697384, Foreign Qualification Registration in California File Number 202109211078, and Texas File Number 805521396, is authorized to provide general advice only. The information on https://kalkine.com/ does not take into account any of your investment objectives, financial situation or needs. You should consider the appropriateness of advice taking into account your own objectives, financial situation and needs and seek independent financial advice before making any financial decisions. The link to our Terms and Conditions and Privacy Policy has been provided for your reference. On the date of publishing the reports (mentioned on the website), employees and/or associates of Kalkine do not hold positions in any of the stocks covered on the website. These stocks can change any time and readers of the reports should not consider these stocks as advice or recommendations later.
Past performance is not a reliable indicator of future performance.
 Please wait processing your request...