
Section 1: Company Overview and Fundamentals
1.1 Company Overview:
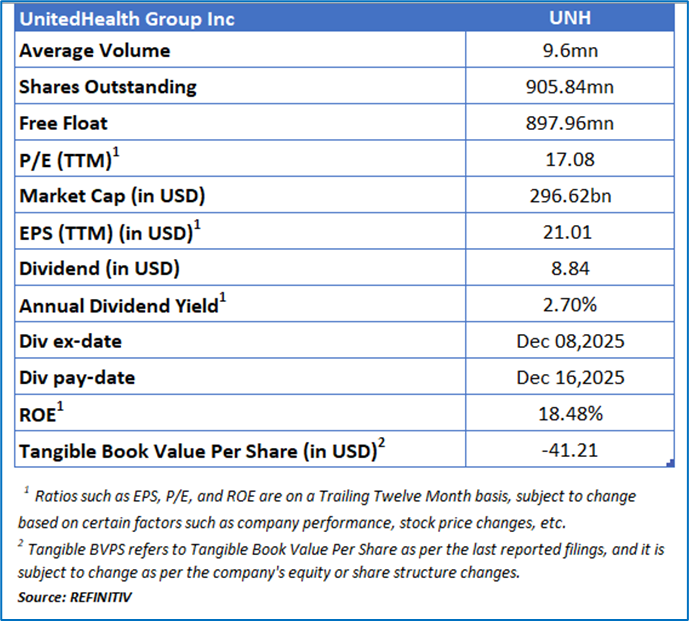
UnitedHealth Group Inc (NYSE: UNH) is a diversified healthcare and well-being organization operating through four primary segments — Optum Health, Optum Insight, Optum Rx, and UnitedHealthcare. The UnitedHealthcare division encompasses Employer & Individual, Medicare & Retirement, and Community & State businesses, collectively providing a broad range of health benefit and service solutions across multiple markets.
Kalkine’s Dividend Income Report covers the Company Overview, Key positives & negatives, Investment summary, Key investment metrics, Top 10 shareholding, Business updates and insights into company recent financial results, Key Risks & Outlook, Price performance and technical summary, Target Price, and Recommendation on the stock.
Price Performance:
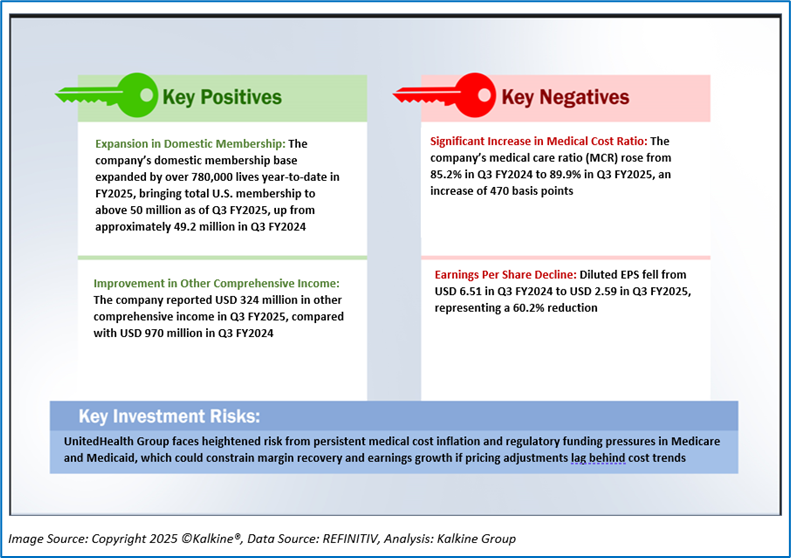
1.2 The Key Positives, Negatives, and Investment summary
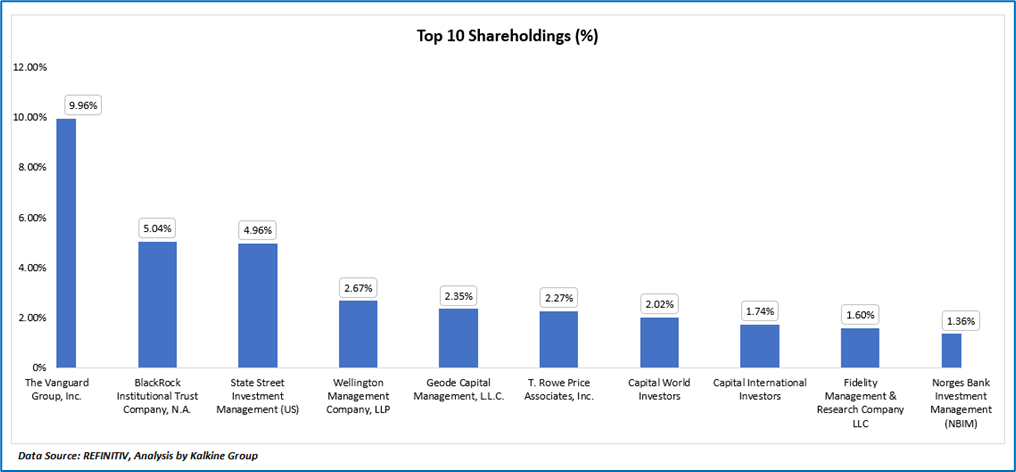
1.3 Top 10 shareholders:
The top 10 shareholders together form ~ 33.98% of the total shareholding, signifying concentrated shareholding. The Vanguard Group, Inc. and BlackRock Institutional Trust Company, N.A. are the biggest shareholders, holding the maximum stake in the company at ~9.96% and ~5.04%, respectively.
1.4 Dividend payments with impressive dividend yield:
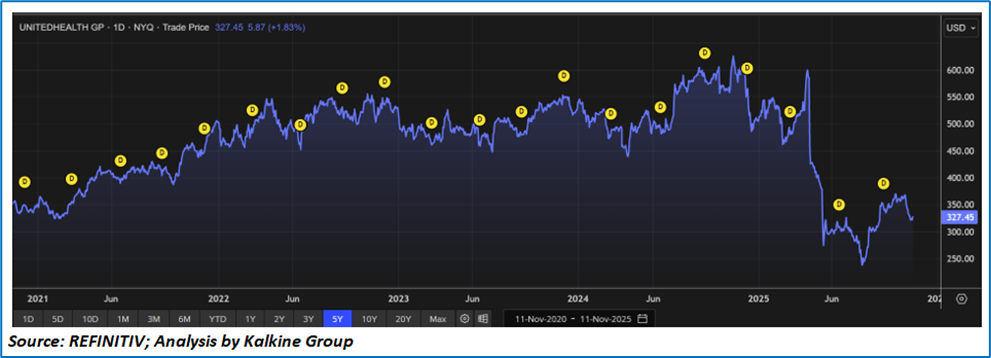
Over the past five years (November 2020–November 2025), UnitedHealth Group’s stock has exhibited a dynamic trajectory reflecting both its strong fundamentals and evolving investor sentiment. From late 2020 through mid-2023, the stock maintained a steady upward trend, climbing from around $330 to nearly $550, supported by consistent double-digit revenue growth, resilient margins, and robust operating cash flows exceeding $20 billion annually. During this period, UnitedHealth upheld a progressive dividend policy, increasing annual payouts from $5.00 in 2020 to $6.88 in 2023, with yields ranging between 1.2% and 1.5%, reflecting investor preference for long-term growth over income returns. However, between mid-2023 and early 2024, the stock entered a consolidation phase as rising medical cost trends and funding pressures in Medicare created earnings uncertainty, prompting valuation moderation. The most significant development came in early 2025, when the stock sharply declined from over $600 to near $300, triggered by a 61% year-over-year drop in Q3 net earnings, a 470-basis-point rise in the medical cost ratio to 89.9%, and declining operating income. Despite these challenges, UnitedHealth increased its annual dividend to $8.84 per share, signaling confidence in its long-term cash generation capabilities. This led to a dividend yield surge to around 2.7%, the highest in five years, marking a shift from a pure growth stock to a hybrid growth-and-income profile. By mid-2025, shares began to stabilize between $320 and $350 as management reaffirmed plans for margin recovery in FY2026 and sustainable double-digit earnings growth from FY2027 onward. The consistent dividend growth, paired with a higher yield and resilient liquidity position, underscores UnitedHealth’s enduring financial strength. The recent correction appears transitional, positioning the stock as a long-term recovery and income opportunity, supported by a strong balance sheet, disciplined execution, and a historically superior dividend track record.
1.5 Key Metrics
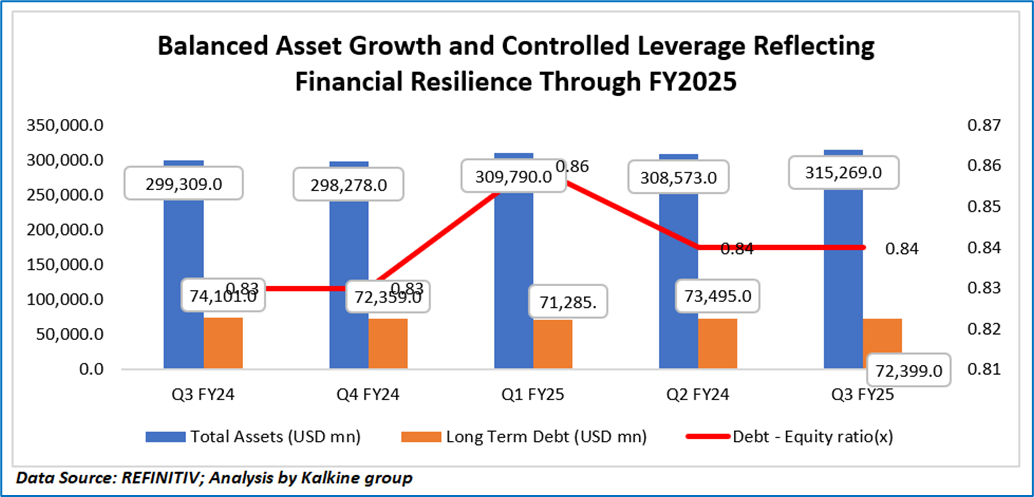
The trend shown in the graph reflects UnitedHealth Group’s evolving balance sheet structure between Q3 FY2024 and Q3 FY2025, driven by a combination of strategic investments, debt management, and operational adjustments. During Q3 and Q4 FY2024, both total assets and long-term debt remained relatively stable, indicating prudent financial management and a balanced capital structure, with the debt-to-equity ratio steady at 0.83x. In Q1 FY2025, total assets rose sharply to USD 309.79 billion from USD 298.28 billion in the previous quarter, primarily due to the completion of acquisitions, including Amedisys, and growth in current assets such as receivables and short-term investments. This expansion led to a temporary rise in leverage, with the debt-to-equity ratio increasing to 0.86x, reflecting the company’s reliance on debt financing to fund its strategic initiatives amid higher medical cost pressures. By Q2 FY2025, assets slightly moderated to USD 308.57 billion while long-term debt reduced to USD 73.50 billion, lowering the debt-to-equity ratio to 0.84x, signaling early deleveraging efforts supported by strong operating cash flows of USD 18.6 billion over the first nine months of the year. In Q3 FY2025, total assets grew again to USD 315.27 billion as goodwill and short-term investments increased following continued integration of acquired entities, while long-term debt remained steady at USD 72.4 billion, keeping leverage unchanged at 0.84x. Overall, this pattern highlights UnitedHealth Group’s strategic balance between growth and financial discipline—temporarily increasing leverage to support acquisitions and liquidity needs early in the year, followed by a focus on stabilizing debt levels and improving balance sheet resilience. The company’s ability to maintain a stable leverage ratio despite margin pressures underscores its solid capital structure and disciplined approach to achieving a long-term target debt-to-capital ratio of around 40% by late FY2026.
Section 2: Business Updates and Financial Highlights
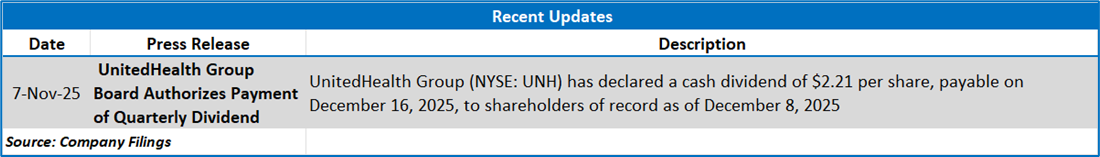
2.1 Recent Updates:
The below picture gives an overview of the recent updates:
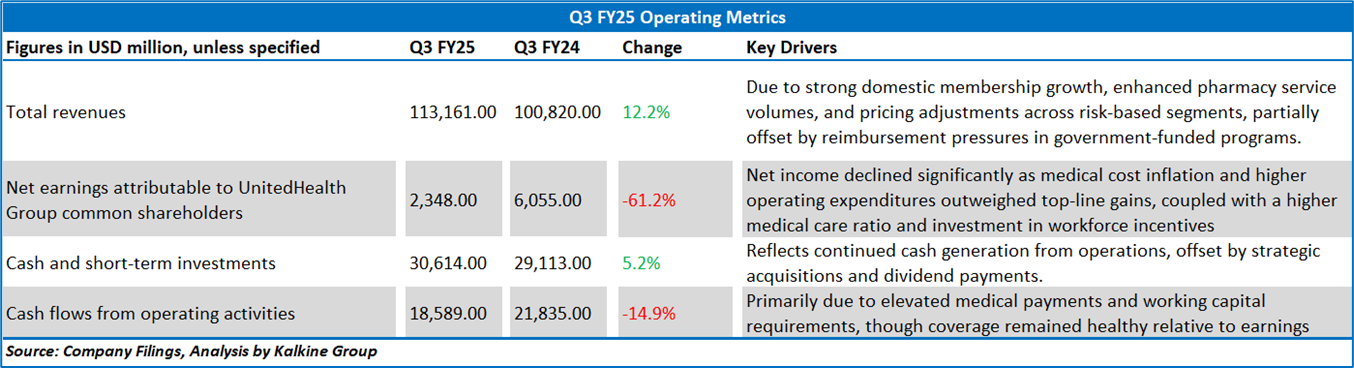
2.2 Insights of Q3 FY25:
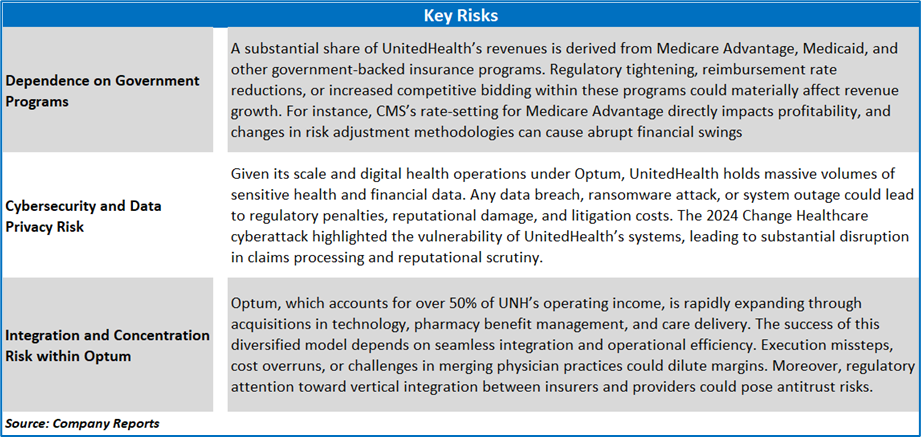
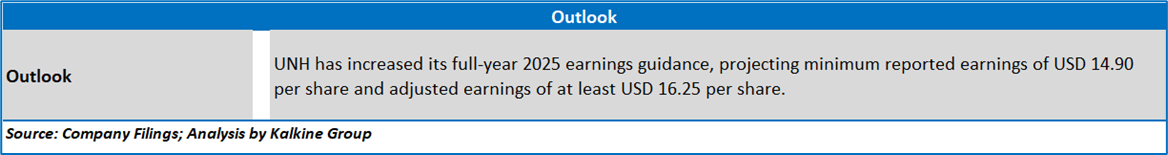
Section 3: Key Risks and Outlook:
Section 4: Stock Recommendation Summary:
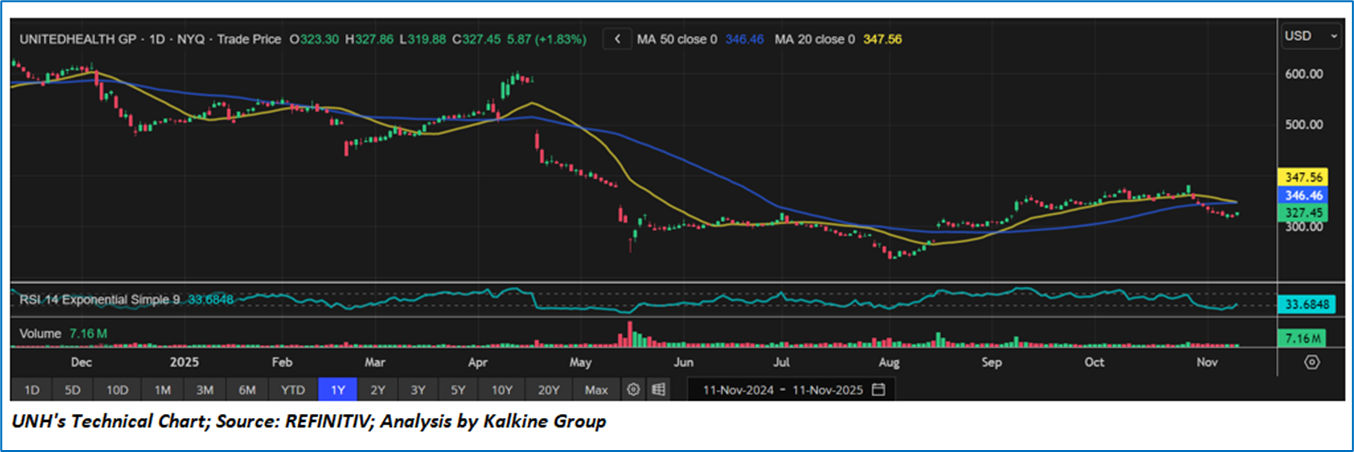
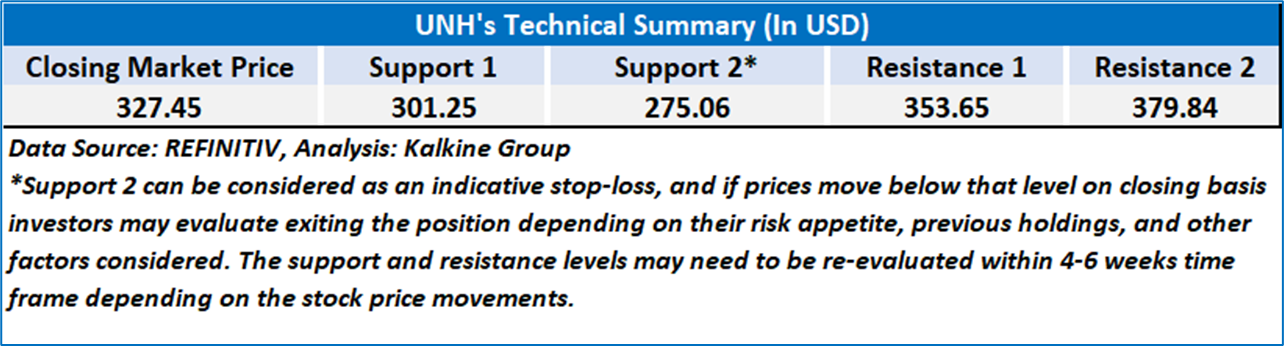
4.1 Technical Summary:
Price Performance:
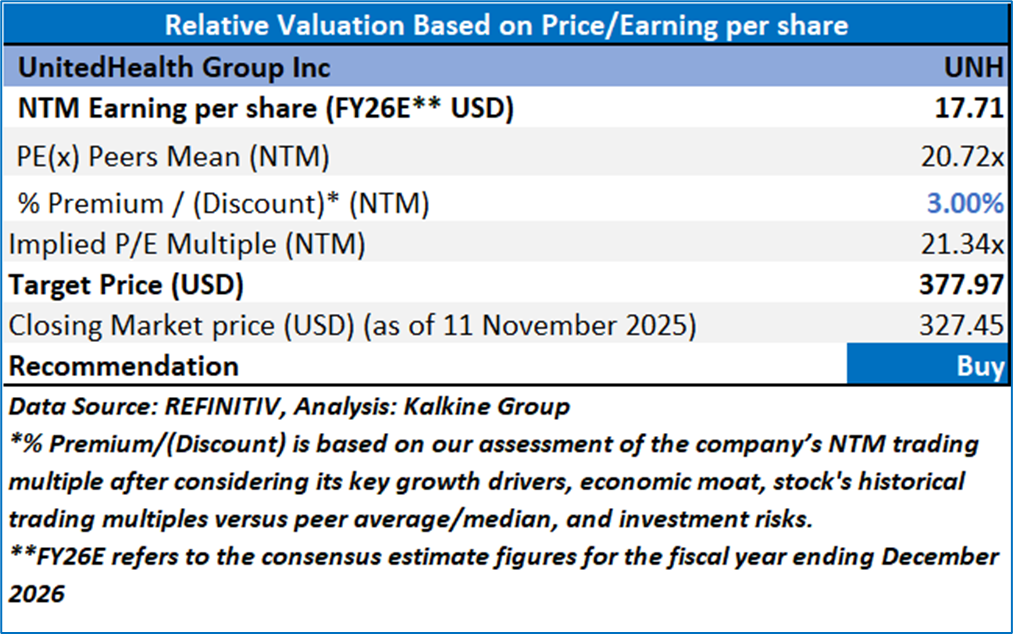
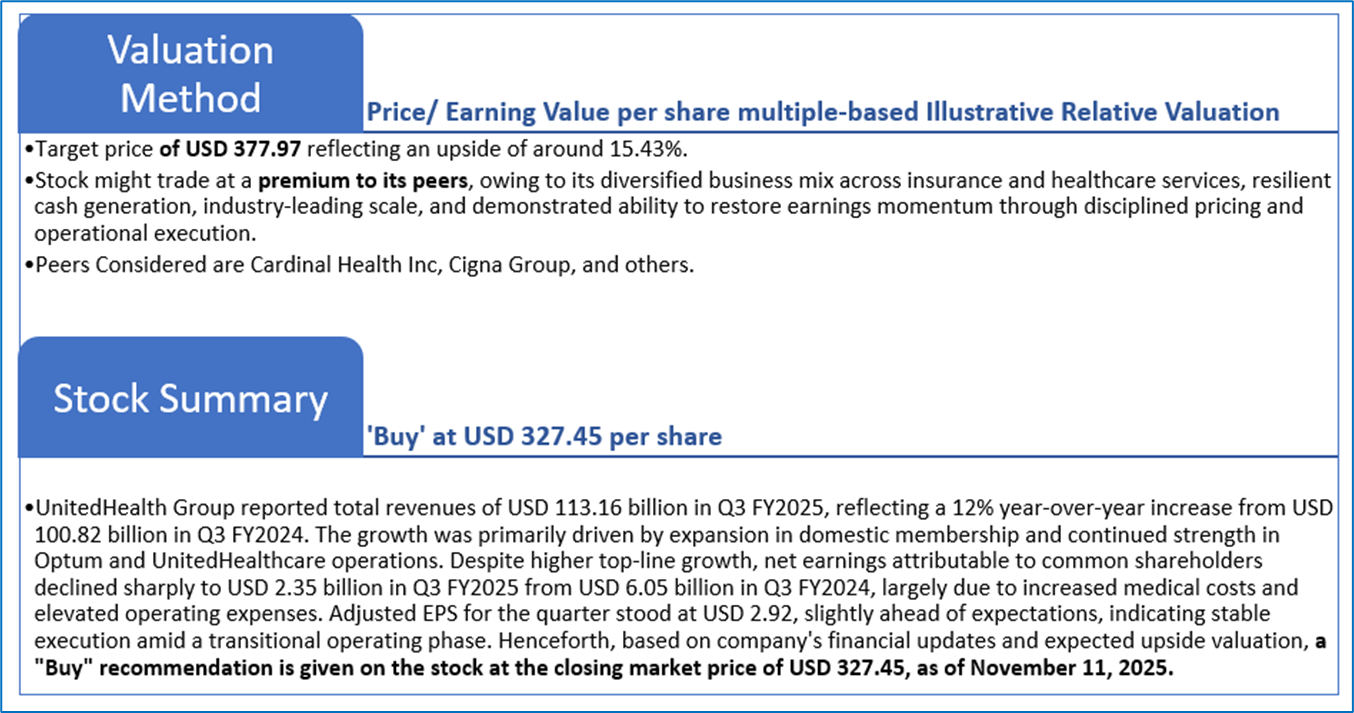
4.2 Fundamental Valuation
Valuation Methodology: Price/Earnings Per Share Multiple Based Relative Valuation
Markets are trading in a highly volatile zone currently due to certain macroeconomic issues and geopolitical tensions prevailing. Therefore, it is prudent to follow a cautious approach while investing.
Note 1: Past performance is not a reliable indicator of future performance.
Note 2: The reference date for all price data, currency, technical indicators, support, and resistance levels is November 11, 2025. The reference data in this report has been partly sourced from REFINITIV.
Note 3: Investment decisions should be made depending on an individual's appetite for upside potential, risks, holding duration, and any previous holdings. An 'Exit' from the stock can be considered if the Target Price mentioned as per the Valuation and or the technical levels provided has been achieved and is subject to the factors discussed above.
Note 4: The report publishing date is as per the Pacific Time Zone.
Technical Indicators Defined: -
Support: A level at which the stock prices tend to find support if they are falling, and a downtrend may take a pause backed by demand or buying interest. Support 1 refers to the nearby support level for the stock and if the price breaches the level, then Support 2 may act as the crucial support level for the stock.
Resistance: A level at which the stock prices tend to find resistance when they are rising, and an uptrend may take a pause due to profit booking or selling interest. Resistance 1 refers to the nearby resistance level for the stock and if the price surpasses the level, then Resistance 2 may act as the crucial resistance level for the stock.
Stop-loss: It is a level to protect against further losses in case of unfavorable movement in the stock prices.
Kalkine Equities LLC, with Delaware File Number 4697384, Foreign Qualification Registration in California File Number 202109211078, and Texas File Number 805521396, is authorized to provide general advice only. The information on https://kalkine.com/ does not take into account any of your investment objectives, financial situation or needs. You should consider the appropriateness of advice taking into account your own objectives, financial situation and needs and seek independent financial advice before making any financial decisions. The link to our Terms and Conditions and Privacy Policy has been provided for your reference. On the date of publishing the reports (mentioned on the website), employees and/or associates of Kalkine do not hold positions in any of the stocks covered on the website. These stocks can change any time and readers of the reports should not consider these stocks as advice or recommendations later.
Past performance is not a reliable indicator of future performance.
 Please wait processing your request...