
Company Overview: Global Atomic Corporation (TSX: GLO) is a diversified Canadian-based company operating through its subsidiaries, with activities spanning both the zinc recycling and uranium exploration sectors. Lineage Cell Therapeutics, Inc. (NYSE: LCTX) is a clinical-stage biotechnology company focused on the development of allogeneic (donor-derived) cell therapies aimed at treating serious neurological and ophthalmic disorders. The Report covers the Price Action, Technical Indicators Analysis along with the Stop Loss Levels, Target Prices, and Recommendations on these two stocks.
Global Markets Wrap-Up
As of May 1, 2025, major U.S. equity benchmarks delivered solid week-to-date (WTD) gains, driven by widespread buying across sectors. The S&P 500 advanced 1.43%, finishing the week at 5,604.14, while the NASDAQ Composite outperformed with a 1.89% gain, closing at 17,710.74, bolstered by strong momentum in the technology sector. In contrast, the Russell 2000, which tracks small-cap stocks, posted a more modest 0.93% WTD rise, ending at 1,975.86, underperforming relative to its large-cap counterparts.
In Canada, the S&P/TSX Venture Composite Index (TSX: ^JX) registered a 1.17% WTD gain, closing the week at 646.15, as of May 1. While the index continued its broader downward trend, Thursday’s session saw pockets of strength emerge in the healthcare, financials, and real estate sectors, offering some relief. However, the upside was capped by continued weakness in technology, consumer cyclicals, basic materials, industrials, energy, and consumer non-cyclicals, which weighed heavily on overall market sentiment.
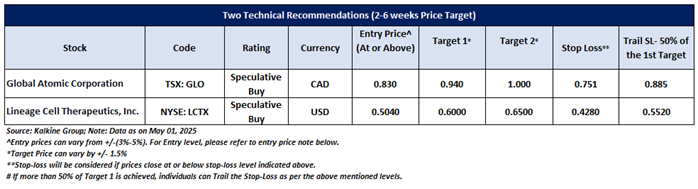
Considering the US and Canadian markets’ performance over the week, following the significant global macros and data front, two stocks that fit the criteria on the technical framework: Global Atomic Corporation (TSX: GLO) and Lineage Cell Therapeutics, Inc. (NYSE: LCTX). The recommendations on these stocks are based on the generic insights, entry price, target prices, and stop-loss for the next 2-6 weeks:
Global Atomic Corporation (TSX: GLO)
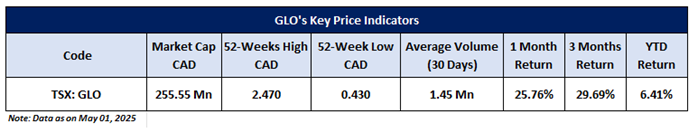
Noted below are the key price indicators for the stock:
Price Action Analysis (On the Daily Chart)
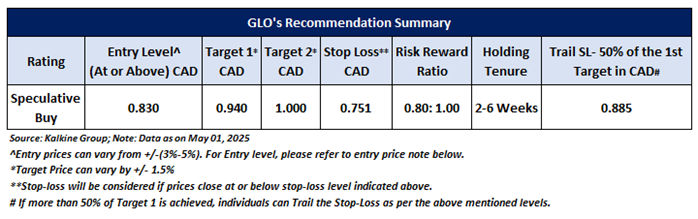
On the daily chart, GLO continues to hold above a critical horizontal support trendline, indicating sustained price strength and the potential for further upward movement in the near term. The stock is gradually advancing toward a key resistance level near CAD 0.940, which could be tested within the next 2 to 6 weeks if current momentum persists. A clear breakout above this resistance zone may act as a bullish trigger, attracting heightened buying interest and potentially setting the stage for continued gains beyond that level.
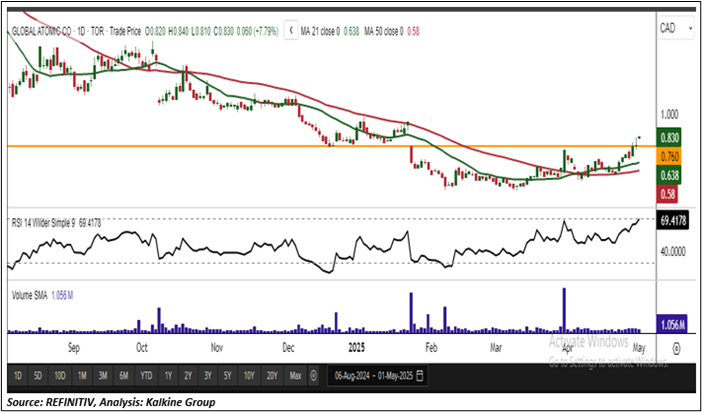
Technical Analysis (On the Daily Chart)
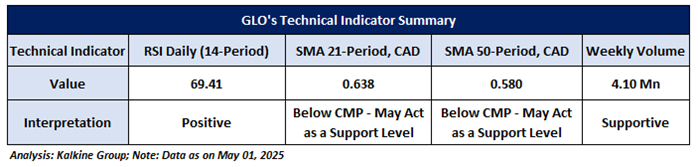
The 14-period Relative Strength Index (RSI) is currently at 69.41, signalling strong positive momentum while staying just below the overbought threshold, which suggests the potential for continued upside. Weekly trading volumes are also supportive of a bullish scenario, adding further conviction to the upward move. In addition, the stock remains positioned above its 21-period Simple Moving Average (SMA) a widely recognized trend-following indicator.
General Recommendation:
As per the above-mentioned price action and technical indicators analysis, Global Atomic Corporation is looking technically well-placed on the chart, and a ‘Speculative Buy’ recommendation has been given on the stock. The summary of recommendations is as follows:
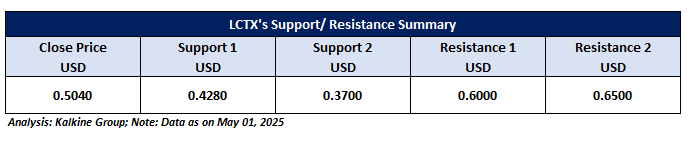
Lineage Cell Therapeutics, Inc. (NYSE: LCTX)
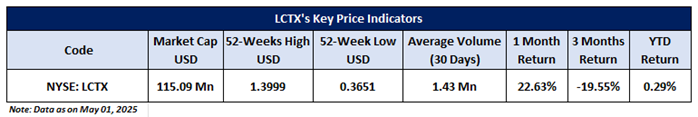
Noted below are the key price indicators for the stock:
Price Action Analysis (On the Daily Chart)
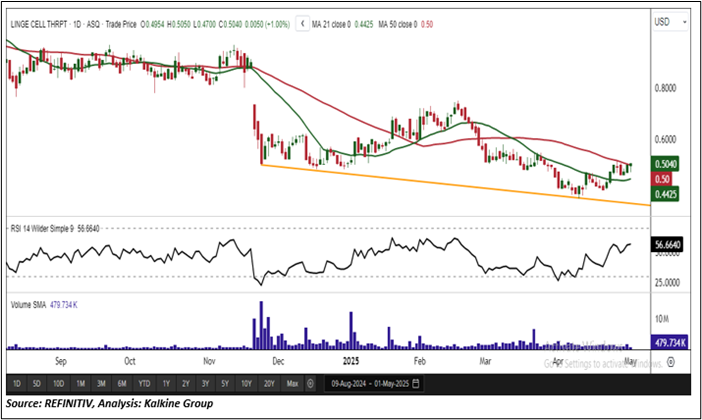
On the daily chart, LCTX stock continues to hold above a critical horizontal support trendline, highlighting the potential for further upward momentum in the near term. The next major resistance level is near USD 0.600, a target the stock could reach within the coming 2 to 6 weeks if current trends persist. A clear breakout above this resistance zone could stimulate increased buying interest, potentially triggering a sustained uptrend and extending the stock’s bullish trajectory. The broader technical outlook remains favorable, reflecting rising market optimism as long as the underlying support base stays intact.
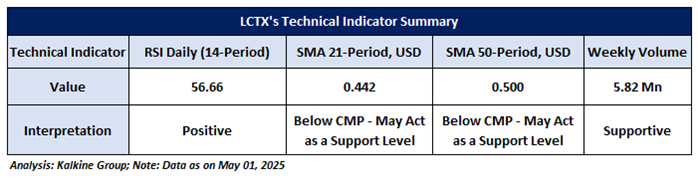
Technical Analysis (On the Daily Chart)
On the daily chart, the 14-period Relative Strength Index (RSI) stands at 56.66, indicating a neutral-to-moderately bullish momentum signalling that buying strength is building without yet entering overbought territory. Weekly trading volumes suggest a steady undercurrent of buying interest, lending further support to the potential for upward movement. Moreover, the stock remains above its 21-period Simple Moving Average (SMA), a key dynamic support level that reinforces the positive short-term technical outlook.
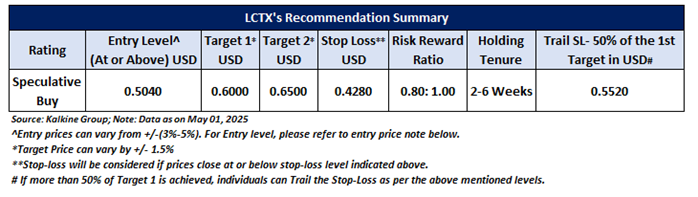
General Recommendation:
As per the above-mentioned price action and technical indicators analysis, Lineage Cell Therapeutics, Inc. is looking technically well-placed on the chart, and a ‘Speculative Buy’ recommendation has been given on the stock. The summary of recommendations is as follows:
Investment decisions should be made depending on an individual's appetite for upside potential, risks, and any previous holdings. This recommendation is purely based on technical analysis, and fundamental analysis has not been considered in this report.
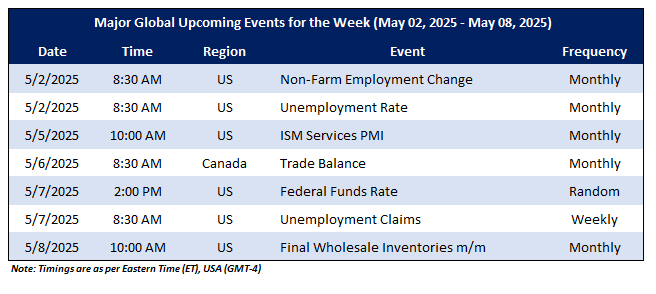
Upcoming Major Global Economic Events
Market events occur daily depending on the data's frequency and generally include updates on CPI, PPI, Core Retail Sales, Unemployment Data, etc. The upcoming week's major global economic events that could impact the S&P/TSX Venture Composite Index and listed stocks' prices are noted below.
Related Risks: This report may be looked at from a high-risk perspective and recommendation is provided for a short duration. Recommendations provided in this report are solely based on technical parameters, and the fundamental performance of the stocks has not been considered in the decision-making process. Other factors which could impact the stock prices include market risks, regulatory risks, interest rates risks, currency risks, social and political instability risks etc.
Markets are trading in a highly volatile zone currently due to certain macro-economic issues and geopolitical tensions prevailing. Therefore, it is prudent to follow a cautious approach while investing.
Kalkine reports are prepared based on the stock prices captured from either REFINITIV or Trading View. Typically, REFINITIV or Trading View may reflect stock prices with a delay which could be a lag of 25-30 minutes. There can be no assurance that future results or events will be consistent with the information provided in the report. The information is subject to change without any prior notice.’
Note 1: Individuals can consider exiting from the stock if the Target Price or Stop loss mentioned as per the technical analysis has been achieved and subject to the factors discussed above.
Note 2: How to Read the Charts?
The Green color line reflects the 21-period moving average, while the red color line indicates the 50-period moving average. SMA helps to identify existing price trend. If the prices are trading above the 21-period and 50-period moving average, then it shows prices are currently trading in a bullish trend.
The Black color line in the chart's lower segment reflects the Relative Strength Index (14-Period), which indicates price momentum and signals momentum in trend. A reading of 70 or above suggests overbought status, while a reading of 30 or below suggests an oversold status.
The Blue color bars in the chart's lower segment show the volume of the stock. The volume is the number of shares that changed hands during a given day. Stocks with high volumes are more liquid than stocks with lesser volume. Liquidity in stocks helps in easier and faster execution of the order.
The Orange color lines are the trend lines drawn by connecting two or more price points and used for trend identification purposes. The trend line also acts as a line of support and resistance.
Technical Indicators Defined: -
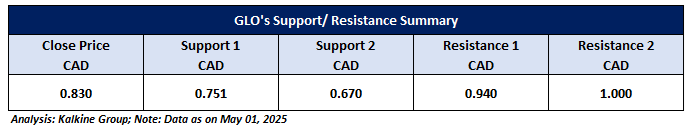
Support: A level at which the stock prices tend to find support if they are falling, and a downtrend may take a pause backed by demand or buying interest. Support 1 refers to the nearby support level for the stock and if the price breaches the level, then Support 2 may act as the crucial support level for the stock.
Resistance: A level at which the stock prices tend to find resistance when they are rising, and an uptrend may take a pause due to profit booking or selling interest. Resistance 1 refers to the nearby resistance level for the stock and if the price surpasses the level, then Resistance 2 may act as the crucial resistance level for the stock.
Stop-loss: In general, it is a level to protect further losses in case of unfavorable movement in the stock prices.
Risk Reward Ratio: The risk reward ratio is the difference between an entry point to a stop loss and profit level and the report is based on ~80% Stop Loss of the Target 1 from the entry point.
A trailing stop-loss is a modification of stop-loss in case of favorable movement in the price to protect the gains. Individual can Trail the Stop-Loss as per the levels if the stock price achieves more than 50% of the Target 1. Individual should consider exiting from the position as per the Trailing Stop-Loss level if the price starts moving downwards after achieving more than 50% of the Target 1.
The reference date for all price data, currency, technical indicators, support, and resistance levels is May 01, 2025. The reference data in this report has been partly sourced from REFINITIV.
Abbreviations
CMP: Current Market Price
SMA: Simple Moving Average
CAD: Canadian Dollar
RSI: Relative Strength Index
USD: United States dollar
Note: Trading decisions require a thorough analysis by individuals. Technical reports in general chart out metrics that may be assessed by individuals before any stock evaluation. The above are illustrative analytical factors used for evaluating the stocks; other parameters can be looked at along with additional risks per se. Past performance is neither an indicator nor a guarantee of future performance.
Kalkine Equities LLC, with Delaware File Number 4697384, Foreign Qualification Registration in California File Number 202109211078, and Texas File Number 805521396, is authorized to provide general advice only. The information on https://kalkine.com/ does not take into account any of your investment objectives, financial situation or needs. You should consider the appropriateness of advice taking into account your own objectives, financial situation and needs and seek independent financial advice before making any financial decisions. The link to our Terms and Conditions and Privacy Policy has been provided for your reference. On the date of publishing the reports (mentioned on the website), employees and/or associates of Kalkine do not hold positions in any of the stocks covered on the website. These stocks can change any time and readers of the reports should not consider these stocks as advice or recommendations later.
Past performance is not a reliable indicator of future performance.
 Please wait processing your request...