
Company Overview: Forsys Metals Corp. (TSX: FSY) focuses on the exploration, acquisition, and development of mineral properties, with a primary emphasis on uranium and gold. The company operates as a single segment dedicated to these activities, aiming to advance its resource projects through strategic exploration and development initiatives. Norsemont Mining Inc. (OTC: NRRSF) is a Canada-based exploration-stage company focused on the acquisition, exploration, and development of resource properties. The company holds a 100% interest in the Choquelimpie gold-silver-copper project located in northern Chile, a historically significant mining region. The Report covers the Price Action, Technical Indicators Analysis along with the Stop Loss Levels, Target Prices, and Recommendations on these two stocks.
Global Markets Wrap-Up
On March 20, 2025, the S&P 500 closed at 5,662.89, recording a week-to-date (WTD) gain of 0.42%. The NASDAQ Composite, heavily weighted in the technology sector, saw a sharper decline of 0.35% for the week, finishing at 17,691.63. In contrast, the Russell 2000 outperformed, ending at 2,068.63 with a WTD gain of approximately 1.20%.
In the Canadian market, the S&P/TSX Venture Composite Index (TSX: ^JX) maintained its upward momentum throughout the week. On March 20, 2025, the index closed at 640.78, posting a week-to-date (WTD) gain of 3.16%. While the healthcare, consumer non-cyclicals, basic materials, financials, and energy sectors provided support, the broader market faced headwinds. Weakness in technology, industrials, real estate, and consumer cyclicals on Thursday contributed to the overall market challenges.
Considering the US and Canadian markets’ performance over the week, following the significant global macros and data front, two stocks that fit the criteria on the technical framework: Forsys Metals Corp. (TSX: FSY) and Norsemont Mining Inc. (OTC: NRRSF). The recommendations on these stocks are based on the generic insights, entry price, target prices, and stop-loss for the next 2-6 weeks:
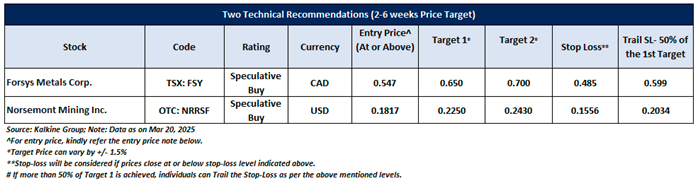
Forsys Metals Corp. (TSX: FSY)
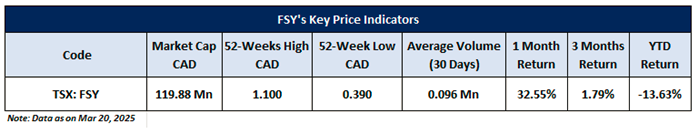
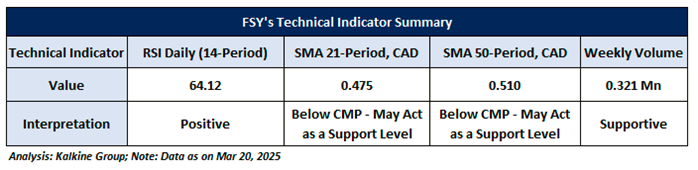
Noted below are the key price indicators for the stock:
Price Action Analysis (On the Daily Chart)
On the daily chart, FSY stock continues to hold above the support level of its horizontal trendline, indicating potential upward momentum in the near term. The next key resistance is around CAD 0.650, a level the stock could test within the next 2-6 weeks. A breakout above this resistance may attract increased buying interest, potentially propelling the stock higher.
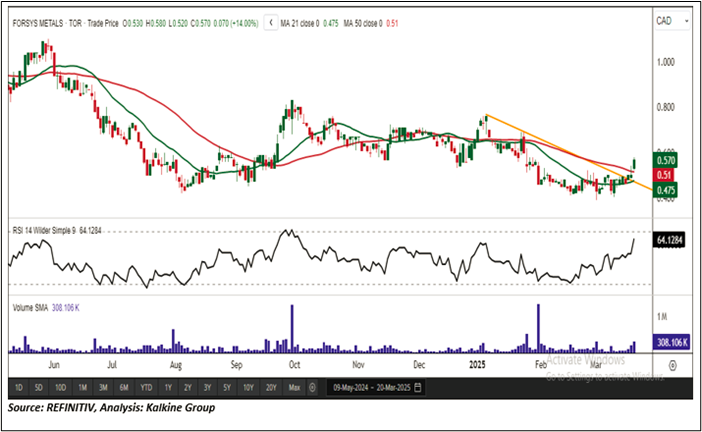
Technical Analysis (On the Daily Chart)
On the daily chart, the 14-period Relative Strength Index (RSI) stands at 64.12, indicating strong positive momentum. Weekly trading volumes further support the potential for an upward move. Additionally, the stock's current market price remains above the 21-period Simple Moving Average (SMA), a key trend-following indicator that could serve as a dynamic support level in the near term.
General Recommendation:
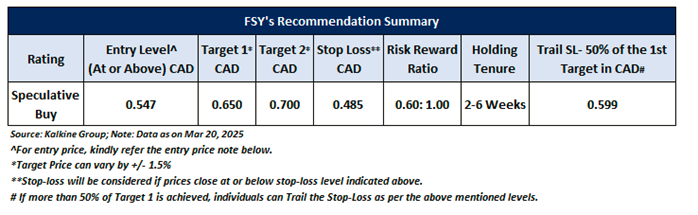
As per the above-mentioned price action and technical indicators analysis, Forsys Metals Corp. is looking technically well-placed on the chart, and a ‘Speculative Buy’ recommendation has been given on the stock. The summary of recommendations is as follows:
Norsemont Mining Inc. (OTC: NRRSF)
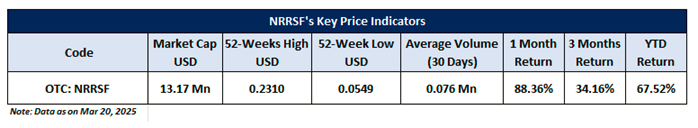
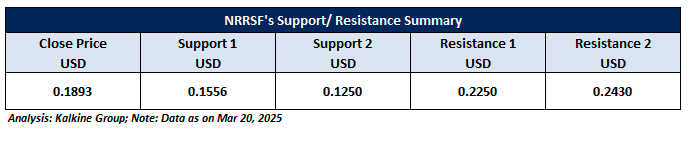
Noted below are the key price indicators for the stock:
Price Action Analysis (On the Weekly Chart)
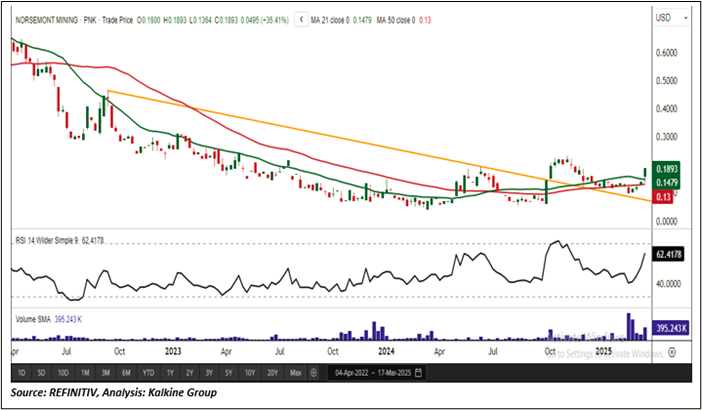
On the weekly chart, NRRSF stock is holding above the falling trendline breakout level, signaling the potential for continued upward momentum. The next key resistance is around USD 0.2250, a level the stock could test within the next 2-6 weeks. A decisive breakout above this resistance could attract increased buying interest, potentially driving a sustained uptrend and further extending the stock’s upward movement.
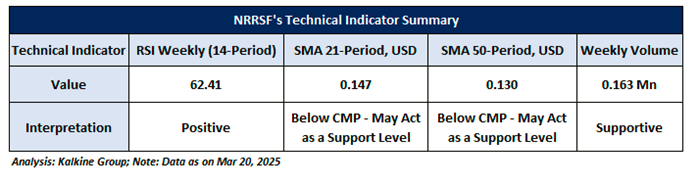
Technical Analysis (On the Weekly Chart)
On the weekly chart, the 14-period Relative Strength Index (RSI) is at 62.41, reflecting a neutral stance rather than strong bullish momentum. While weekly trading volumes indicate the potential for an upward move, the stock’s price remains above the 21-period Simple Moving Average (SMA), which now acts as a key support level. Holding above this SMA could reinforce the stock's stability and sustain its potential upward trajectory.
General Recommendation:
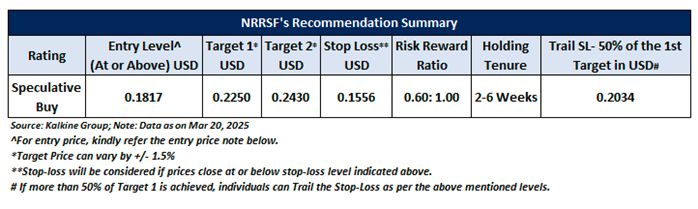
As per the above-mentioned price action and technical indicators analysis, Norsemont Mining Inc. is looking technically well-placed on the chart, and a ‘Speculative Buy’ recommendation has been given on the stock. The summary of recommendations is as follows:
Investment decisions should be made depending on an individual's appetite for upside potential, risks, and any previous holdings. This recommendation is purely based on technical analysis, and fundamental analysis has not been considered in this report.
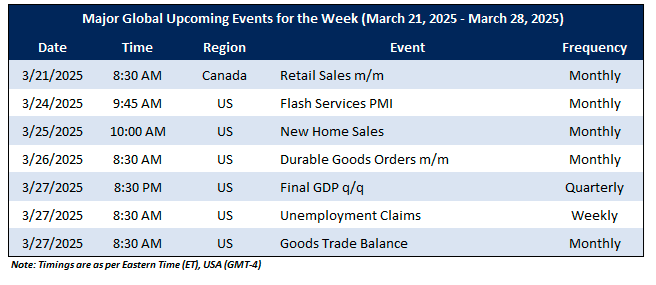
Upcoming Major Global Economic Events
Market events occur daily depending on the data's frequency and generally include updates on CPI, PPI, Core Retail Sales, Unemployment Data, etc. The upcoming week's major global economic events that could impact the S&P/TSX Venture Composite Index and listed stocks' prices are noted below.
Related Risks: This report may be looked at from a high-risk perspective and recommendation is provided for a short duration. Recommendations provided in this report are solely based on technical parameters, and the fundamental performance of the stocks has not been considered in the decision-making process. Other factors which could impact the stock prices include market risks, regulatory risks, interest rates risks, currency risks, social and political instability risks etc.
Markets are trading in a highly volatile zone currently due to certain macro-economic issues and geopolitical tensions prevailing. Therefore, it is prudent to follow a cautious approach while investing.
Kalkine reports are prepared based on the stock prices captured from either REFINITIV or Trading View. Typically, REFINITIV or Trading View may reflect stock prices with a delay which could be a lag of 25-30 minutes. There can be no assurance that future results or events will be consistent with the information provided in the report. The information is subject to change without any prior notice.’
Note 1: Individuals can consider exiting from the stock if the Target Price or Stop loss mentioned as per the technical analysis has been achieved and subject to the factors discussed above.
Note 2: How to Read the Charts?
The Green color line reflects the 21-period moving average, while the red color line indicates the 50-period moving average. SMA helps to identify existing price trend. If the prices are trading above the 21-period and 50-period moving average, then it shows prices are currently trading in a bullish trend.
The Black color line in the chart's lower segment reflects the Relative Strength Index (14-Period), which indicates price momentum and signals momentum in trend. A reading of 70 or above suggests overbought status, while a reading of 30 or below suggests an oversold status.
The Blue color bars in the chart's lower segment show the volume of the stock. The volume is the number of shares that changed hands during a given day. Stocks with high volumes are more liquid than stocks with lesser volume. Liquidity in stocks helps in easier and faster execution of the order.
The Orange color lines are the trend lines drawn by connecting two or more price points and used for trend identification purposes. The trend line also acts as a line of support and resistance.
Technical Indicators Defined: -
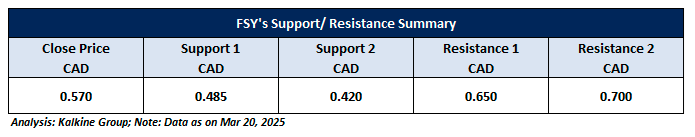
Support: A level at which the stock prices tend to find support if they are falling, and a downtrend may take a pause backed by demand or buying interest. Support 1 refers to the nearby support level for the stock and if the price breaches the level, then Support 2 may act as the crucial support level for the stock.
Resistance: A level at which the stock prices tend to find resistance when they are rising, and an uptrend may take a pause due to profit booking or selling interest. Resistance 1 refers to the nearby resistance level for the stock and if the price surpasses the level, then Resistance 2 may act as the crucial resistance level for the stock.
Stop-loss: In general, it is a level to protect further losses in case of unfavorable movement in the stock prices.
Risk Reward Ratio: The risk reward ratio is the difference between an entry point to a stop loss and profit level and the report is based on ~60% Stop Loss of the Target 1 from the entry point.
A trailing stop-loss is a modification of stop-loss in case of favorable movement in the price to protect the gains. Individual can Trail the Stop-Loss as per the levels if the stock price achieves more than 50% of the Target 1. Individual should consider exiting from the position as per the Trailing Stop-Loss level if the price starts moving downwards after achieving more than 50% of the Target 1.
The reference date for all price data, currency, technical indicators, support, and resistance levels is March 20, 2025. The reference data in this report has been partly sourced from REFINITIV.
Abbreviations
CMP: Current Market Price
SMA: Simple Moving Average
CAD: Canadian Dollar
RSI: Relative Strength Index
USD: United States dollar
Note: Trading decisions require a thorough analysis by individuals. Technical reports in general chart out metrics that may be assessed by individuals before any stock evaluation. The above are illustrative analytical factors used for evaluating the stocks; other parameters can be looked at along with additional risks per se. Past performance is neither an indicator nor a guarantee of future performance.
Kalkine Equities LLC, with Delaware File Number 4697384, Foreign Qualification Registration in California File Number 202109211078, and Texas File Number 805521396, is authorized to provide general advice only. The information on https://kalkine.com/ does not take into account any of your investment objectives, financial situation or needs. You should consider the appropriateness of advice taking into account your own objectives, financial situation and needs and seek independent financial advice before making any financial decisions. The link to our Terms and Conditions and Privacy Policy has been provided for your reference. On the date of publishing the reports (mentioned on the website), employees and/or associates of Kalkine do not hold positions in any of the stocks covered on the website. These stocks can change any time and readers of the reports should not consider these stocks as advice or recommendations later.
Past performance is not a reliable indicator of future performance.
 Please wait processing your request...