
Section1: Company Overview

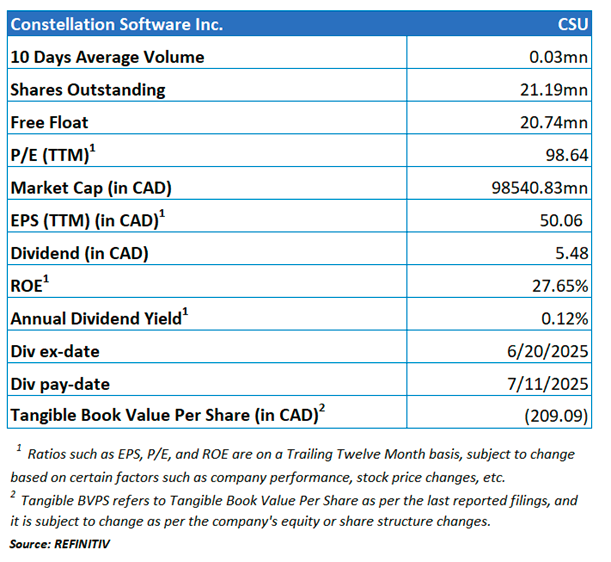
Constellation Software Inc. (TSX: CSU) is a Canada-based company that develops and customizes software for public- and private-sector markets. The firm acquires, manages, and builds vertical-specific businesses. Its operations are organized in two segments: Public Sector and Private Sector. The portfolio companies serve various markets including communications, credit unions, beverage distribution, tour operators, auto clubs, textiles and apparel, hospitality, and community care. The firm has operations in North America, Europe, Australia, South America, and Africa.
This Report covers the Investment Highlights, Key Financial Metrics, Risks, Technical Analysis along with the Valuation, Target Price, and Recommendation on the stock.

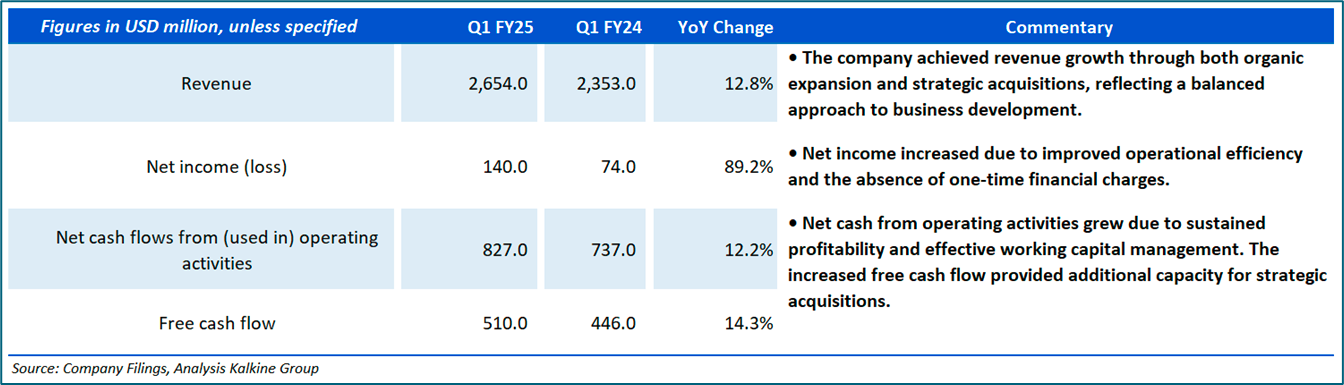
Section2: Financial Highlights – Q1 FY25

Section 3: Stock Recommendation Summary

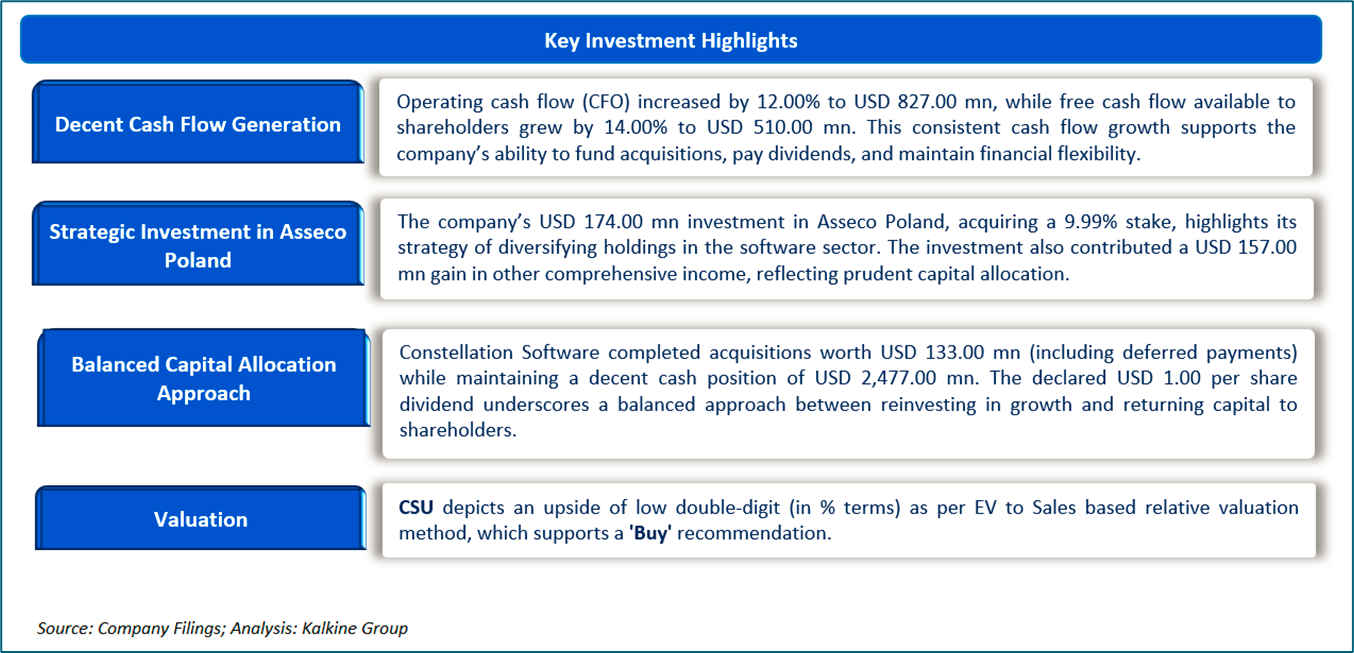
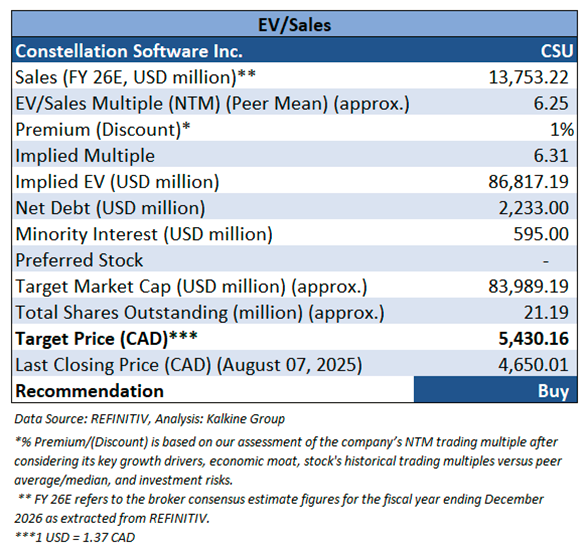
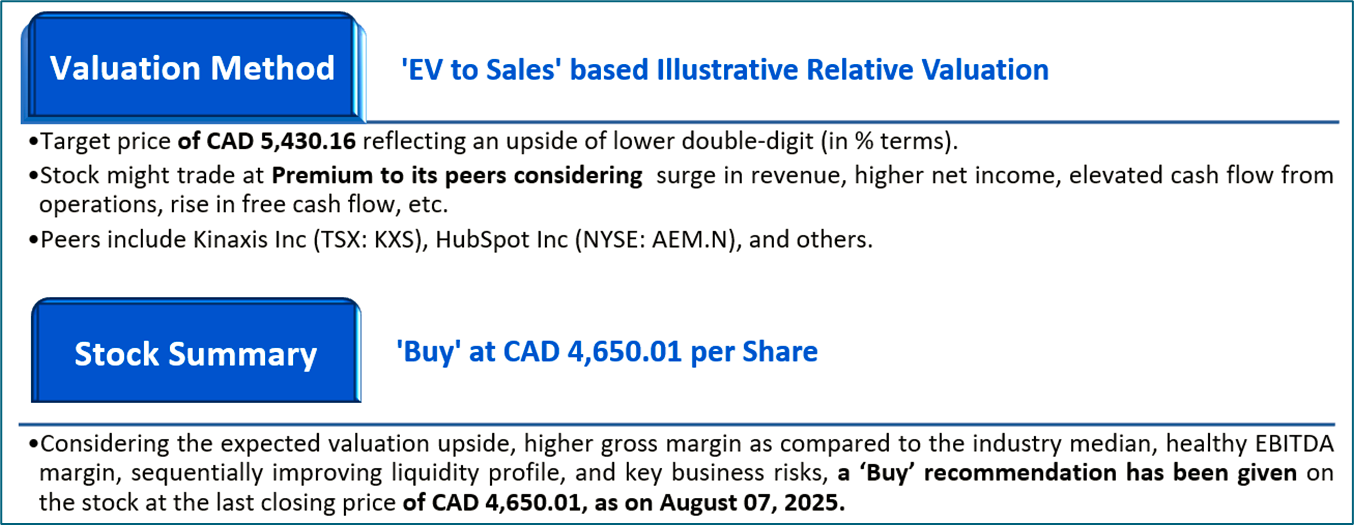
Valuation Methodology: EV/Sales Based Relative Valuation (Illustrative):


The stock has witnessed a downside of ~2.72% and of ~10.26% over the 1 week and 3 months respectively. It is trading above the average of 52-week high price of CAD 5,300.00 and 52-week low price of CAD 3,959.54, providing an opportunity to ride the trend.

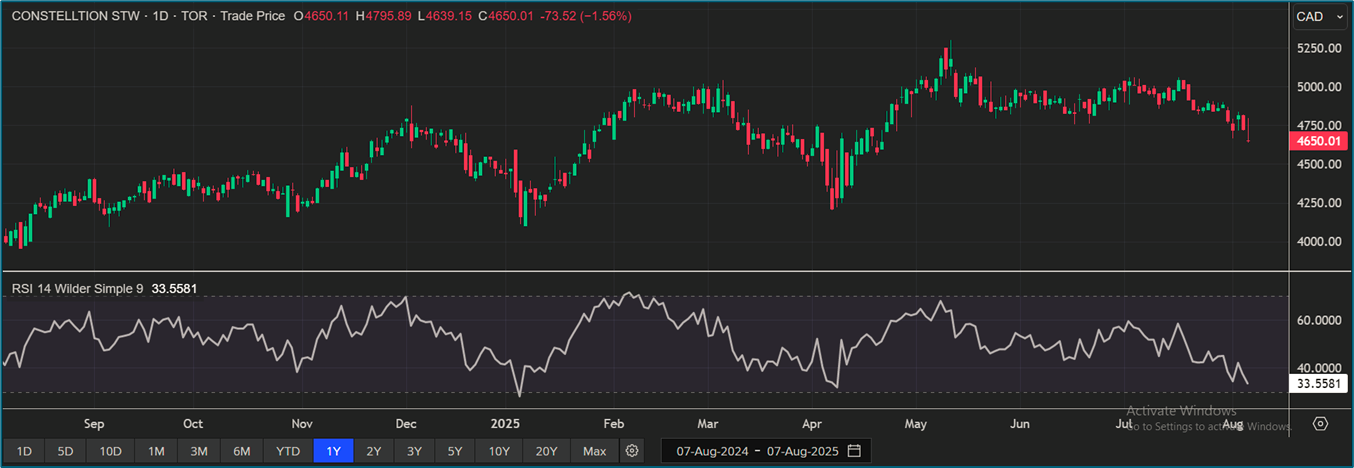
One-Year Technical Price Chart (as of August 07, 2025). Source: REFINITIV, Analysis: Kalkine Group

Note 1: Past performance is not a reliable indicator of future performance.
Note 2: The reference date for all price data, currency, technical indicators, support, and resistance levels as on August 07, 2025. The reference data in this report has been partly sourced from REFINITIV.
Note 3: Investment decisions should be made depending on an individual's appetite for upside potential, risks, holding duration, and any previous holdings. An 'Exit' from the stock can be considered if the Target Price mentioned as per the Valuation and or the technical levels provided has been achieved and is subject to the factors discussed above.
Note 4: Dividend Yield may vary as per the stock price movement.
Note 5: Kalkine reports are prepared based on the stock prices captured either from REFINITIV or Trading View. Typically, REFINITIV or Trading View may reflect stock prices with a delay which could be a lag of 25-30 minutes. There can be no assurance that future results or events will be consistent with the information provided in the report. The information is subject to change without any prior notice.
Technical Indicators Defined: -
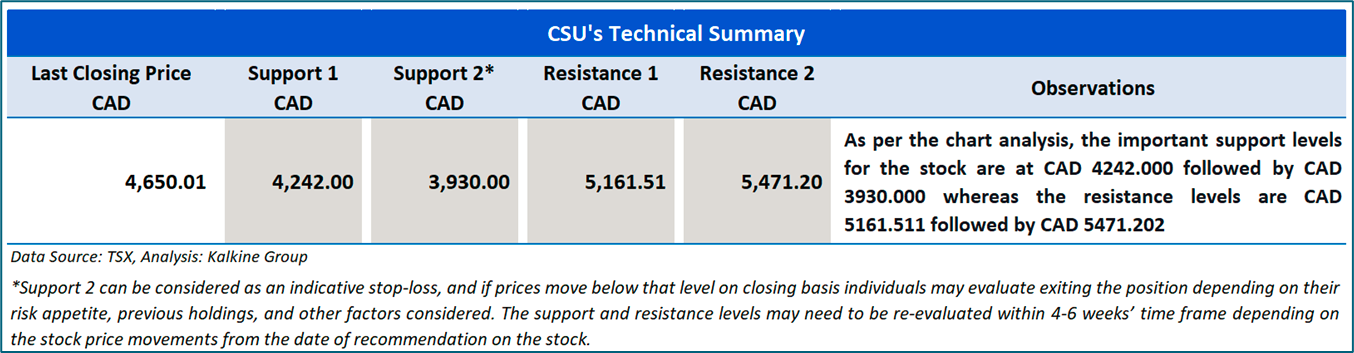
Support: A level at which the stock prices tend to find support if they are falling, and a downtrend may take a pause backed by demand or buying interest.
Resistance: A level at which the stock prices tend to find resistance when they are rising, and the uptrend may take a pause due to profit booking or selling interest.
Stop-loss: In general, it is a level to protect further losses in case of any unfavourable movement in the stock prices.
Kalkine Equities LLC, with Delaware File Number 4697384, Foreign Qualification Registration in California File Number 202109211078, and Texas File Number 805521396, is authorized to provide general advice only. The information on https://kalkine.com/ does not take into account any of your investment objectives, financial situation or needs. You should consider the appropriateness of advice taking into account your own objectives, financial situation and needs and seek independent financial advice before making any financial decisions. The link to our Terms and Conditions and Privacy Policy has been provided for your reference. On the date of publishing the reports (mentioned on the website), employees and/or associates of Kalkine do not hold positions in any of the stocks covered on the website. These stocks can change any time and readers of the reports should not consider these stocks as advice or recommendations later.
Past performance is not a reliable indicator of future performance.
 Please wait processing your request...