
Barrick Mining Corporation (NYSE: B) formerly Barrick Gold Corporation, is a gold and copper producer, which is engaged in the production and sale of gold and copper, as well as related activities, such as exploration and mine development.
Fundamental Observation:
Barrick Mining Corporation had a strong start to the financial year with Q1 performance meeting or exceeding targets. Notable achievements include successful projects at key sites like Pueblo Viejo and Fourmile, advancements in exploration, and progress in sustainability efforts. Financially, the company saw significant increases in cash flow, reduced debt, and positive earnings per share. Key growth projects such as Reko Diq and Lumwana are moving forward with engineering partnerships established. Additionally, Barrick demonstrated a commitment to sustainability with improvements in safety metrics and environmental compliance.
Recent Development – Gold Price
The rise in gold prices today is primarily driven by heightened geopolitical tensions due to the escalating Russia-Ukraine conflict and renewed trade disputes, particularly the U.S. decision to increase tariffs on steel and aluminum imports. These developments have increased market uncertainty and risk aversion, prompting investors to seek safe-haven assets like gold. Additionally, a weaker U.S. dollar has made gold more affordable for international buyers, further supporting demand. Anticipation of potential U.S. Federal Reserve policy easing amid concerns about economic growth and inflation also contributes to the upward pressure on gold prices.
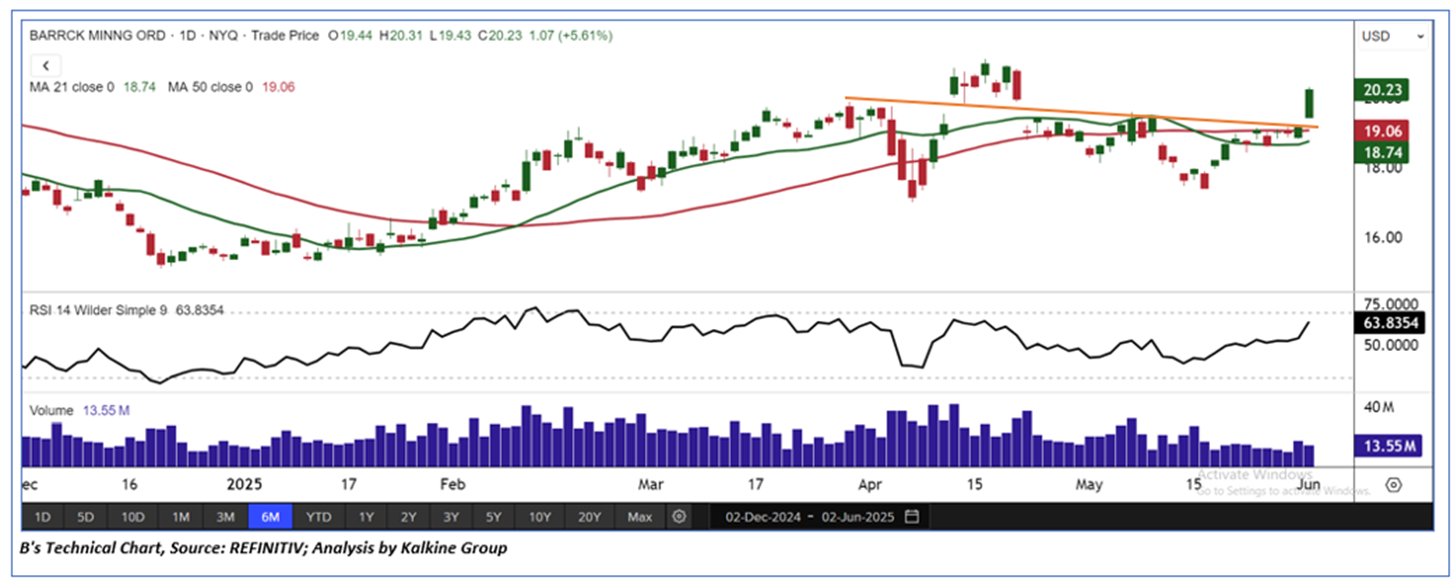
Technical Observation (on the daily chart):
B's stock price has broken above its trendline with strong volume, suggesting a potential upward movement in the near term. The 14-period RSI is trending higher, reinforcing the positive outlook. Additionally, the stock has regained its 50-day Simple Moving Average, which further supports a bullish bias. This moving average is likely to serve as a support level in the short term. Overall, the technical signals indicate a favorable setup for continued gains.
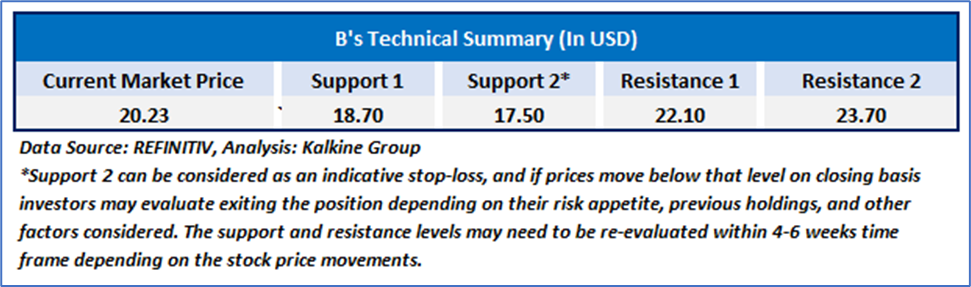
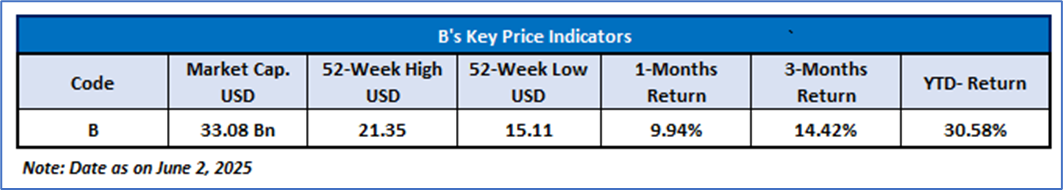
As per the above-mentioned price action, recent key business and financial updates, momentum in the stock over the last month, and technical indicators analysis, a ‘Buy’ rating has been given to Barrick Mining Corporation (NYSE: B) at its current market price of USD 20.23 as of June 2, 2025 (9:25 am PDT).
Individuals can evaluate the stock based on the support and resistance levels provided in the report in case of keen interest taking into consideration the risk-reward scenario.
Markets are trading in a highly volatile zone currently due to certain macro-economic issues and prevailing geopolitical tensions. Therefore, it is prudent to follow a cautious approach while investing.
Related Risk: This report may be looked at from a high-risk perspective and a recommendation is provided for a short duration. This report is solely based on technical parameters, and the fundamental performance of the stocks has not been considered in the decision-making process. Other factors which could impact the stock prices include market risks, regulatory risks, interest rates risks, currency risks, social and political instability risks etc.
How to Read the Charts?
The green colour line reflects the 21-period simple moving average (SMA) while the red line indicates the 50- period simple moving average (SMA). SMA helps to identify existing price trends. If the prices are trading above the 21-period and 50-period moving average, then it shows prices are currently trading in a bullish trend.
The black colour line in the chart’s lower segment reflects the Relative Strength Index (14-Period) which indicates price momentum and signals momentum in trend. A reading of 70 or above suggests overbought status while a reading of 30 or below suggests an oversold status.
The blue colour bars in the chart’s lower segment show the volume of the stock. The volume is the number of shares that changed hands during a given day. Stocks with high volumes are more liquid than stocks with lesser volume as liquidity in stocks helps with easier and faster execution of the order.
The Orange colour lines are the trend lines drawn by connecting two or more price points and used for trend identification purposes. The trend line also acts as a line of support and resistance.
Technical Indicators Defined: -
Support: A level at which the stock prices tend to find support if they are falling, and a downtrend may take a pause backed by demand or buying interest. Support 1 refers to the nearby support level for the stock and if the price breaches the level, then Support 2 may act as the crucial support level for the stock.
Resistance: A level at which the stock prices tend to find resistance when they are rising, and an uptrend may take a pause due to profit booking or selling interest. Resistance 1 refers to the nearby resistance level for the stock and if the price surpasses the level, then Resistance 2 may act as the crucial resistance level for the stock.
Stop-loss: It is a level to protect further losses in case of unfavourable movement in the stock prices.
Past performance is neither an indicator nor a guarantee of future performance.
The reference date for all price data, currency, technical indicators, support, and resistance levels is of June 2, 2025. The reference data in this report has been partly sourced from REFINITIV.
Abbreviations
CMP: Current Market Price
SMA: Simple Moving Average
RSI: Relative Strength Index
USD: United States dollar
Note: Trading decisions require a thorough analysis by individual. Technical reports in general chart out metrics that may be assessed by individuals before any stock evaluation. The above are illustrative analytical factors used for evaluating stocks; other parameters can be looked at along with additional risks per se. Past performance is neither an indicator nor a guarantee of future performance.
Kalkine Equities LLC, with Delaware File Number 4697384, Foreign Qualification Registration in California File Number 202109211078, and Texas File Number 805521396, is authorized to provide general advice only. The information on https://kalkine.com/ does not take into account any of your investment objectives, financial situation or needs. You should consider the appropriateness of advice taking into account your own objectives, financial situation and needs and seek independent financial advice before making any financial decisions. The link to our Terms and Conditions and Privacy Policy has been provided for your reference. On the date of publishing the reports (mentioned on the website), employees and/or associates of Kalkine do not hold positions in any of the stocks covered on the website. These stocks can change any time and readers of the reports should not consider these stocks as advice or recommendations later.
Past performance is not a reliable indicator of future performance.
 Please wait processing your request...