
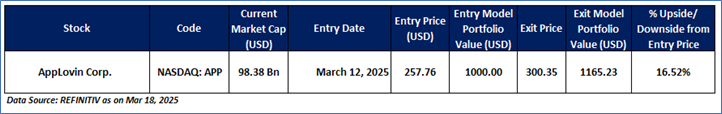
Exit Case: AppLovin Corp. (NASDAQ: APP)
AppLovin Corp. (NASDAQ: APP) engages in the development and operation of a mobile marketing platform. It uses technology to provide access to the financial system. APP has been a part of the 'Momentum Model Portfolio' since March 12, 2025. Therefore, an 'Exit' stance from the Momentum Model Portfolio is recommended on the stock at the current market price of USD 300.35 as on March 18, 2025 (6:35 am PDT) as target achieved.
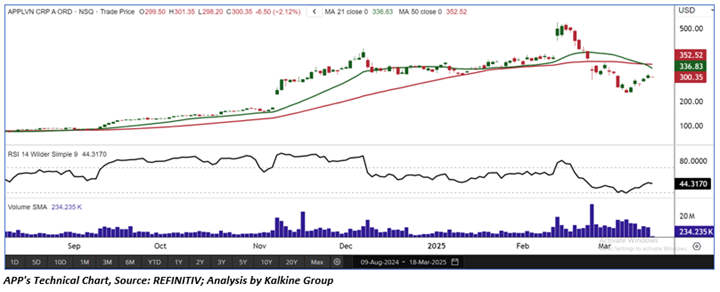
APP’s Daily Chart
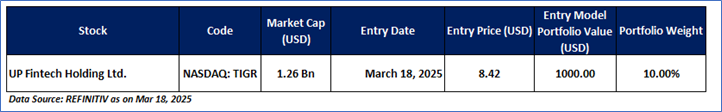
New Entry Case: UP Fintech Holding Ltd. (NASDAQ: TIGR)
Overview: UP Fintech Holding Ltd. (NASDAQ: TIGR) is an online brokerage firm that focuses on global investors. It provides an online trading platform that enables investors to trade in equities and other financial instruments on multiple exchanges around the world.
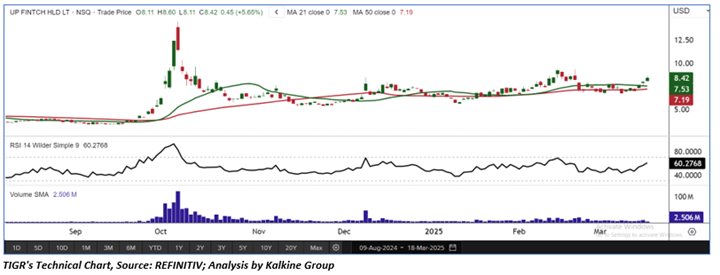
Technical Analysis: On the daily chart, TIGR’s price took support at key levels and drifted higher, suggesting a potential upward reversal in the near term. The 14-period RSI has also shifted from lower levels and is moving below its midpoint. As the company continues to display resilience and stability, the chances of a sustained uptrend improve, with the possibility of retesting previous highs. TIGR seems well-positioned to leverage its momentum and drive gains in the near future.
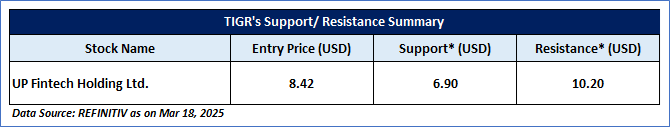
TIGR is recommended as a new entry in the 'Momentum Model Portfolio' as on March 18, 2025. Considering the technical analysis, support and resistance levels, an 'Entry' is recommended in the 'Momentum Model Portfolio' at the Current market price of USD 8.42 as on March 18, 2025 (6:35 am PDT).
TIGR’s Daily Chart
Support and Resistance Summary
Note 1: Past performance is neither an Indicator nor a guarantee of future performance.
Note 2: The reference date for all price data, and currency as of March 18, 2025. The reference data in this report has been partly sourced from REFINITIV.
Note 3: Investment decisions should be made depending on an individual's appetite for upside potential, risks, holding duration, and any previous holdings.
Disclaimer
This information should not be relied upon as personal financial advice by Kalkine on (i) the stocks or (ii) the use or suitability of the model portfolios. Only an investor knows about their circumstances to make an investment decision.
Model Portfolio has been prepared for illustrative purpose only and does not take into account the objectives, financial situation or needs of any particular investor. Accordingly, investors should, before acting on the information, consider its appropriateness, having regard to their objectives, financial situation and needs. Past performance is not necessarily indicative of future performance results. Actual investment returns will vary, and the value of investments can go up or down.
Kalkine Equities LLC, with Delaware File Number 4697384, Foreign Qualification Registration in California File Number 202109211078, and Texas File Number 805521396, is authorized to provide general advice only. The information on https://kalkine.com/ does not take into account any of your investment objectives, financial situation or needs. You should consider the appropriateness of advice taking into account your own objectives, financial situation and needs and seek independent financial advice before making any financial decisions. The link to our Terms and Conditions and Privacy Policy has been provided for your reference. On the date of publishing the reports (mentioned on the website), employees and/or associates of Kalkine do not hold positions in any of the stocks covered on the website. These stocks can change any time and readers of the reports should not consider these stocks as advice or recommendations later.
Past performance is not a reliable indicator of future performance.
 Please wait processing your request...