
CoreWeave, Inc.
CoreWeave, Inc. (NASDAQ: CRWV) is a cloud infrastructure firm that provides the CoreWeave Cloud Platform, a suite of software and cloud-based services designed to automate and optimize the management of complex artificial intelligence (AI) computing environments.
Key Business Updates (for Q3FY25)
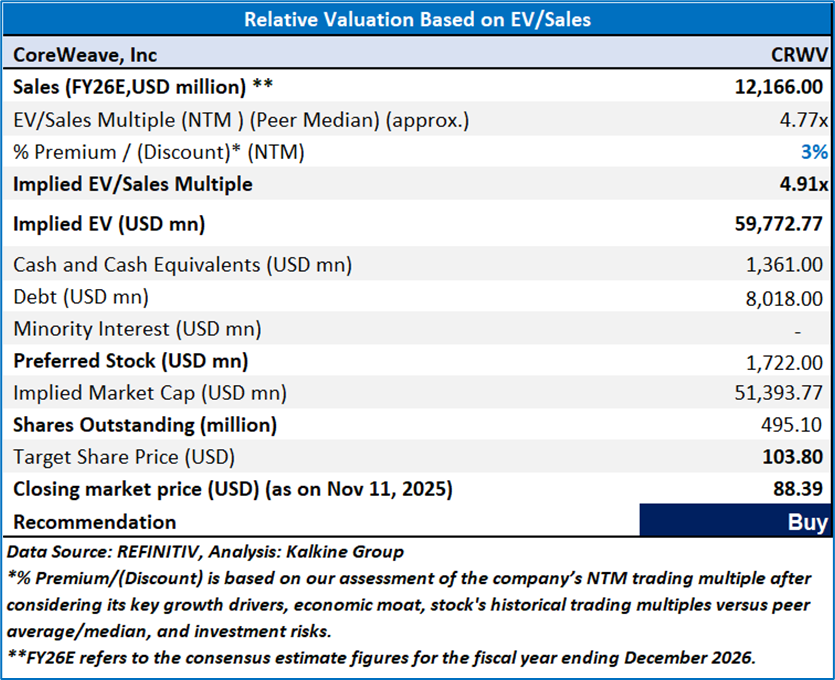
Valuation Methodology (using EV/Sales multiple)
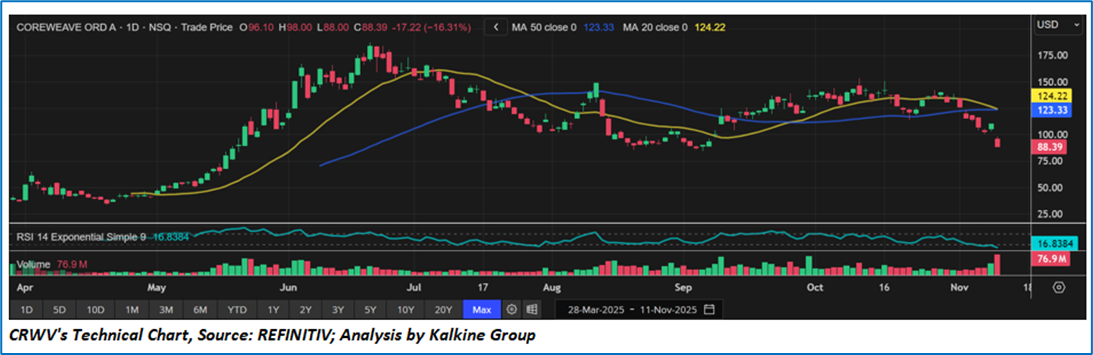
Technical Observation (on the daily chart)
The stock has experienced a sharp decline, closing at USD 88.39, down 16.31% on high volume. This marks a clear breakdown from the previous consolidation range near USD 120–USD 130, confirming a strong bearish momentum. The recent sell-off also pushed the stock below both its 50-day (around USD 124.22) and 20-day moving averages (around USD 123.33), reinforcing the ongoing downtrend.
Both the 20-day and 50-day moving averages have turned downward, indicating a negative crossover and suggesting continued short-term weakness. The price trading significantly below these averages shows bearish dominance and a lack of immediate support from institutional buyers. A decisive break above these moving averages could confirm a bullish reversal and attract additional momentum buyers.
The RSI (14) stands at approximately 16.83, placing the stock deeply in the oversold zone. This suggests that the current downside move may be overextended and that a technical rebound or short-term relief rally could occur if selling pressure eases.
Trading volume has spiked to 76.9 million, notably higher than average daily activity. Such heavy volume during a steep decline signals capitulation selling
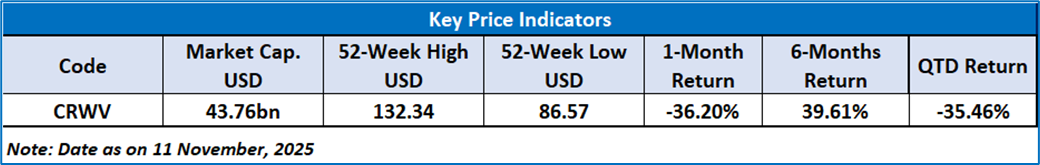
As per the above-mentioned price action, recent key business and financial updates, momentum in the stock over the last month, and technical indicators analysis, a ‘Buy’ rating has been given to CoreWeave, Inc (NASDAQ: CRWV) at its closing market price of USD 88.39 as of November 11, 2025.
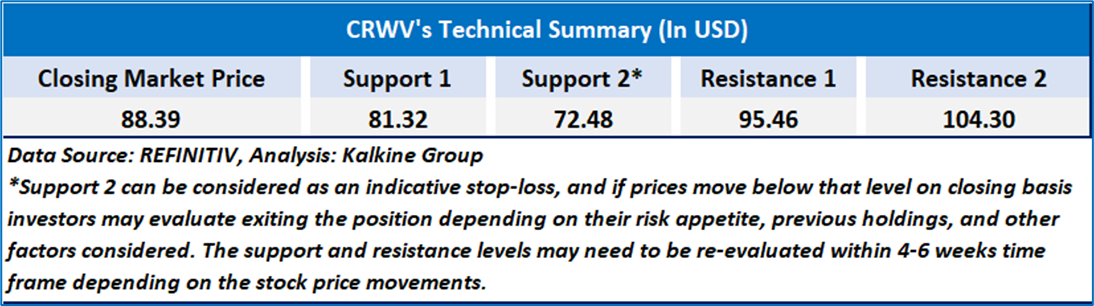
Individuals can evaluate the stock based on the support and resistance levels provided in the report in case of keen interest taking into consideration the risk-reward scenario.
Markets are trading in a highly volatile zone currently due to certain macro-economic issues and prevailing geopolitical tensions. Therefore, it is prudent to follow a cautious approach while investing.
Related Risk: This report may be looked at from a high-risk perspective and a recommendation is provided for a short duration. This report is solely based on technical parameters, and the fundamental performance of the stocks has not been considered in the decision-making process. Other factors which could impact the stock prices include market risks, regulatory risks, interest rates risks, currency risks, social and political instability risks etc.
How to Read the Charts?
The green colour line reflects the 21-period simple moving average (SMA) while the red line indicates the 50- period simple moving average (SMA). SMA helps to identify existing price trends. If the prices are trading above the 21-period and 50-period moving average, then it shows prices are currently trading in a bullish trend.
The black colour line in the chart’s lower segment reflects the Relative Strength Index (14-Period) which indicates price momentum and signals momentum in trend. A reading of 70 or above suggests overbought status while a reading of 30 or below suggests an oversold status.
The blue colour bars in the chart’s lower segment show the volume of the stock. The volume is the number of shares that changed hands during a given day. Stocks with high volumes are more liquid than stocks with lesser volume as liquidity in stocks helps with easier and faster execution of the order.
The Orange colour lines are the trend lines drawn by connecting two or more price points and used for trend identification purposes. The trend line also acts as a line of support and resistance.
Technical Indicators Defined: -
Support: A level at which the stock prices tend to find support if they are falling, and a downtrend may take a pause backed by demand or buying interest. Support 1 refers to the nearby support level for the stock and if the price breaches the level, then Support 2 may act as the crucial support level for the stock.
Resistance: A level at which the stock prices tend to find resistance when they are rising, and an uptrend may take a pause due to profit booking or selling interest. Resistance 1 refers to the nearby resistance level for the stock and if the price surpasses the level, then Resistance 2 may act as the crucial resistance level for the stock.
Stop-loss: It is a level to protect further losses in case of unfavourable movement in the stock prices.
Past performance is neither an indicator nor a guarantee of future performance.
The reference date for all price data, currency, technical indicators, support, and resistance levels is of November 11, 2025. The reference data in this report has been partly sourced from REFINITIV.
Abbreviations
CMP: Current Market Price
SMA: Simple Moving Average
RSI: Relative Strength Index
USD: United States dollar
Note: Trading decisions require a thorough analysis by individual. Technical reports in general chart out metrics that may be assessed by individuals before any stock evaluation. The above are illustrative analytical factors used for evaluating stocks; other parameters can be looked at along with additional risks per se. Past performance is neither an indicator nor a guarantee of future performance.
Kalkine Equities LLC, with Delaware File Number 4697384, Foreign Qualification Registration in California File Number 202109211078, and Texas File Number 805521396, is authorized to provide general advice only. The information on https://kalkine.com/ does not take into account any of your investment objectives, financial situation or needs. You should consider the appropriateness of advice taking into account your own objectives, financial situation and needs and seek independent financial advice before making any financial decisions. The link to our Terms and Conditions and Privacy Policy has been provided for your reference. On the date of publishing the reports (mentioned on the website), employees and/or associates of Kalkine do not hold positions in any of the stocks covered on the website. These stocks can change any time and readers of the reports should not consider these stocks as advice or recommendations later.
Past performance is not a reliable indicator of future performance.
 Please wait processing your request...