
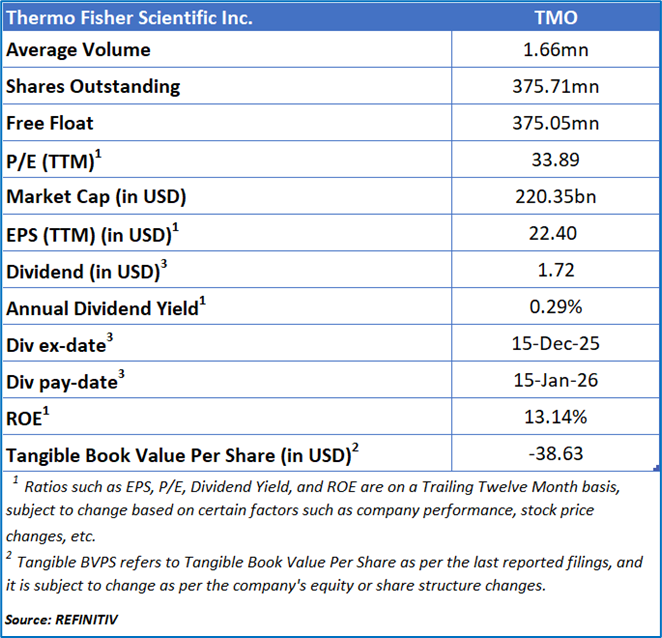
Thermo Fisher Scientific Inc.
Thermo Fisher Scientific Inc. (NYSE: TMO) is dedicated to driving progress in life sciences research, solving complex analytical challenges, improving laboratory productivity, and advancing patient care through innovative diagnostics and the development and manufacturing of groundbreaking therapies.
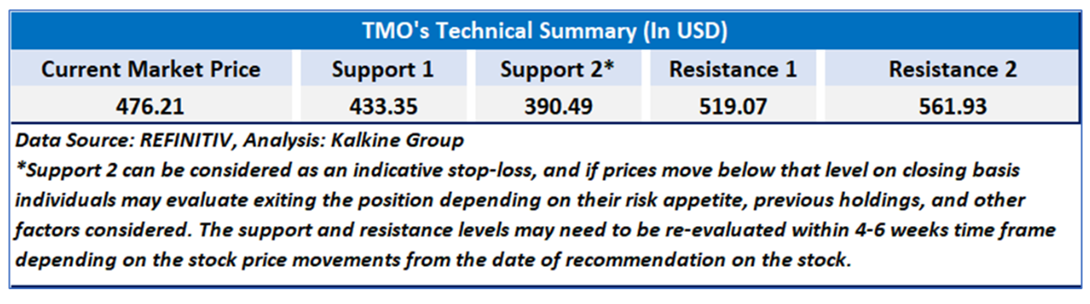
As per previous Kalkine’s Low Carbon Research Report published on ‘TMO’ on Jul 25, 2025, Kalkine provided an ‘Buy’ stance on the stock at USD 476.21 based on fundamental analysis and the stock price has now moved up by ~ 23.73% since then.
Noted below are the details of support and resistance levels provided in our previous report:
Rationale:
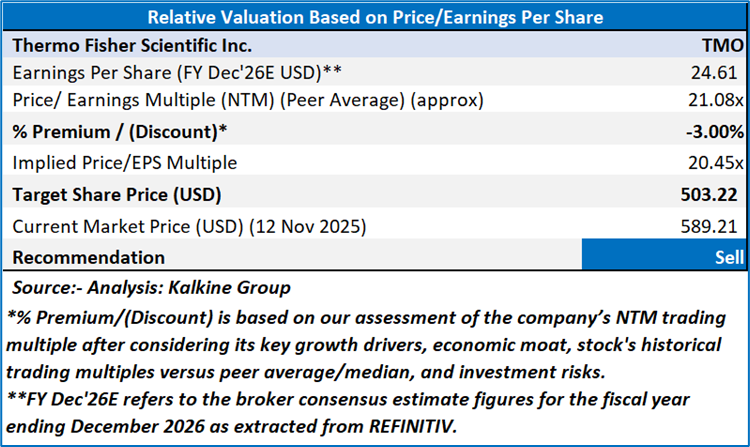
Valuation (Using Price/Earnings per share Multiple)
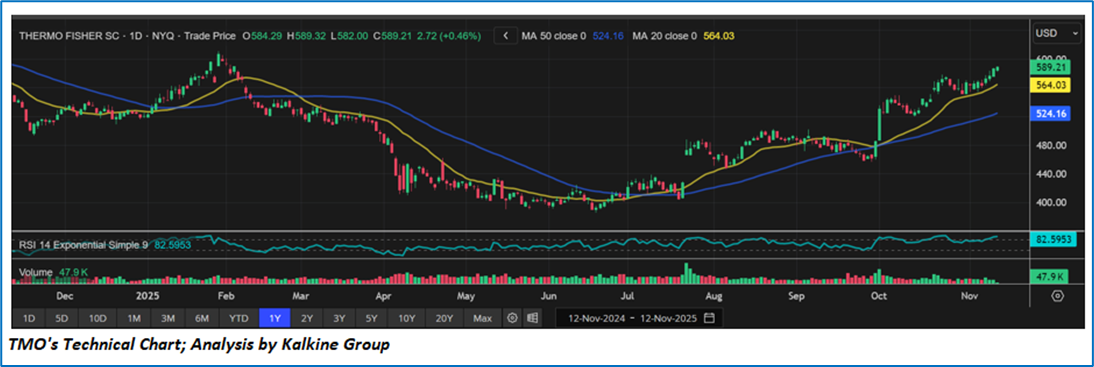
Share Price Chart
Conclusion
Thermo Fisher Scientific’s third-quarter performance, while operationally solid, reveals underlying challenges that temper its growth outlook. The slowdown in organic revenue growth to 3% indicates softer core demand, while only marginal improvement in GAAP margins and earnings highlights persistent cost pressures and limited profitability expansion. The company’s reliance on acquisitions to sustain growth raises integration and execution risks, and the widening gap between GAAP and adjusted results suggests that part of the earnings momentum is non-recurring. Moreover, increased capital deployment toward acquisitions and share repurchases heightens financial exposure, signaling potential pressure on future cash flows and returns.
Based on the notional gains, valuation downside and price action stance, a "Sell" recommendation on Thermo Fisher Scientific Inc. (NYSE: TMO) has been given at the current market price of USD 589.21 as on 12 November 2025 at 9:20 am PST.
Note 1: Past performance is not a reliable indicator of future performance.
Note 2: The reference date for all price data, currency, technical indicators, support, and resistance level is 12 November 2025. The reference data in this report has been partly sourced from REFINITIV.
Note 3: Investment decisions should be made depending on an individual's appetite for upside potential, risks, holding duration, and any previous holdings. An 'Exit' from the stock can be considered if the Target Price mentioned as per the Valuation and or the technical levels provided has been achieved and is subject to the factors discussed above.
Note 4: Target Price refers to a price level which the stock is expected to reach as per the relative valuation method and/or technical analysis taking into consideration both short-term and long-term scenario.
Note 5: ‘Kalkine reports are prepared based on the stock prices captured either from the London Stock Exchange (LSE) and or REFINITIV. Typically, both sources (LSE and or REFINITIV) may reflect stock prices with a delay which could be a lag of 15-20 minutes. There can be no assurance that future results or events will be consistent with the information provided in the report. The information is subject to change without any prior notice.’
Note 6: Dividend Yield may vary as per the stock price movement.
Kalkine Equities LLC, with Delaware File Number 4697384, Foreign Qualification Registration in California File Number 202109211078, and Texas File Number 805521396, is authorized to provide general advice only. The information on https://kalkine.com/ does not take into account any of your investment objectives, financial situation or needs. You should consider the appropriateness of advice taking into account your own objectives, financial situation and needs and seek independent financial advice before making any financial decisions. The link to our Terms and Conditions and Privacy Policy has been provided for your reference. On the date of publishing the reports (mentioned on the website), employees and/or associates of Kalkine do not hold positions in any of the stocks covered on the website. These stocks can change any time and readers of the reports should not consider these stocks as advice or recommendations later.
Past performance is not a reliable indicator of future performance.
 Please wait processing your request...