
 CA
 NZ
 UK
 AU
 IND

 US

Company Overview: Azad Engineering Limited (NSE: AZAD) manufactures and sells precision-engineered components in India and internationally. The company offers aerospace, including airfoils/blades for aircraft engines and APUs, body valve, housing mount, housing compressor, fan blisk, mixed flow impeller, housing fan, shell and housing, air frames, aero structure, turbine wheel, nozzle, unison ring, lever arm, hydraulic, fuel inerting, flight control, actuating system, and other products, as well as aerospace standard fluid distribution parts. This Report covers the Price Action, Technical Indicators Analysis along with the Support Levels, Resistance Levels, and Recommendations on this stock.
AZAD’s Technical Analysis:
On the daily chart, Azad Engineering Limited (NSE: AZAD) is trading near INR 2,151 and continues to hold above its 50-day SMA around INR 1,764.96, reflecting a positive near-term structure. The stock recently witnessed a sharp upward move and is now consolidating near higher levels, indicating some moderation in momentum after the rally. The 14-day RSI has eased toward 62 after moving into elevated territory earlier, suggesting momentum remains positive but with scope for short-term consolidation. Immediate support is placed around INR 2,050–1,930, while resistance is seen near INR 2,250–2,375. A sustained move above the resistance zone could support further upside in the sessions ahead.

Daily Technical Chart – AZAD
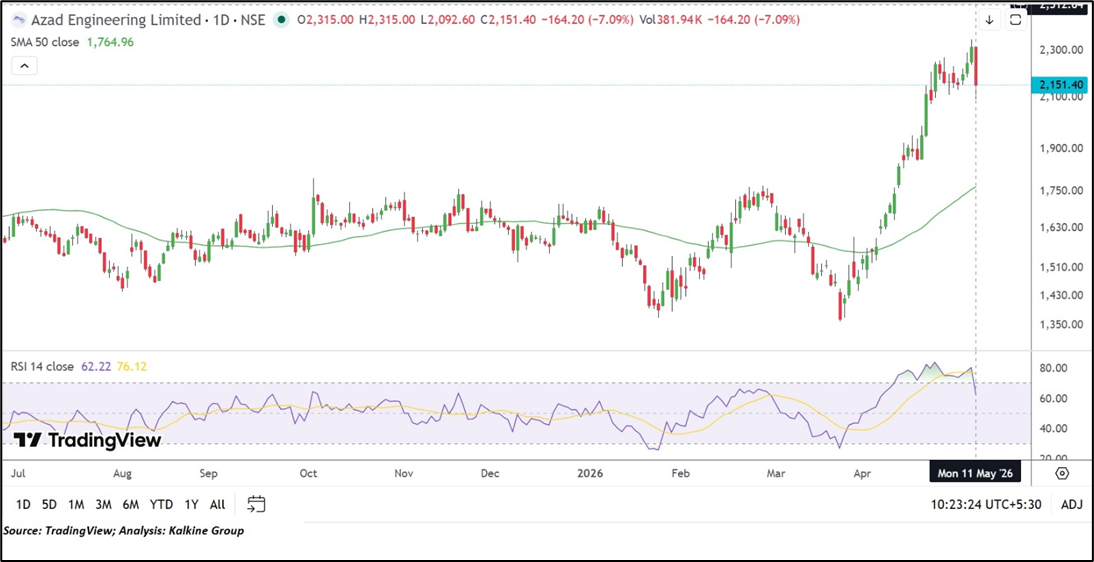
Considering the stock’s current price levels forming higher peaks and higher troughs, and momentum oscillator analysis, a “Watch” recommendation is given on the stock. The stock was analysed as per the current market price of INR 2151.40 per share as on May 11, 2026, at 10:23 AM GMT+5, down by 7.09%.
Note 1: Past performance is neither an Indicator nor a guarantee of future performance.
Note 2: Investment decision should be made depending on an individual’s appetite for upside potential, risks, and any previous holdings. This recommendation is purely based on technical analysis, and fundamental analysis has not been considered in this report.
Note 3: Related Risks: This report may be looked at from high-risk perspective and recommendations are provided are for a short duration. Recommendations provided in this report are solely based on technical parameters, and the fundamental performance of the stocks has not been considered in the decision-making process. Other factors which could impact the stock prices include market risks, regulatory risks, interest rates risks, currency risks, social and political instability risks etc.
Key Risks: Technical indicators are backward-looking and may generate false or lagged signals, particularly during volatile or changing market conditions. Price trends may also be disrupted by fundamental, macroeconomic, or company-specific developments not captured in charts.
The reference date for all price data, currency, technical indicators, support, and resistance levels is May 11, 2026. The reference data in this report has been partly sourced from REFINITIV/TradingView.
Technical Indicators Defined:
Support: A level at which the stock prices tend to find support if they are falling, and a downtrend may take a pause backed by demand or buying interest. Support 1 refers to the nearby support level for the stock and if the price breaches the level, then Support 2 may act as the crucial support level for the stock.
Resistance: A level at which the stock prices tend to find resistance when they are rising, and an uptrend may take a pause due to profit booking or selling interest. Resistance 1 refers to the nearby resistance level for the stock and if the price surpasses the level, then Resistance 2 may act as the crucial resistance level for the stock.
Stop-loss: It is a level to protect further losses in case of unfavourable movement in the stock prices.
The Green colour line reflects the 21-period moving average. SMA helps to identify existing price trends. If the prices are trading above the 21-period, prices are currently in a bullish trend (Vice – Versa).
The Blue colour line reflects the 50-period moving average. SMA helps to identify existing price trends. If the prices are trading above the 50-period, prices are currently in a bullish trend (Vice – Versa).
The Orange/ Yellow colour line represents the Trendline.
The Purple colour line in the chart’s lower segment reflects the Relative Strength Index (14-Period), which indicates price momentum and signals momentum in trend. A reading of 70 or above suggests overbought status, while a reading of 30 or below suggests an oversold status.
Kalkine Equities LLC, with Delaware File Number 4697384, Foreign Qualification Registration in California File Number 202109211078, and Texas File Number 805521396, is authorized to provide general advice only. The information on https://kalkine.com/ does not take into account any of your investment objectives, financial situation or needs. You should consider the appropriateness of advice taking into account your own objectives, financial situation and needs and seek independent financial advice before making any financial decisions. The link to our Terms and Conditions and Privacy Policy has been provided for your reference. On the date of publishing the reports (mentioned on the website), employees and/or associates of Kalkine do not hold positions in any of the stocks covered on the website. These stocks can change any time and readers of the reports should not consider these stocks as advice or recommendations later.
Past performance is not a reliable indicator of future performance.
 Please wait processing your request...