
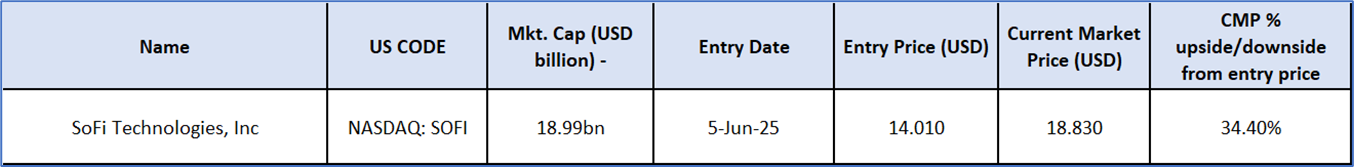
Exit Case: SoFi Technologies, Inc. (NASDAQ: SOFI)
Overview: SoFi Technologies, Inc. (NASDAQ: SOFI) is a financial services provider that helps its members handle various aspects of their financial lives, offering products for borrowing, saving, spending, investing, and insurance. The company operates through three core segments: Lending, Technology Platform, and Financial Services.
SOFI has been a part of the ‘Value Model Porftolio’ since 05 June 2025. Therefore, an 'Exit' stance from the Value Model Portfolio is recommended on the stock at the current market price of USD 18.83 as on June 30, 2025 (9:20 am PDT).
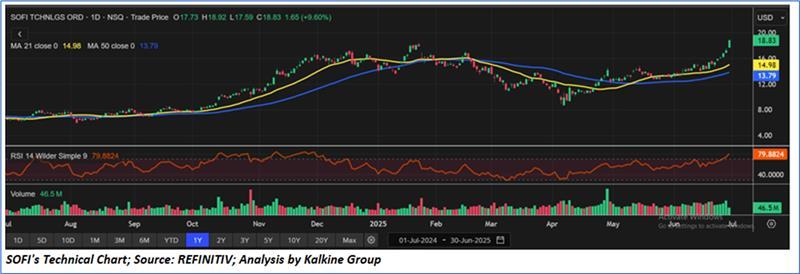
SOFI’s Daily Chart
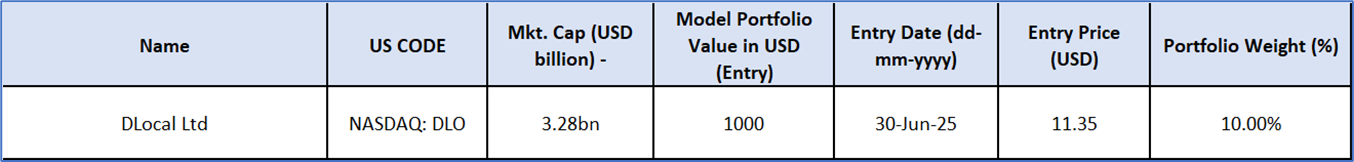
New Entry Case: DLocal Ltd (NASDAQ: DLO)
Overview: DLocal Ltd (NASDAQ: DLO) headquartered in Uruguay, specializes in helping global merchants engage with consumers in emerging markets. The company provides a payment platform designed specifically to facilitate transactions in these regions.
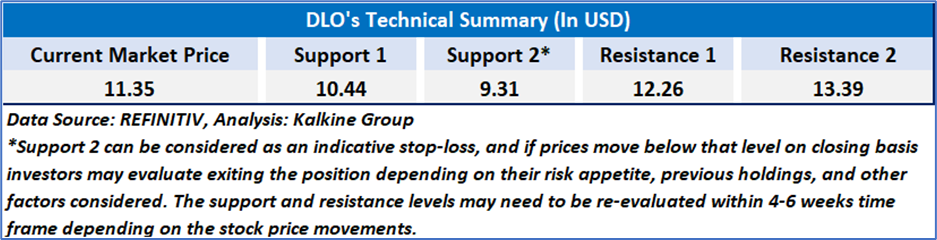
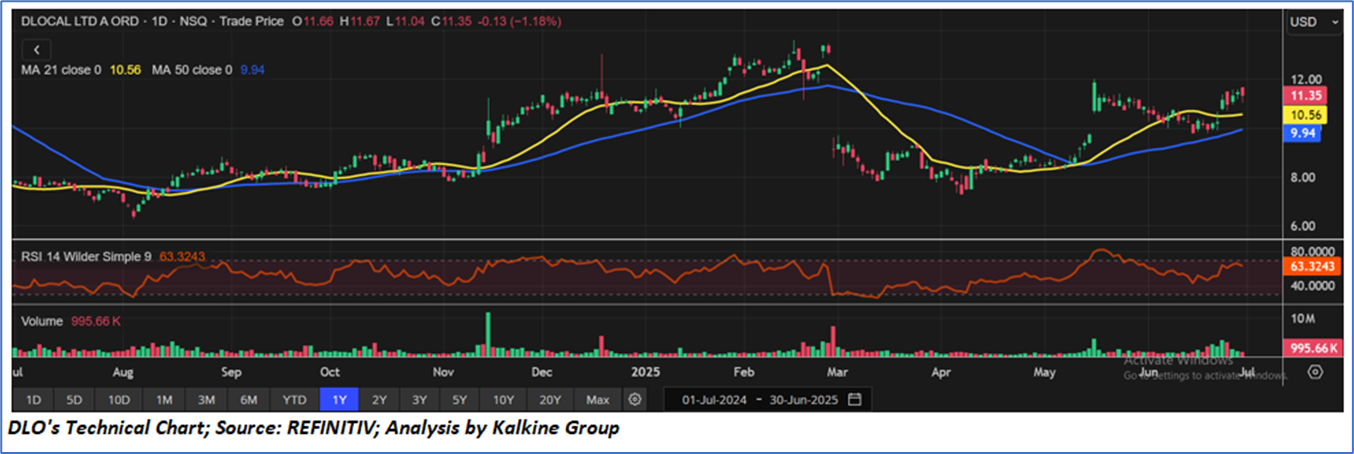
Technical Analysis: DLocal Ltd. stock price found support at its key levels and gradually moved higher, indicating the potential for near-term upside. Additionally, both the 21-day and 50-day moving averages are positioned below the current price, reinforcing a positive bias. The 14-period RSI remains above the midpoint, further signaling buying momentum and supporting an optimistic outlook.
Considering the above mentioned factors, technical analysis, support & resistance levels, key risks and outlook an ‘Entry’ is recommended in the ‘Value Model Portfolio’ at the current market price of USD 11.35, as on 30 June 2025 at 9:20 am PDT.
Support and Resistance Summary
One Year Technical Price Chart (NASDAQ: DLO)
Note 1: Past performance is neither an Indicator nor a guarantee of future performance.
Note 2: The reference date for all price data, and currency as of 30 June 2025. The reference data in this report has been partly sourced from REFINITIV.
Note 3: Investment decisions should be made depending on an individual's appetite for upside potential, risks, holding duration, and any previous holdings.
Disclaimer
This information should not be relied upon as personal financial advice by Kalkine on (i) the stocks or (ii) the use or suitability of the model portfolios. Only an investor knows about their circumstances to make an investment decision.
Model Portfolio has been prepared for illustrative purpose only and does not consider the objectives, financial situation or needs of any investor. Accordingly, investors should, before acting on the information, consider its appropriateness, having regard to their objectives, financial situation and needs. Past performance is not necessarily indicative of future performance results. Actual investment returns will vary, and the value of investments can go up or down.
Kalkine Equities LLC, with Delaware File Number 4697384, Foreign Qualification Registration in California File Number 202109211078, and Texas File Number 805521396, is authorized to provide general advice only. The information on https://kalkine.com/ does not take into account any of your investment objectives, financial situation or needs. You should consider the appropriateness of advice taking into account your own objectives, financial situation and needs and seek independent financial advice before making any financial decisions. The link to our Terms and Conditions and Privacy Policy has been provided for your reference. On the date of publishing the reports (mentioned on the website), employees and/or associates of Kalkine do not hold positions in any of the stocks covered on the website. These stocks can change any time and readers of the reports should not consider these stocks as advice or recommendations later.
Past performance is not a reliable indicator of future performance.
 Please wait processing your request...