 CA
 NZ
 UK
 AU
 IND

 US


…
PowerFleet, Inc. provides artificial intelligence-of-things (AIoT) solutions in North America, Israel, Africa, Europe, the Middle East, Australia, and internationally. Its unity solution portfolio includes unity platform that enables integration with AIoT devices and third-party business systems to a data highway that powers artificial intelligence-driven insights to help customers save lives, time, and money; software as a service based unity modules, which comprises vehicle, video, and in-warehouse IoT for customers to gain visibility and AI-powered insights into their people, assets, and business processes to manage utilization and maintenance, safety, fuel and energy management, and compliance and high-risk incidents; and open application programming interfaces for additional integrations and development to enhance other enterprise management systems and third-party applications. The company also provides hosting, maintenance, and customer support and consulting services; and software as a service, such as system monitoring, help desk technical support, escalation procedure development, routine diagnostic data analysis, and software update services. The company offers its products under the Powerfleet, Pointer, Cellocator, MiX by Powerfleet, and Fleet Complete brands. It markets and sells its wireless solutions to a range of customers in the commercial and government sectors, including construction and heavy equipment, distribution, field services, leasing and car rental, government and public safety, manufacturing and automotive, oil and gas, chemical, transportation and logistics, utilities and telecommunications, and cold chain logistics. The company was formerly known as I.D. Systems, Inc. and changed its name to PowerFleet, Inc. in October 2019. PowerFleet, Inc. was incorporated in 1993 and is headquartered in Woodcliff Lake, New Jersey.
Source: TradingView
The charts and visual representations are sourced from TradingView through embedded widgets. For any issues with chart display, please visit the TradingView website
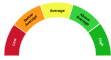
A unique technical analysis driven score developed by Kalkine showing momentum in stock prices based on select technical indicators identified.
PowerFleet, Inc. provides IoT hardware and cloud-based telematics and asset-management services for vehicle fleets, industrial equipment and trailers, offering tracking, diagnostics and connectivity solutions. Long-term growth may be supported by broader fleet digitalization, regulatory and safety monitoring requirements, and rising demand for subscription-based telematics that could generate recurring revenue and scale advantages. Investors may find the company attractive for its software-led recurring revenue model and multi-vertical addressable market potential.
Material risks include strong competition from larger telematics and connectivity providers, execution risk in hardware deployment and software adoption, customer concentration and sensitivity to cyclical fleet capital spending.

Note: The summary and risk score provided above is created by AI and should not be construed as a recommendation of Kalkine.


| Breakdown | 2024-12-31 | 2023-12-31 | 2022-12-31 | 2021-12-31 | 2020-12-31 |
|---|---|---|---|---|---|
| Type | yearly | yearly | yearly | yearly | yearly |
| Date | 2024-12-31 | 2023-12-31 | 2022-12-31 | 2021-12-31 | 2020-12-31 |
| Income before tax | -46.45M | -32.61M | -5.88M | -10.69M | -7.97M |
| Minority interest | -0.02M | -0.04M | -0.00M | 0.01M | 0.00M |
| Net income | -50.99M | -34.06M | -6.75M | -13.29M | -9.01M |
| Selling general administrative | 204.36M | 71.25M | 63.49M | 56.50M | 51.88M |
| Gross profit | 194.54M | 67.08M | 64.99M | 60.18M | 59.02M |
| Reconciled depreciation | 47.49M | 9.45M | 8.26M | 8.55M | 8.43M |
| Ebit | 15.04M | -3.45M | -9.73M | -10.98M | -6.34M |
| Ebitda | 56.80M | 6.00M | 1.29M | 0.43M | 4.92M |
| Depreciation and amortization | 41.76M | 9.45M | 11.02M | 11.41M | 11.26M |
| Operating income | -25.89M | -12.56M | -6.12M | -7.85M | -3.61M |
| Other operating expenses | 388.40M | 146.29M | 142.04M | 134.06M | 117.20M |
| Interest expense | 20.33M | 1.60M | - | 2.76M | 4.47M |
| Tax provision | 4.52M | 0.59M | 0.87M | 1.89M | 1.04M |
| Interest income | 0.93M | 0.10M | 1.06M | 0.04M | 0.06M |
| Net interest income | -19.40M | -1.50M | 1.06M | -2.72M | -4.41M |
| Income tax expense | 4.52M | 1.41M | 0.87M | 2.61M | 1.04M |
| Total revenue | 362.51M | 133.74M | 135.91M | 126.21M | 113.59M |
| Total operating expenses | 220.42M | 79.63M | 71.12M | 68.03M | 62.62M |
| Cost of revenue | 167.98M | 66.66M | 70.92M | 66.03M | 54.58M |
| Total other income expense net | -20.57M | -20.05M | 1.09M | -2.51M | -4.51M |
| Net income from continuing ops | -50.97M | -5.64M | -6.75M | -12.77M | -9.01M |
| Breakdown | 2024-12-31 | 2023-12-31 | 2022-12-31 | 2021-12-31 | 2020-12-31 |
|---|---|---|---|---|---|
| Type | yearly | yearly | yearly | yearly | yearly |
| Date | 2024-12-31 | 2023-12-31 | 2022-12-31 | 2021-12-31 | 2020-12-31 |
| Total assets | 910.07M | 308.68M | 218.06M | 229.87M | 219.56M |
| Intangible assets | 258.58M | 19.65M | 22.91M | 26.12M | 31.28M |
| Other current assets | 23.32M | 91.18M | 5.32M | 7.14M | 4.72M |
| Total liab | 463.33M | 179.77M | 77.04M | 85.01M | 88.28M |
| Total stockholder equity | 446.59M | 128.80M | 140.94M | 144.77M | 131.21M |
| Other current liab | 40.25M | 13.98M | 10.70M | 11.27M | 10.35M |
| Common stock | 1.34M | 0.39M | 0.38M | 0.37M | 0.32M |
| Capital stock | 1.34M | 90.66M | 72.41M | 53.04M | 52.31M |
| Retained earnings | -205.78M | -154.80M | -140.81M | -134.44M | -121.15M |
| Good will | 383.15M | 83.49M | 83.49M | 83.49M | 83.34M |
| Other assets | - | - | - | - | 0.00M |
| Cash | 48.79M | 24.35M | 17.99M | 26.76M | 18.43M |
| Total current liabilities | 151.01M | 43.59M | 44.53M | 44.29M | 35.90M |
| Current deferred revenue | 17.38M | 5.84M | 6.38M | 6.52M | 7.34M |
| Net debt | 238.27M | 99.12M | 11.79M | 7.47M | 20.13M |
| Short term debt | 51.78M | 3.74M | 12.75M | 8.75M | 8.33M |
| Short long term debt | 41.63M | 1.95M | 10.31M | 6.11M | 5.58M |
| Short long term debt total | 287.06M | 123.47M | 29.78M | 34.23M | 38.56M |
| Other stockholder equity | 659.88M | 193.93M | 210.54M | 225.78M | 199.64M |
| Total current assets | 169.08M | 169.79M | 80.44M | 86.15M | 61.64M |
| Short term investments | - | 5.02M | - | - | - |
| Net receivables | 78.62M | 32.59M | 34.86M | 34.00M | 25.61M |
| Long term debt | 232.16M | 113.81M | 11.40M | 18.11M | 23.18M |
| Inventory | 18.35M | 21.66M | 22.27M | 18.24M | 12.87M |
| Accounts payable | 41.60M | 20.02M | 14.70M | 17.75M | 9.88M |
| Accumulated other comprehensive income | -8.85M | -0.98M | -1.21M | 0.39M | 0.40M |
| Non currrent assets other | 24.98M | 15.61M | 10.84M | 11.07M | 12.53M |
| Non current assets total | 740.99M | 138.89M | 137.61M | 143.72M | 157.92M |
| Capital lease obligations | 13.27M | 7.71M | 8.07M | 10.01M | 9.80M |
| Breakdown | 2024-12-31 | 2023-12-31 | 2022-12-31 | 2021-12-31 | 2020-12-31 |
|---|---|---|---|---|---|
| Type | yearly | yearly | yearly | yearly | yearly |
| Date | 2024-12-31 | 2023-12-31 | 2022-12-31 | 2021-12-31 | 2020-12-31 |
| Investments | -170.60M | 1.53M | -6.33M | -3.03M | -3.30M |
| Total cashflows from investing activities | -170.60M | - | - | - | - |
| Net borrowings | 141.91M | - | - | - | - |
| Total cash from financing activities | 115.72M | -3.71M | -0.28M | 16.21M | -3.95M |
| Net income | -50.99M | -34.06M | -6.75M | -13.29M | -9.01M |
| Change in cash | -60.88M | 1.34M | -8.77M | 8.32M | 1.73M |
| Begin period cash flow | 109.66M | 17.99M | 26.76M | 18.43M | 16.70M |
| End period cash flow | 48.79M | 19.33M | 17.99M | 26.76M | 18.43M |
| Total cash from operating activities | -3.35M | 4.40M | 1.25M | -5.02M | 8.85M |
| Issuance of capital stock | 66.46M | 0.00M | 0.00M | 26.87M | 4.04M |
| Depreciation | 47.49M | 9.45M | 11.02M | 11.41M | 11.26M |
| Other cashflows from investing activities | 0.31M | - | - | - | - |
| Dividends paid | 90.30M | 3.38M | 0.00M | 4.11M | 0.00M |
| Change to inventory | 5.73M | 0.73M | -4.47M | -6.06M | 3.05M |
| Change to account receivables | -14.05M | 0.75M | -1.37M | -9.64M | 2.17M |
| Sale purchase of stock | -2.84M | -0.14M | -0.21M | -0.79M | -0.42M |
| Other cashflows from financing activities | 0.49M | 0.04M | 5.71M | -0.04M | 0.56M |
| Capital expenditures | 33.79M | 7.09M | 6.23M | 3.40M | 3.37M |
| Change in working capital | -25.01M | 3.55M | -8.99M | -12.15M | 0.67M |
| Stock based compensation | 9.36M | 4.11M | 4.34M | 4.68M | 4.26M |
| Other non cash items | 20.66M | 21.25M | 33.68M | 36.62M | 25.26M |
| Free cash flow | -37.13M | -2.70M | -4.98M | -8.42M | 5.47M |
Sector: Technology Industry: Software - Infrastructure
|
Stock Name
|
Change
(USD) |
Price
(USD) |
Trailing
PE (x) |
Forward
PE (x) |
Price Sales
TTM (x) |
Price to Book Value (x)
|
Enterprise Value
to Revenue (x) |
Enterprise Value
to EBITDA (x) |
|---|---|---|---|---|---|---|---|---|
| AIOT PowerFleet, Inc. |
-0.06 1.87% |
2.88 | - | 357.14 | 1.06 | 0.95 | 1.66 | 8.14 |
| MSFT Microsoft Corporation |
5.20 1.03% |
512.32 | 37.32 | 29.94 | 13.03 | 12.45 | 13.06 | 24.59 |
| ORCL Oracle Corporation |
4.99 4.18% |
124.20 | 21.96 | 17.89 | 5.91 | 7.08 | 7.82 | 14.89 |
| CRWD Crowdstrike Holdings Inc |
5.67 2.34% |
247.48 | 4849.80 | 188.68 | 46.01 | 47.24 | 43.89 | 559.34 |
| FTNT Fortinet Inc |
2.47 1.96% |
128.68 | 60.27 | 43.86 | 16.80 | 80.50 | 16.11 | 43.33 |
PowerFleet, Inc. provides artificial intelligence-of-things (AIoT) solutions in North America, Israel, Africa, Europe, the Middle East, Australia, and internationally. Its unity solution portfolio includes unity platform that enables integration with AIoT devices and third-party business systems to a data highway that powers artificial intelligence-driven insights to help customers save lives, time, and money; software as a service based unity modules, which comprises vehicle, video, and in-warehouse IoT for customers to gain visibility and AI-powered insights into their people, assets, and business processes to manage utilization and maintenance, safety, fuel and energy management, and compliance and high-risk incidents; and open application programming interfaces for additional integrations and development to enhance other enterprise management systems and third-party applications. The company also provides hosting, maintenance, and customer support and consulting services; and software as a service, such as system monitoring, help desk technical support, escalation procedure development, routine diagnostic data analysis, and software update services. The company offers its products under the Powerfleet, Pointer, Cellocator, MiX by Powerfleet, and Fleet Complete brands. It markets and sells its wireless solutions to a range of customers in the commercial and government sectors, including construction and heavy equipment, distribution, field services, leasing and car rental, government and public safety, manufacturing and automotive, oil and gas, chemical, transportation and logistics, utilities and telecommunications, and cold chain logistics. The company was formerly known as I.D. Systems, Inc. and changed its name to PowerFleet, Inc. in October 2019. PowerFleet, Inc. was incorporated in 1993 and is headquartered in Woodcliff Lake, New Jersey.

123 Tice Boulevard, Woodcliff Lake, NJ, United States, 07677

201 996 9000

2518
| Name | Title | Year Born |
|---|---|---|
| Mr. Steve Towe | CEO & Director | 1972 |
| Mr. David Wilson | CFO & Corporate Secretary | 1968 |
| Mr. James Zeitunian | Chief Technology Officer | 1966 |
| Mr. Offer Lehmann | Chief Operating Officer | 1972 |
| Ms. Melissa Ingram | Chief Corporate Development Officer | 1986 |
| Ms. Melissa Garza | Chief Human Resource Officer | NA |
| Mr. Jonathan Bates | Chief Product Officer | 1983 |
| Ms. Catherine Joy Lewis | Chief Customer Officer | 1975 |
| Mr. Charles W. R. Tasker | Chief Revenue Officer | 1964 |
| Mr. Josh Betz | GM and Head of Sales, North America | NA |
Disclaimer - (*)This information, including any data, is sourced from Unicorn Data Services SAS, trading as EOD Historical Data (“EODHD”) on an ‘as is’ basis, using their API. We cannot guarantee the completeness or validity of the information and data provided on this page, as well as via the API. In some cases, the data may include analyst ratings or recommendations sourced through the EODHD API, which are intended solely for general information purposes.
This information does not consider your personal objectives, financial situation, or needs. Kalkine is not liable for any errors or omissions in the information provided or for any actions taken in reliance on it. You should seek advice from a financial adviser, stockbroker or other professional adviser (including taxation and legal advice) as necessary before acting on this information.

Download a free report with stock ideas and industry insights for general information.
Download Free Report Now →


Basic Materials
 -0.17%
Communication Services
 +0.18%

Consumer Cyclical
+0.51%

Consumer Defensive
+0.42%

Energy
-1.23%

Financial Services
+0.48%
Financials
+0.41%

Healthcare
+0.23%

Industrials
+0.31%

Real Estate
+0.26%

Technology
+0.11%

Utilities
+0.05%
Note: Daily price change (%) by sector excluding stocks with +/-90% daily price change. Companies above $500 million market capitalization are considered.
 Portfolio
 Watchlist


 Please wait processing your request...