 CA
 NZ
 UK
 AU
 IND

 US


…
Viant Technology Inc. operates a cloud-based demand side platform (DSP) that enables the programmatic purchase of digital advertising across multiple channels, including connected TV (CTV), streaming audio, digital out-of-home, mobile, and desktop. It provides ViantAI, an artificial intelligence product suite; Holistic, Omnichannel DSP, an integrated platform that manages omnichannel campaigns and access metrics; Household ID, which combines digital and personal identifiers into a normalized household profile; IRIS_ID, a content identifier that allows partners to share video-level data to power planning, targeting, and measurement solutions in ad-supported streaming media; and Viant Data Platform, which offers the ability to integrate first-party data with data from top third-party data providers to obtain key insights, reporting, and attribution opportunities. The company also offers Direct Access, a supply path optimization program that creates a direct path to premium inventory; Advanced Reporting and Measurement that offers conversion lift, multitouch attribution, foot-traffic data reports, digital-out-of-home lift, sales reporting, and ROAS analytics; and Flexible Customer Engagement Model, which offers customers transparency and control over their advertising campaigns and underlying data infrastructure. The company sells its platform through a direct sales team focused on business development in various markets. It serves purchasers of programmatic advertising inventory and large, independent, and mid-market advertising agencies, as well as marketers. The company was formerly known as Interactive Media Holdings and changed its name to Viant Technology Inc. in January 2015. The company was founded in 1999 and is headquartered in Irvine, California.
Source: TradingView
The charts and visual representations are sourced from TradingView through embedded widgets. For any issues with chart display, please visit the TradingView website
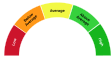
A unique technical analysis driven score developed by Kalkine showing momentum in stock prices based on select technical indicators identified.
Viant Technology Inc operates a data-driven digital advertising platform that helps advertisers plan, buy and measure campaigns across connected TV, mobile and desktop. Long-term growth may be supported by programmatic and connected-TV migration and demand for cookieless targeting using first-party data; investors may find the company attractive for its cross-channel measurement capabilities.
Key investment risks include sensitivity to advertising spend cycles, intense competition from large platforms and adtech firms, execution risk in scaling and retaining data assets and clients, and potential regulatory changes that could limit targeting methods.

Note: The summary and risk score provided above is created by AI and should not be construed as a recommendation of Kalkine.


| Breakdown | 2025-12-31 | 2024-12-31 | 2023-12-31 | 2022-12-31 | 2021-12-31 |
|---|---|---|---|---|---|
| Type | yearly | yearly | yearly | yearly | yearly |
| Date | 2025-12-31 | 2024-12-31 | 2023-12-31 | 2022-12-31 | 2021-12-31 |
| Income before tax | 10.13M | 12.70M | -9.79M | -48.09M | -37.61M |
| Minority interest | -15.74M | -10.09M | 14.99M | -36.18M | -29.87M |
| Net income | 24.10M | 2.36M | -3.44M | -9.26M | -8.55M |
| Selling general administrative | 50.17M | 51.10M | 45.34M | 44.45M | 46.90M |
| Selling and marketing expenses | 64.80M | 53.75M | 50.65M | 63.96M | 65.04M |
| Gross profit | 289.28M | 132.07M | 102.45M | 80.44M | 94.52M |
| Reconciled depreciation | 18.70M | 16.46M | 16.98M | 15.99M | 11.14M |
| Ebit | 148.87M | 3.48M | -18.30M | -49.26M | -42.80M |
| Ebitda | 167.57M | 19.94M | -3.56M | -33.27M | -31.71M |
| Depreciation and amortization | 18.70M | 16.46M | 14.73M | 15.99M | 11.08M |
| Non operating income net other | - | - | - | -0.31M | 6.05M |
| Operating income | 148.87M | 3.48M | -18.30M | -49.26M | -42.80M |
| Other operating expenses | 195.33M | 285.76M | 241.23M | 246.43M | 266.92M |
| Interest expense | - | 0.40M | 0.40M | 1.48M | 0.86M |
| Tax provision | -13.96M | 0.25M | 0.15M | - | - |
| Net interest income | 6.10M | 9.23M | 7.40M | 1.48M | -0.86M |
| Income tax expense | -13.96M | 0.25M | 0.15M | -38.83M | -29.06M |
| Total revenue | 344.20M | 289.24M | 222.93M | 197.17M | 224.13M |
| Total operating expenses | 140.41M | 128.59M | 120.75M | 129.70M | 137.32M |
| Cost of revenue | 54.92M | 157.16M | 120.48M | 116.72M | 129.60M |
| Total other income expense net | -138.74M | 9.22M | 8.50M | 1.17M | 5.19M |
| Net income from continuing ops | 24.10M | 12.45M | -21.26M | -48.09M | -37.61M |
| Net income applicable to common shares | - | - | - | -11.91M | -7.74M |
| Breakdown | 2025-12-31 | 2024-12-31 | 2023-12-31 | 2022-12-31 | 2021-12-31 |
|---|---|---|---|---|---|
| Type | yearly | yearly | yearly | yearly | yearly |
| Date | 2025-12-31 | 2024-12-31 | 2023-12-31 | 2022-12-31 | 2021-12-31 |
| Total assets | 474.66M | 440.80M | 404.91M | 377.88M | 389.13M |
| Intangible assets | 2.90M | 3.05M | 0.20M | 0.67M | 1.79M |
| Other current assets | 7.90M | 10.49M | 6.49M | 6.63M | 2.97M |
| Total liab | 185.86M | 166.73M | 130.52M | 112.11M | 106.56M |
| Total stockholder equity | 82.14M | 53.84M | 68.26M | 59.25M | 60.16M |
| Other current liab | 67.85M | 69.40M | 57.43M | 46.22M | 2.53M |
| Common stock | 0.06M | 0.07M | 0.06M | 0.06M | 0.06M |
| Capital stock | 0.06M | 0.07M | 0.06M | 0.06M | 0.06M |
| Retained earnings | -91.75M | -50.57M | -43.51M | -36.26M | -20.14M |
| Other liab | - | - | - | - | 6.00M |
| Good will | 19.19M | 19.19M | 12.42M | 12.42M | 12.42M |
| Other assets | - | - | - | 0.39M | 0.41M |
| Cash | 191.15M | 205.05M | 216.46M | 206.57M | 238.48M |
| Total current liabilities | 157.03M | 145.45M | 108.85M | 87.12M | 83.06M |
| Current deferred revenue | 0.58M | 0.58M | 0.32M | 0.12M | 1.32M |
| Net debt | -169.40M | -179.04M | -191.02M | -177.86M | -220.98M |
| Short term debt | 5.08M | 4.73M | 3.76M | 3.71M | 46.33M |
| Short long term debt total | 21.75M | 26.01M | 25.43M | 28.71M | 17.50M |
| Other stockholder equity | 173.82M | 104.34M | 111.70M | 95.45M | 80.24M |
| Property plant equipment | - | - | - | 23.11M | 22.33M |
| Total current assets | 376.19M | 362.49M | 340.42M | 314.86M | 352.19M |
| Net tangible assets | - | - | - | 46.16M | 45.95M |
| Net receivables | 177.14M | 146.95M | 117.47M | 101.66M | 110.74M |
| Long term debt | - | - | - | - | 17.50M |
| Inventory | - | - | 0.00M | - | - |
| Accounts payable | 83.52M | 71.32M | 47.34M | 37.06M | 32.88M |
| Noncontrolling interest in consolidated entity | - | - | - | 206.52M | 222.41M |
| Accumulated other comprehensive income | - | 0.00M | 0.00M | - | -389.13M |
| Common stock total equity | - | - | - | 0.06M | 0.06M |
| Retained earnings total equity | - | - | - | -36.26M | -20.14M |
| Treasury stock | - | - | - | -0.47M | -2.65M |
| Non currrent assets other | 0.60M | 0.93M | 0.61M | 0.39M | 0.41M |
| Non current assets total | 98.47M | 78.31M | 64.49M | 63.02M | 36.95M |
| Capital lease obligations | 21.75M | 26.01M | 25.43M | 28.71M | - |
| Long term debt total | - | - | - | - | 17.50M |
| Breakdown | 2025-12-31 | 2024-12-31 | 2023-12-31 | 2022-12-31 | 2021-12-31 |
|---|---|---|---|---|---|
| Type | yearly | yearly | yearly | yearly | yearly |
| Date | 2025-12-31 | 2024-12-31 | 2023-12-31 | 2022-12-31 | 2021-12-31 |
| Investments | -3.50M | -27.74M | -12.06M | -8.83M | -7.37M |
| Change to liabilities | - | - | - | -4.80M | 13.96M |
| Total cashflows from investing activities | -22.34M | -27.74M | -13.48M | -8.83M | -7.37M |
| Net borrowings | - | 0.00M | 0.00M | -17.50M | -2.61M |
| Total cash from financing activities | -44.16M | -35.43M | -14.39M | -19.55M | 207.56M |
| Change to operating activities | - | - | - | -7.79M | 11.59M |
| Net income | 24.10M | 2.36M | -3.44M | -48.09M | -37.61M |
| Change in cash | -13.90M | -11.41M | 9.88M | -31.91M | 228.85M |
| Begin period cash flow | 205.05M | 216.46M | 206.57M | 238.48M | 9.63M |
| End period cash flow | 191.15M | 205.05M | 216.46M | 206.57M | 238.48M |
| Total cash from operating activities | 52.61M | 51.77M | 37.75M | -3.53M | 28.66M |
| Issuance of capital stock | - | - | 0.00M | 0.00M | 232.50M |
| Depreciation | 18.70M | 16.46M | 14.73M | 15.99M | 11.14M |
| Other cashflows from investing activities | -17.37M | -15.25M | -12.28M | -8.07M | -6.93M |
| Dividends paid | - | - | - | 0.00M | 0.00M |
| Change to inventory | - | - | 2.40M | - | 11.59M |
| Change to account receivables | -30.81M | -30.23M | -16.12M | 7.82M | -20.86M |
| Sale purchase of stock | -38.09M | -32.23M | -4.25M | - | 232.50M |
| Other cashflows from financing activities | -9.84M | -3.21M | -10.14M | -2.05M | -24.94M |
| Change to netincome | - | - | - | 30.75M | 62.79M |
| Capital expenditures | 0.93M | 2.50M | 1.20M | 8.83M | 7.37M |
| Change receivables | - | - | - | 7.82M | -20.86M |
| Cash flows other operating | - | - | - | -2.34M | -0.75M |
| Cash and cash equivalents changes | - | - | - | -31.91M | 228.85M |
| Change in working capital | -16.16M | -3.64M | -3.49M | -2.18M | -7.66M |
| Stock based compensation | 24.84M | 21.03M | 32.29M | 28.90M | 68.82M |
| Other non cash items | 15.81M | 15.55M | -2.33M | 1.85M | -6.03M |
| Free cash flow | 51.68M | 49.27M | 36.56M | -12.36M | 21.29M |
Sector: Technology Industry: Software - Application
|
Stock Name
|
Change
(USD) |
Price
(USD) |
Trailing
PE (x) |
Forward
PE (x) |
Price Sales
TTM (x) |
Price to Book Value (x)
|
Enterprise Value
to Revenue (x) |
Enterprise Value
to EBITDA (x) |
|---|---|---|---|---|---|---|---|---|
| DSP Viant Technology Inc |
1.20 9.30% |
14.04 | 31.19 | 14.77 | 2.07 | 2.43 | 0.09 | 0.97 |
| SAP SAP SE ADR |
- -% |
237.42 | 28.16 | 22.42 | 6.52 | 4.85 | 5.60 | 16.61 |
| CRM Salesforce Inc |
0.77 0.36% |
214.42 | 23.41 | 15.55 | 4.79 | 5.56 | 5.55 | 14.88 |
| SAPGF SAP SE |
5.55 2.39% |
238.00 | 76.28 | 22.88 | 5.61 | 3.84 | 5.59 | 26.18 |
| SHOP Shopify Inc |
2.85 1.91% |
151.76 | 90.18 | 53.19 | 12.70 | 13.17 | 12.23 | 67.86 |
Viant Technology Inc. operates a cloud-based demand side platform (DSP) that enables the programmatic purchase of digital advertising across multiple channels, including connected TV (CTV), streaming audio, digital out-of-home, mobile, and desktop. It provides ViantAI, an artificial intelligence product suite; Holistic, Omnichannel DSP, an integrated platform that manages omnichannel campaigns and access metrics; Household ID, which combines digital and personal identifiers into a normalized household profile; IRIS_ID, a content identifier that allows partners to share video-level data to power planning, targeting, and measurement solutions in ad-supported streaming media; and Viant Data Platform, which offers the ability to integrate first-party data with data from top third-party data providers to obtain key insights, reporting, and attribution opportunities. The company also offers Direct Access, a supply path optimization program that creates a direct path to premium inventory; Advanced Reporting and Measurement that offers conversion lift, multitouch attribution, foot-traffic data reports, digital-out-of-home lift, sales reporting, and ROAS analytics; and Flexible Customer Engagement Model, which offers customers transparency and control over their advertising campaigns and underlying data infrastructure. The company sells its platform through a direct sales team focused on business development in various markets. It serves purchasers of programmatic advertising inventory and large, independent, and mid-market advertising agencies, as well as marketers. The company was formerly known as Interactive Media Holdings and changed its name to Viant Technology Inc. in January 2015. The company was founded in 1999 and is headquartered in Irvine, California.
| Name | Title | Year Born |
|---|---|---|
| Mr. Tim Vanderhook | Co-Founder, Chairman & CEO | 1981 |
| Mr. Chris Vanderhook | Co-Founder, COO & Director | 1979 |
| Mr. Lawrence J. Madden | Chief Financial Officer | 1965 |
| Mr. Russell Vanderhook | Co-Founder & Sr. VP | NA |
| Mr. Fabrizio Blanco | Chief Technology Officer | NA |
| Mr. Linh Chung | Chief Information Officer | NA |
| Mr. Brad Samson | VP of Investor Relations | NA |
| Mr. Ritesh Patel | Chief Legal Officer | NA |
| Sondra Magness | VP of Corp. Communications | NA |
| Mr. Jon Schulz | Chief Marketing Officer | NA |
Disclaimer - (*)This information, including any data, is sourced from Unicorn Data Services SAS, trading as EOD Historical Data (“EODHD”) on an ‘as is’ basis, using their API. We cannot guarantee the completeness or validity of the information and data provided on this page, as well as via the API. In some cases, the data may include analyst ratings or recommendations sourced through the EODHD API, which are intended solely for general information purposes.
This information does not consider your personal objectives, financial situation, or needs. Kalkine is not liable for any errors or omissions in the information provided or for any actions taken in reliance on it. You should seek advice from a financial adviser, stockbroker or other professional adviser (including taxation and legal advice) as necessary before acting on this information.

Download a free report with stock ideas and industry insights for general information.
Download Free Report Now →


Basic Materials
 +1.88%
Communication Services
+1.14%

Consumer Cyclical
+1.04%

Consumer Defensive
+0.57%

Energy
+0.50%

Financial Services
+0.81%
Financials
+0.24%

Healthcare
+1.35%

Industrials
+1.54%

Real Estate
+0.24%

Technology
+2.32%

Utilities
+0.48%
Note: Daily price change (%) by sector excluding stocks with +/-90% daily price change. Companies above $500 million market capitalization are considered.
 Portfolio
 Watchlist


 -4.40%
 Please wait processing your request...