 CA
 NZ
 UK
 AU
 IND

 US


…
Editas Medicine, Inc., a clinical stage genome editing company, focuses on developing transformative genomic medicines to treat a range of serious diseases. The company develops a proprietary gene editing platform based on CRISPR technology. Its lead program is EDIT-401, a one-time therapy designed to reduce LDL cholesterol through the upregulation of the LDL receptor to treat hyperlipidemia. The company also develops therapies to treat Sickle cell disease and transfusion-dependent beta thalassemia; and in vivo gene editing medicines indicated for other cells and tissues. It has a research collaboration with Juno Therapeutics, Inc. to develop alpha-beta T-cell experimental medicines for the treatment of solid and liquid tumors, and autoimmune disease. The company was formerly known as Gengine, Inc. and changed its name to Editas Medicine, Inc. in November 2013. Editas Medicine, Inc. was incorporated in 2013 and is based in Cambridge, Massachusetts.
Source: TradingView
The charts and visual representations are sourced from TradingView through embedded widgets. For any issues with chart display, please visit the TradingView website
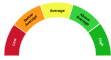
A unique technical analysis driven score developed by Kalkine showing momentum in stock prices based on select technical indicators identified.
Editas Medicine develops CRISPR-based in vivo and ex vivo gene-editing therapies targeting inherited and serious diseases. Long-term growth may be driven by clinical progress across its pipeline, platform improvements in delivery and specificity, and collaborations that could support development, making it attractive for investors seeking exposure to core genome-editing technology.
Key risks include high clinical and regulatory uncertainty for first-in-class gene-editing programs, intense competition, manufacturing and scaling challenges, and the potential need for additional capital.

Note: The summary and risk score provided above is created by AI and should not be construed as a recommendation of Kalkine.


| Breakdown | 2025-12-31 | 2024-12-31 | 2023-12-31 | 2022-12-31 | 2021-12-31 |
|---|---|---|---|---|---|
| Type | yearly | yearly | yearly | yearly | yearly |
| Date | 2025-12-31 | 2024-12-31 | 2023-12-31 | 2022-12-31 | 2021-12-31 |
| Income before tax | -160.06M | -237.09M | -153.22M | -220.43M | -192.50M |
| Net income | -160.06M | -237.09M | -153.22M | -204.35M | -185.11M |
| Selling general administrative | 49.90M | 71.99M | 69.65M | 70.70M | 76.18M |
| Gross profit | 40.52M | 32.31M | 72.06M | 19.71M | 25.54M |
| Reconciled depreciation | 5.28M | 5.81M | 6.17M | 6.34M | 5.05M |
| Ebit | -153.89M | -238.92M | -169.18M | -225.95M | -193.15M |
| Ebitda | -148.61M | -233.11M | -163.12M | -219.61M | -188.09M |
| Depreciation and amortization | 5.28M | 5.81M | 6.06M | 6.34M | 5.05M |
| Non operating income net other | - | - | - | 5.52M | 0.64M |
| Operating income | -99.34M | -251.15M | -169.18M | -225.95M | -193.15M |
| Other operating expenses | 139.86M | 283.47M | 247.30M | 245.66M | 218.69M |
| Interest expense | 6.17M | 2.19M | - | 4.22M | 5.70M |
| Interest income | 8.31M | 14.06M | 13.88M | 4.22M | 2.34M |
| Net interest income | 2.14M | 14.06M | 13.88M | 4.22M | 2.34M |
| Income tax expense | - | - | - | -16.08M | -7.39M |
| Total revenue | 40.52M | 32.31M | 78.12M | 19.71M | 25.54M |
| Total operating expenses | 139.86M | 283.47M | 241.24M | 245.66M | 218.69M |
| Cost of revenue | 5.28M | 5.81M | 6.06M | 6.34M | 5.05M |
| Total other income expense net | -60.72M | 14.06M | 15.96M | 5.52M | 0.64M |
| Net income from continuing ops | -160.06M | -237.09M | -195.08M | -220.43M | -192.50M |
| Net income applicable to common shares | - | - | - | -220.43M | -192.50M |
| Breakdown | 2025-12-31 | 2024-12-31 | 2023-12-31 | 2022-12-31 | 2021-12-31 |
|---|---|---|---|---|---|
| Type | yearly | yearly | yearly | yearly | yearly |
| Date | 2025-12-31 | 2024-12-31 | 2023-12-31 | 2022-12-31 | 2021-12-31 |
| Total assets | 186.53M | 341.59M | 499.15M | 514.32M | 677.48M |
| Other current assets | 2.07M | 3.14M | 7.53M | 7.33M | 7.20M |
| Total liab | 159.25M | 207.31M | 150.06M | 153.64M | 123.84M |
| Total stockholder equity | 27.29M | 134.27M | 349.10M | 360.68M | 553.64M |
| Other current liab | -11.90M | 45.86M | 34.56M | 31.30M | 20.19M |
| Common stock | 0.01M | 0.01M | 0.01M | 0.01M | 0.01M |
| Capital stock | 0.01M | 0.01M | 0.01M | 0.01M | 0.01M |
| Retained earnings | -1628.50M | -1468.44M | -1231.35M | -1078.13M | -857.70M |
| Other liab | - | - | - | 60.67M | 60.89M |
| Other assets | - | - | - | 5.25M | 6.81M |
| Cash | 146.65M | 131.54M | 123.65M | 141.52M | 203.52M |
| Total current liabilities | 46.25M | 77.22M | 63.22M | 60.11M | 46.88M |
| Current deferred revenue | 44.51M | 11.22M | 8.22M | 8.22M | 11.33M |
| Net debt | -69.94M | -96.51M | -87.12M | -97.58M | -177.14M |
| Short term debt | 11.03M | 14.65M | 12.16M | 11.08M | 10.31M |
| Short long term debt total | 76.71M | 35.03M | 36.54M | 43.95M | 26.38M |
| Other stockholder equity | 1655.78M | 1602.44M | 1580.24M | 1442.40M | 1411.83M |
| Property plant equipment | - | - | - | 15.57M | 17.12M |
| Total current assets | 163.90M | 289.31M | 340.83M | 356.75M | 507.31M |
| Long term investments | - | 0.00M | 104.02M | 93.10M | 120.07M |
| Net tangible assets | - | - | - | 360.68M | 553.64M |
| Short term investments | 0.00M | 138.37M | 199.46M | 202.75M | 296.33M |
| Net receivables | 15.18M | 16.27M | 10.19M | 5.14M | 0.27M |
| Inventory | - | - | - | -93.10M | -120.07M |
| Accounts payable | 2.60M | 5.49M | 8.27M | 9.51M | 5.05M |
| Accumulated other comprehensive income | - | 0.27M | 0.20M | -3.60M | -0.49M |
| Common stock total equity | - | - | - | 0.01M | 0.01M |
| Retained earnings total equity | - | - | - | -1078.13M | -857.70M |
| Non currrent assets other | 0.28M | 5.22M | 4.71M | 5.25M | 6.81M |
| Non current assets total | 22.64M | 52.27M | 158.32M | 157.57M | 170.17M |
| Capital lease obligations | 18.10M | 35.03M | 36.54M | 43.95M | 26.38M |
| Breakdown | 2025-12-31 | 2024-12-31 | 2023-12-31 | 2022-12-31 | 2021-12-31 |
|---|---|---|---|---|---|
| Type | yearly | yearly | yearly | yearly | yearly |
| Date | 2025-12-31 | 2024-12-31 | 2023-12-31 | 2022-12-31 | 2021-12-31 |
| Investments | 139.01M | 162.15M | -94.10M | 118.17M | -46.49M |
| Change to liabilities | - | - | - | 14.87M | -5.30M |
| Total cashflows from investing activities | 138.67M | 162.15M | - | 114.07M | -54.47M |
| Total cash from financing activities | 40.47M | 56.03M | 118.04M | 1.28M | 282.11M |
| Change to operating activities | - | - | - | 12.02M | -3.35M |
| Net income | -160.06M | -237.09M | -153.22M | -220.43M | -192.50M |
| Change in cash | 13.90M | 7.89M | -17.87M | -62.00M | 63.84M |
| Begin period cash flow | 135.42M | 127.53M | 141.52M | 207.40M | 143.56M |
| End period cash flow | 149.31M | 135.42M | 123.65M | 145.40M | 207.40M |
| Total cash from operating activities | -165.24M | -210.28M | -132.18M | -177.35M | -163.80M |
| Issuance of capital stock | 42.85M | 0.00M | 117.08M | 0.00M | 249.46M |
| Depreciation | 5.28M | 5.81M | 6.06M | 6.34M | 5.05M |
| Other cashflows from investing activities | 0.27M | - | - | 0.02M | - |
| Change to inventory | - | - | - | - | -3.35M |
| Change to account receivables | 1.09M | -6.08M | -5.04M | -4.88M | 5.78M |
| Sale purchase of stock | - | - | - | 1.28M | 282.11M |
| Other cashflows from financing activities | 40.47M | 56.03M | 0.96M | 0.30M | 282.11M |
| Change to netincome | - | - | - | 28.57M | 45.06M |
| Capital expenditures | 0.61M | 8.83M | 4.72M | 4.12M | 7.98M |
| Change receivables | - | - | - | -4.88M | 5.78M |
| Cash flows other operating | - | - | - | -1.82M | -21.89M |
| Cash and cash equivalents changes | - | - | - | -62.00M | 63.84M |
| Change in working capital | -31.23M | 3.45M | -1.59M | 8.18M | -21.41M |
| Stock based compensation | 10.00M | 21.42M | 19.80M | 29.29M | 43.40M |
| Other non cash items | 10.77M | -3.87M | -9.76M | -0.72M | 1.66M |
| Free cash flow | -165.85M | -219.11M | -136.90M | -181.47M | -171.78M |
Sector: Healthcare Industry: Biotechnology
|
Stock Name
|
Change
(USD) |
Price
(USD) |
Trailing
PE (x) |
Forward
PE (x) |
Price Sales
TTM (x) |
Price to Book Value (x)
|
Enterprise Value
to Revenue (x) |
Enterprise Value
to EBITDA (x) |
|---|---|---|---|---|---|---|---|---|
| EDIT Editas Medicine Inc |
-0.10 3.75% |
2.57 | - | - | 7.97 | 11.87 | 4.82 | -1.36 |
| NVO Novo Nordisk A/S |
0.45 1.12% |
40.45 | 41.58 | 31.15 | 2.13 | 32.99 | 2.11 | 4.70 |
| VRTX Vertex Pharmaceuticals Inc |
-5.73 1.03% |
553.15 | 30.22 | 24.27 | 10.36 | 6.50 | 9.99 | 24.66 |
| REGN Regeneron Pharmaceuticals Inc |
33.37 3.60% |
961.26 | 29.07 | 20.12 | 7.57 | 3.82 | 6.95 | 19.42 |
| ARGNF argenx SE |
- -% |
900.30 | 45.77 | 31.25 | 13.84 | 7.12 | 11.38 | 36.06 |
Editas Medicine, Inc., a clinical stage genome editing company, focuses on developing transformative genomic medicines to treat a range of serious diseases. The company develops a proprietary gene editing platform based on CRISPR technology. Its lead program is EDIT-401, a one-time therapy designed to reduce LDL cholesterol through the upregulation of the LDL receptor to treat hyperlipidemia. The company also develops therapies to treat Sickle cell disease and transfusion-dependent beta thalassemia; and in vivo gene editing medicines indicated for other cells and tissues. It has a research collaboration with Juno Therapeutics, Inc. to develop alpha-beta T-cell experimental medicines for the treatment of solid and liquid tumors, and autoimmune disease. The company was formerly known as Gengine, Inc. and changed its name to Editas Medicine, Inc. in November 2013. Editas Medicine, Inc. was incorporated in 2013 and is based in Cambridge, Massachusetts.

11 Hurley Street, Cambridge, MA, United States, 02141

617 401 9000

87
| Name | Title | Year Born |
|---|---|---|
| Mr. James C. Mullen | Exec. Chairman | 1959 |
| Ms. Michelle Robertson | CFO, Principal Accounting Officer, Treasurer & Assistant Sec. | 1967 |
| Dr. Mark S. Shearman | Exec. VP & Chief Scientific Officer | 1960 |
| Dr. Bruce E. Eaton Ph.D. | Exec. VP & Chief Bus. Officer | 1954 |
| Dr. Gilmore O'Neill | Pres & CEO | 1964 |
| Dr. Feng Zhang Ph.D. | Co-Founder & Scientific Advisory Board Member | NA |
| Dr. George McDonald Church Ph.D. | Co-Founder & Scientific Advisory Board Member | 1954 |
| Dr. J. Keith Joung M.D., Ph.D. | Co-Founder & Scientific Advisory Board Member | NA |
| Dr. David R. Liu Ph.D. | Co-Founder & Scientific Advisory Board Member | NA |
| Mr. Harry R. Gill III | Sr. VP of Operations | 1961 |
Disclaimer - (*)This information, including any data, is sourced from Unicorn Data Services SAS, trading as EOD Historical Data (“EODHD”) on an ‘as is’ basis, using their API. We cannot guarantee the completeness or validity of the information and data provided on this page, as well as via the API. In some cases, the data may include analyst ratings or recommendations sourced through the EODHD API, which are intended solely for general information purposes.
This information does not consider your personal objectives, financial situation, or needs. Kalkine is not liable for any errors or omissions in the information provided or for any actions taken in reliance on it. You should seek advice from a financial adviser, stockbroker or other professional adviser (including taxation and legal advice) as necessary before acting on this information.

Download a free report with stock ideas and industry insights for general information.
Download Free Report Now →


Basic Materials
 -0.09%
Communication Services
 +0.21%

Consumer Cyclical
+1.14%

Consumer Defensive
+0.88%

Energy
-2.61%

Financial Services
+0.70%
Financials
+0.41%

Healthcare
-0.75%

Industrials
+0.35%

Real Estate
+0.57%

Technology
-1.17%

Utilities
+0.05%
Note: Daily price change (%) by sector excluding stocks with +/-90% daily price change. Companies above $500 million market capitalization are considered.
 Portfolio
 Watchlist


 Please wait processing your request...