 CA
 NZ
 UK
 AU
 IND

 US


…
Entegris, Inc. provides advanced materials and process solutions for the semiconductor and other high-technology industries in North America, Taiwan, South Korea, Japan, China, Europe, and Southeast Asia. It operates in two segments, Materials Solutions (MS) and Advanced Purity Solutions (APS). The MS segment provides materials-based solutions, such as chemical vapor and atomic layer deposition materials, chemical mechanical planarization slurries and pads, ion implantation specialty gases, formulated etch and clean materials, and other specialty materials. The APS segment offers filtration, purification, and contamination-control solutions for the semiconductor manufacturing processes, semiconductor ecosystem, and other high-technology industries. The company's customers include logic and memory semiconductor device manufacturers, semiconductor equipment makers, gas and chemical manufacturing companies, and wafer grower companies; and outsourced semiconductor assembly and test facilities, flat panel display equipment makers, and manufacturers of hard disk drive components and devices. It serves manufacturers and suppliers in the solar and life science industries, electrical discharge machining customers, glass manufacturers, aerospace manufacturers, and manufacturers of biomedical implantation devices. Entegris, Inc. was founded in 1966 and is headquartered in Billerica, Massachusetts.
Source: TradingView
The charts and visual representations are sourced from TradingView through embedded widgets. For any issues with chart display, please visit the TradingView website
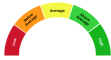
A unique technical analysis driven score developed by Kalkine showing momentum in stock prices based on select technical indicators identified.
Entegris supplies advanced materials, specialty chemicals and contamination-control systems used across semiconductor manufacturing and other high-tech industries. Long-term growth could be driven by increasing process complexity, rising packaging and materials demand, expanding global fab capacity tied to AI and electrification, and scale from recent strategic acquisitions, while its broad product set and customer relationships may attract investors.
Key risks include semiconductor demand cyclicality, customer concentration, integration risk from acquisitions, supply-chain and raw-material volatility, and trade or regulatory constraints.

Note: The summary and risk score provided above is created by AI and should not be construed as a recommendation of Kalkine.


| Breakdown | 2025-12-31 | 2024-12-31 | 2023-12-31 | 2022-12-31 | 2021-12-31 |
|---|---|---|---|---|---|
| Type | yearly | yearly | yearly | yearly | yearly |
| Date | 2025-12-31 | 2024-12-31 | 2023-12-31 | 2022-12-31 | 2021-12-31 |
| Income before tax | 253.60M | 321.12M | 172.26M | 247.08M | 479.08M |
| Net income | 235.60M | 292.79M | 180.67M | 208.92M | 409.13M |
| Selling general administrative | 17.00M | 553.29M | 426.20M | 543.49M | 292.41M |
| Selling and marketing expenses | - | - | 150.00M | - | - |
| Gross profit | 1419.90M | 1486.72M | 1497.61M | 1396.41M | 1059.66M |
| Reconciled depreciation | 389.70M | 378.24M | 388.96M | 279.32M | 138.17M |
| Ebit | 454.40M | 537.27M | 485.05M | 479.98M | 551.77M |
| Ebitda | 844.10M | 915.51M | 872.21M | 735.38M | 658.24M |
| Depreciation and amortization | 389.70M | 378.24M | 387.16M | 255.40M | 106.47M |
| Non operating income net other | - | - | - | -20.23M | -31.45M |
| Operating income | 923.50M | 533.92M | 499.16M | 479.98M | 551.77M |
| Other operating expenses | 2273.10M | 2707.29M | 3024.77M | 2802.05M | 1747.12M |
| Interest expense | 199.80M | 215.22M | 312.38M | 208.97M | 41.00M |
| Tax provision | 18.00M | 28.33M | 10.63M | 38.16M | 69.95M |
| Interest income | 7.90M | 7.37M | 7.48M | 3.69M | 0.24M |
| Net interest income | -191.90M | -207.85M | -321.03M | -208.97M | -41.00M |
| Income tax expense | 18.00M | 28.33M | -8.41M | 38.16M | 69.95M |
| Total revenue | 3196.60M | 3241.21M | 3523.93M | 3282.03M | 2298.89M |
| Total operating expenses | 496.40M | 952.80M | 998.45M | 916.43M | 507.90M |
| Cost of revenue | 1776.70M | 1754.49M | 2026.32M | 1885.62M | 1239.23M |
| Total other income expense net | -669.90M | -212.80M | -326.90M | -232.90M | -72.69M |
| Net income from continuing ops | 235.60M | 292.79M | 200.12M | 208.92M | 409.13M |
| Net income applicable to common shares | - | - | - | 208.92M | 409.13M |
| Breakdown | 2025-12-31 | 2024-12-31 | 2023-12-31 | 2022-12-31 | 2021-12-31 |
|---|---|---|---|---|---|
| Type | yearly | yearly | yearly | yearly | yearly |
| Date | 2025-12-31 | 2024-12-31 | 2023-12-31 | 2022-12-31 | 2021-12-31 |
| Total assets | 8350.50M | 8394.62M | 8812.59M | 10138.86M | 3191.90M |
| Intangible assets | 906.90M | 1091.75M | 1281.97M | 1841.95M | 335.11M |
| Other current assets | 818.46M | 114.09M | 113.66M | 129.30M | 52.87M |
| Total liab | 4397.10M | 4703.12M | 5404.00M | 6920.86M | 1478.12M |
| Total stockholder equity | 3953.40M | 3691.50M | 3408.59M | 3218.00M | 1713.78M |
| Deferred long term liab | - | - | - | 391.19M | 64.17M |
| Other current liab | 251.32M | 193.96M | 379.78M | 389.86M | 248.27M |
| Common stock | 1.50M | 1.51M | 1.51M | 1.49M | 1.36M |
| Capital stock | 1.50M | 1.51M | 1.51M | 1.49M | 1.36M |
| Retained earnings | 1558.40M | 1383.88M | 1151.77M | 1031.39M | 879.78M |
| Other liab | - | - | - | 445.28M | 101.99M |
| Good will | 3946.70M | 3943.57M | 3945.86M | 4408.33M | 793.70M |
| Other assets | - | - | - | 51.00M | 29.05M |
| Cash | 360.40M | 329.21M | 456.93M | 563.44M | 402.56M |
| Total current liabilities | 488.60M | 525.18M | 514.00M | 761.93M | 379.00M |
| Current deferred revenue | 49.90M | 41.74M | 69.05M | 47.62M | - |
| Net debt | 3533.20M | 3739.74M | 4189.20M | 5302.17M | 594.56M |
| Short term debt | 15.80M | 15.69M | 69.05M | 151.97M | - |
| Short long term debt | - | - | - | 151.97M | - |
| Short long term debt total | 3893.60M | 4068.95M | 4646.13M | 5865.61M | 997.13M |
| Other stockholder equity | 2464.90M | 2378.23M | 2298.26M | 2198.21M | 872.73M |
| Property plant equipment | - | - | - | 1393.34M | 720.66M |
| Total current assets | 1638.20M | 1616.30M | 1977.33M | 2335.18M | 1313.37M |
| Net tangible assets | - | - | - | -2951.57M | 584.97M |
| Short term investments | - | - | 21.45M | - | - |
| Net receivables | 458.70M | 534.92M | 457.05M | 535.49M | 347.41M |
| Long term debt | 3697.60M | 3981.11M | 4577.14M | 5632.93M | 937.03M |
| Inventory | 0.64M | 638.08M | 607.05M | 812.82M | 475.21M |
| Accounts payable | 171.50M | 193.26M | 134.21M | 172.49M | 130.73M |
| Accumulated other comprehensive income | -71.40M | -72.12M | -42.93M | -13.10M | -40.09M |
| Common stock total equity | - | - | - | 1.49M | 1.36M |
| Retained earnings total equity | - | - | - | 1031.39M | 879.78M |
| Treasury stock | - | - | - | -7.11M | -7.11M |
| Non currrent assets other | 1856.86M | 24.14M | 24.94M | 36.24M | 11.38M |
| Non current assets total | 6712.30M | 6778.32M | 6835.26M | 7803.67M | 1878.53M |
| Capital lease obligations | 98.60M | 72.16M | 68.99M | 80.72M | 60.10M |
| Long term debt total | - | - | - | 5632.93M | 937.03M |
| Breakdown | 2025-12-31 | 2024-12-31 | 2023-12-31 | 2022-12-31 | 2021-12-31 |
|---|---|---|---|---|---|
| Type | yearly | yearly | yearly | yearly | yearly |
| Date | 2025-12-31 | 2024-12-31 | 2023-12-31 | 2022-12-31 | 2021-12-31 |
| Investments | - | -67.08M | -175.80M | -4945.71M | -298.12M |
| Change to liabilities | - | - | - | 26.27M | 53.58M |
| Total cashflows from investing activities | -300.80M | -67.08M | 553.07M | -4945.71M | -298.12M |
| Net borrowings | -300.00M | -623.77M | -1256.23M | 4831.27M | -150.00M |
| Total cash from financing activities | -366.90M | -688.99M | -1297.54M | 4766.20M | -276.50M |
| Change to operating activities | - | - | - | -1.66M | 8.12M |
| Net income | 235.60M | 292.79M | 180.67M | 208.92M | 409.13M |
| Change in cash | 31.20M | -127.72M | -106.51M | 160.87M | -178.33M |
| Begin period cash flow | 329.20M | 456.93M | 563.44M | 402.56M | 580.89M |
| End period cash flow | 360.40M | 329.21M | 456.93M | 563.44M | 402.56M |
| Total cash from operating activities | 695.40M | 631.72M | 644.48M | 352.28M | 400.45M |
| Issuance of capital stock | - | - | - | 16.17M | 24.74M |
| Depreciation | 205.30M | 378.24M | 387.16M | 279.32M | 138.17M |
| Other cashflows from investing activities | 5.10M | -2.26M | 194.96M | -4479.52M | 4.45M |
| Dividends paid | 60.80M | 60.58M | 60.20M | -57.31M | -43.55M |
| Change to inventory | -43.10M | -76.71M | 102.75M | -203.34M | -168.37M |
| Change to account receivables | 40.30M | -49.03M | 0.61M | -59.64M | -86.77M |
| Sale purchase of stock | - | -16.83M | -12.11M | 16.17M | -67.11M |
| Other cashflows from financing activities | -12.80M | -18.68M | -17.00M | 5293.34M | 460.41M |
| Change to netincome | - | - | - | 40.47M | 58.01M |
| Capital expenditures | 299.20M | 315.61M | 456.85M | 466.19M | 210.63M |
| Change receivables | - | - | - | -59.64M | -86.77M |
| Cash flows other operating | - | - | - | 60.27M | 8.12M |
| Exchange rate changes | - | - | - | - | -4.17M |
| Cash and cash equivalents changes | - | - | - | 172.78M | -178.33M |
| Change in working capital | -7.30M | -108.98M | 65.48M | -238.37M | -196.73M |
| Stock based compensation | 69.30M | 65.86M | 61.37M | 66.58M | 29.88M |
| Other non cash items | 279.90M | 82.72M | 95.40M | 138.57M | 38.44M |
| Free cash flow | 396.20M | 316.12M | 187.63M | -113.91M | 189.83M |
Sector: Technology Industry: Semiconductor Equipment & Materials
|
Stock Name
|
Change
(USD) |
Price
(USD) |
Trailing
PE (x) |
Forward
PE (x) |
Price Sales
TTM (x) |
Price to Book Value (x)
|
Enterprise Value
to Revenue (x) |
Enterprise Value
to EBITDA (x) |
|---|---|---|---|---|---|---|---|---|
| ENTG Entegris Inc |
9.37 6.68% |
149.59 | 64.18 | 26.95 | 5.96 | 4.72 | 6.87 | 25.90 |
| ASML ASML Holding N.V. New York Registry Shares |
46.78 2.94% |
1635.57 | 48.54 | 41.49 | 17.21 | 23.21 | 14.06 | 36.48 |
| ASMLF ASML Holding NV |
37.28 2.35% |
1624.46 | 48.31 | 41.32 | 16.88 | 23.07 | 14.07 | 36.51 |
| AMAT Applied Materials Inc |
7.79 2.01% |
395.38 | 40.44 | 36.23 | 11.09 | 14.41 | 11.04 | 30.52 |
| TOELF Tokyo Electron Ltd. |
- -% |
58.10 | 38.96 | 29.50 | 0.06 | 10.52 | 9.30 | 32.18 |
Entegris, Inc. provides advanced materials and process solutions for the semiconductor and other high-technology industries in North America, Taiwan, South Korea, Japan, China, Europe, and Southeast Asia. It operates in two segments, Materials Solutions (MS) and Advanced Purity Solutions (APS). The MS segment provides materials-based solutions, such as chemical vapor and atomic layer deposition materials, chemical mechanical planarization slurries and pads, ion implantation specialty gases, formulated etch and clean materials, and other specialty materials. The APS segment offers filtration, purification, and contamination-control solutions for the semiconductor manufacturing processes, semiconductor ecosystem, and other high-technology industries. The company's customers include logic and memory semiconductor device manufacturers, semiconductor equipment makers, gas and chemical manufacturing companies, and wafer grower companies; and outsourced semiconductor assembly and test facilities, flat panel display equipment makers, and manufacturers of hard disk drive components and devices. It serves manufacturers and suppliers in the solar and life science industries, electrical discharge machining customers, glass manufacturers, aerospace manufacturers, and manufacturers of biomedical implantation devices. Entegris, Inc. was founded in 1966 and is headquartered in Billerica, Massachusetts.
| Name | Title | Year Born |
|---|---|---|
| Mr. Bertrand Loy | CEO, Pres & Director | 1966 |
| Mr. Gregory B. Graves | Exec. VP, CFO & Treasurer | 1961 |
| Ms. Susan Rice | Sr. VP of Global HR | 1959 |
| Mr. Clinton M. Haris | Sr. VP & Pres of Microcontamination Control | 1972 |
| Mr. Michael D. Sauer | VP, Controller & Chief Accounting Officer | 1966 |
| Dr. James Anthony O'Neill Ph.D. | Sr. VP & CTO | 1965 |
| Mr. Bill Seymour | VP of Investor Relations | NA |
| Mr. Joseph Colella | Sr. VP, Gen. Counsel, Chief Compliance Officer & Sec. | 1982 |
| Mr. William James Shaner | Sr. VP & Pres of Advanced Materials Handling | 1968 |
| Mr. Corey Rucci | Sr. VP of Bus. Devel. | 1960 |
Disclaimer - (*)This information, including any data, is sourced from Unicorn Data Services SAS, trading as EOD Historical Data (“EODHD”) on an ‘as is’ basis, using their API. We cannot guarantee the completeness or validity of the information and data provided on this page, as well as via the API. In some cases, the data may include analyst ratings or recommendations sourced through the EODHD API, which are intended solely for general information purposes.
This information does not consider your personal objectives, financial situation, or needs. Kalkine is not liable for any errors or omissions in the information provided or for any actions taken in reliance on it. You should seek advice from a financial adviser, stockbroker or other professional adviser (including taxation and legal advice) as necessary before acting on this information.

Download a free report with stock ideas and industry insights for general information.
Download Free Report Now →


Basic Materials
 +1.40%
Communication Services
+0.01%

Consumer Cyclical
+0.03%

Consumer Defensive
 -0.34%

Energy
-0.10%

Financial Services
+0.20%
Financials
-0.31%

Healthcare
+0.82%

Industrials
+0.61%

Real Estate
-0.30%

Technology
+1.27%

Utilities
+0.15%
Note: Daily price change (%) by sector excluding stocks with +/-90% daily price change. Companies above $500 million market capitalization are considered.
 Portfolio
 Watchlist


 Please wait processing your request...