 CA
 NZ
 UK
 AU
 IND

 US


…
Flag Ship Acquisition Corporation does not have significant operations. It focuses on effecting a merger, capital stock exchange, asset acquisition, stock purchase, reorganization with one or more businesses. The company intends to focus on businesses that have a connection to the Asian market. Flag Ship Acquisition Corporation was incorporated in 2018 and is based in New York, New York.
Source: TradingView
The charts and visual representations are sourced from TradingView through embedded widgets. For any issues with chart display, please visit the TradingView website
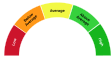
A unique technical analysis driven score developed by Kalkine showing momentum in stock prices based on select technical indicators identified.
Flag Ship Acquisition Corp is a publicly listed special-purpose acquisition company (SPAC) formed to raise capital and complete a business combination that would take a private company public. Long-term prospects depend on successfully closing and integrating a target and on the combined company's operating performance, with potential upside from access to public capital markets.
Material risks include absence of operating history before a merger, failure to complete a qualifying transaction within the SPAC's timeline (which can lead to liquidation), dilution from sponsor interests and redemptions, and sensitivity to market and regulatory conditions.

Note: The summary and risk score provided above is created by AI and should not be construed as a recommendation of Kalkine.


| Breakdown | 2024-12-31 | 2023-12-31 | 2022-12-31 | 2021-12-31 | 2020-12-31 |
|---|---|---|---|---|---|
| Type | yearly | yearly | yearly | yearly | yearly |
| Date | 2024-12-31 | 2023-12-31 | 2022-12-31 | 2021-12-31 | 2020-12-31 |
| Income before tax | 0.91M | -0.06M | -0.11M | -0.09M | -0.01M |
| Net income | 0.91M | -0.06M | -0.11M | -0.09M | -0.01M |
| Selling general administrative | 0.89M | 0.06M | 0.11M | 0.09M | 0.01M |
| Ebit | -0.89M | -0.06M | -0.11M | -0.09M | -0.01M |
| Ebitda | -0.89M | -0.06M | -0.11M | -0.09M | -0.01M |
| Operating income | -0.89M | -0.06M | -0.11M | -0.09M | -0.01M |
| Other operating expenses | 0.89M | 0.06M | 0.11M | 0.09M | 0.01M |
| Tax provision | 0.00M | 0.00M | 0.00M | 0.00M | 0.00M |
| Interest income | - | - | - | 0.00M | 0.00M |
| Net interest income | - | - | - | 0.00M | 0.00M |
| Total revenue | 0.00M | 0.00M | 0.00M | 0.00M | 0.00M |
| Total operating expenses | 0.89M | 0.06M | 0.11M | 0.09M | 0.01M |
| Total other income expense net | 1.80M | -0.06M | -0.11M | -0.09M | 0.00M |
| Net income from continuing ops | 0.91M | -0.06M | -0.11M | -0.09M | -0.01M |
| Breakdown | 2024-12-31 | 2023-12-31 | 2022-12-31 | 2021-12-31 | 2020-12-31 |
|---|---|---|---|---|---|
| Type | yearly | yearly | yearly | yearly | yearly |
| Date | 2024-12-31 | 2023-12-31 | 2022-12-31 | 2021-12-31 | 2020-12-31 |
| Total assets | 70.97M | 0.15M | 0.22M | 0.13M | 0.00M |
| Other current assets | 0.10M | 0.00M | 0.00M | 0.01M | - |
| Total liab | 2.44M | 0.43M | 0.44M | 0.21M | 0.02M |
| Total stockholder equity | 68.53M | -0.28M | -0.22M | -0.08M | -0.02M |
| Other current liab | 0.03M | - | 0.00M | - | - |
| Common stock | 70.80M | 0.00M | 0.00M | 0.00M | - |
| Capital stock | 70.80M | 0.00M | 0.00M | 0.00M | 0.00M |
| Retained earnings | -2.27M | -0.31M | -0.25M | -0.10M | -0.02M |
| Cash | 0.08M | 0.12M | 0.18M | 0.06M | 0.00M |
| Total current liabilities | 0.71M | 0.43M | 0.44M | 0.21M | 0.02M |
| Net debt | 0.60M | 0.32M | 0.25M | 0.15M | 0.02M |
| Short term debt | 0.68M | 0.43M | 0.43M | 0.21M | 0.02M |
| Short long term debt | 0.68M | 0.43M | 0.43M | 0.21M | 0.02M |
| Short long term debt total | 0.68M | 0.43M | 0.43M | 0.21M | 0.02M |
| Other stockholder equity | - | 0.02M | 0.02M | 0.02M | - |
| Total current assets | 0.17M | 0.12M | 0.19M | 0.07M | 0.00M |
| Non currrent assets other | 70.80M | 0.03M | 0.03M | 0.06M | - |
| Non current assets total | 70.80M | 0.03M | 0.03M | 0.06M | 0.00M |
| Breakdown | 2024-12-31 | 2023-12-31 | 2022-12-31 | 2021-12-31 | 2020-12-31 |
|---|---|---|---|---|---|
| Type | yearly | yearly | yearly | yearly | yearly |
| Date | 2024-12-31 | 2023-12-31 | 2022-12-31 | 2021-12-31 | 2020-12-31 |
| Investments | -69.00M | 0.00M | - | - | - |
| Total cashflows from investing activities | -69.00M | - | - | - | - |
| Net borrowings | -0.43M | 0.00M | - | - | - |
| Total cash from financing activities | 69.84M | 0.00M | 0.22M | 0.16M | 0.01M |
| Net income | 0.91M | -0.06M | -0.11M | -0.09M | -0.01M |
| Change in cash | -0.04M | -0.07M | 0.12M | 0.06M | 0.00M |
| Begin period cash flow | 0.12M | 0.18M | 0.06M | 0.00M | 0.00M |
| End period cash flow | 0.08M | 0.12M | 0.18M | 0.06M | 0.00M |
| Total cash from operating activities | -0.88M | -0.07M | -0.10M | -0.10M | -0.01M |
| Issuance of capital stock | 69.63M | 0.00M | - | 0.03M | 0.00M |
| Other cashflows from investing activities | -69.00M | - | - | - | - |
| Dividends paid | 1.80M | - | - | - | - |
| Other cashflows from financing activities | 2.44M | 0.00M | -0.01M | -0.06M | 0.01M |
| Capital expenditures | 0.00M | 0.00M | 0.00M | 0.00M | 0.00M |
| Change in working capital | 0.01M | -0.00M | 0.01M | -0.01M | 0.00M |
| Other non cash items | -1.80M | - | - | - | - |
| Free cash flow | -0.88M | -0.07M | -0.10M | -0.10M | -0.01M |
Sector: Financial Services Industry: Shell Companies
|
Stock Name
|
Change
(USD) |
Price
(USD) |
Trailing
PE (x) |
Forward
PE (x) |
Price Sales
TTM (x) |
Price to Book Value (x)
|
|---|---|---|---|---|---|---|
| FSHP Flag Ship Acquisition Corp. Ordinary Shares |
- -% |
11.35 | 42.04 | - | - | 1.85 |
| CLUS CLUS |
- -% |
200.00 | - | - | 0.09 | 0.92 |
| SGDH Sgd Holdings Ltd |
- -% |
0.11 | - | - | 59741.55 | 0.56 |
| LION Lionsgate Studios Holding Corp. |
-0.44 3.03% |
14.07 | - | 23.31 | 1.13 | 1.35 |
| QKIE QKIE |
- -% |
1.94 | - | - | 470.20 | - |
Flag Ship Acquisition Corporation does not have significant operations. It focuses on effecting a merger, capital stock exchange, asset acquisition, stock purchase, reorganization with one or more businesses. The company intends to focus on businesses that have a connection to the Asian market. Flag Ship Acquisition Corporation was incorporated in 2018 and is based in New York, New York.

26 Broadway, New York, NY, United States, 10004

646 362 0256
| Name | Title | Year Born |
|---|---|---|
| Mr. Matthew Chen | Chairman & CEO | 1972 |
| Mr. Luhuan Zhong | CFO & Principal Accounting Officer | 1990 |
Disclaimer - (*)This information, including any data, is sourced from Unicorn Data Services SAS, trading as EOD Historical Data (“EODHD”) on an ‘as is’ basis, using their API. We cannot guarantee the completeness or validity of the information and data provided on this page, as well as via the API. In some cases, the data may include analyst ratings or recommendations sourced through the EODHD API, which are intended solely for general information purposes.
This information does not consider your personal objectives, financial situation, or needs. Kalkine is not liable for any errors or omissions in the information provided or for any actions taken in reliance on it. You should seek advice from a financial adviser, stockbroker or other professional adviser (including taxation and legal advice) as necessary before acting on this information.

Download a free report with stock ideas and industry insights for general information.
Download Free Report Now →


Basic Materials
 -1.40%
Communication Services
-0.45%

Consumer Cyclical
-0.55%

Consumer Defensive
-0.01%

Energy
-0.01%

Financial Services
-0.40%
Financials
-0.15%

Healthcare
-1.15%

Industrials
-0.46%

Real Estate
-0.29%

Technology
-1.22%

Utilities
-0.10%
Note: Daily price change (%) by sector excluding stocks with +/-90% daily price change. Companies above $500 million market capitalization are considered.
 Portfolio
 Watchlist

 +0.55%
 Please wait processing your request...